
Today is Jhonny Peralta’s 31st birthday. Most major league baseball players have their best seasons at or before they turn 30, but Peralta might be making an attempt to buck that trend. His best MLB season to date was 2011 in which he accumulated 5.0 WAR, while his best offensive season was 2005 in which he he provided 136 wRC+. I separate the two because this post is about Peralta at the plate, so his considerable improvement according to the defensive metrics over the last few years is worth separating out. Let’s take a quick peak at Peralta in 2005 and 2011:
2005: .292/.366/.520, 136 wRC+, 4.4 WAR (570 PA)
2011: .299/.345/.478, 122 wRC+, 5.0 WAR (576 PA)
His best offensive season was 2005, when he was 23, and his second best was in 2011 when he was 29. At 31, he is making a run at his best season yet. So far, he’s hitting .341/.392/.500, 139 wRC+, 2.1 WAR (195 PA). If we assume he will play 150 games based on career norms, he is set to accumulate career best 7.0 WAR.
But he likely won’t keep up this pace because this is a borderline MVP pace and he’s never done that before and players generally don’t get significantly better after age 30. A player’s performance is also not uniform over an entire season and it would be wrong to assume he will play at this pace for the rest of the year simply because that would be unlikely even if he did get tangibly better.
One of the reasons Peralta isn’t going to keep this up is because he has a very high, unsustainable Batting Average on Balls in Play (BABIP), which is a statistic we associate with luck. The standard BABIP rule of thumb is that .300 is where you expect most players to converge toward, with better hitters maintaining numbers in the middle .300s. The idea here is that when you put the ball in play, you only have control over how hard you hit it and the precise location is outside of your control. Sometimes you’ll smoke a baseball and it will be caught and sometimes a bloop hit will fall. In general, these take a a couple thousand plate appearances to balance out.
This is not to say that hitters can’t influence their BABIPs with their approach and talent level, but rather that BABIP will regress toward a player’s career norm and that small sample BABIPs can lead you to make mistaken predictions.
Jhonny Peralta’s BABIP in 2013 is .414. That’s very high. His career BABIP entering 2013 was .310, meaning it is unlikely that Peralta will be able to maintain his high BABIP, and with it, his current level of production. It’s possible that he got better, but it is not possible his true talent level is now a .414 BABIP.
The highest BABIP among active players is .367, with a number of the games’ best hitters in the .330 to .360 range. The highest modern day BABIP is Ty Cobb, coming in at .378. League average BABIP for non-pitchers over the last 10 years hovers between .294 and .305.
This is all by way of saying that Peralta’s early season success isn’t around to stay. He’s still very capable of having a great year, but it isn’t going to look like this, don’t fool yourself.
But as I gathered my thoughts last week and discovered his high BABIP, I thought, “Meh, a high BABIP post isn’t interesting. He’ll regress back toward career norms and will have a solid, 2011 type season. Nothing wrong with that, but not super interesting to write about.”
Well, then I thought to myself, perhaps I’m missing something. Perhaps Peralta’s good BABIP luck is hiding an actual improvement in his skills. Maybe he’s gotten better and luckier in his 31st year on Earth.
Peralta is walking and striking out at rates almost identical to his career rates and his Isolated Slugging Percentage (ISO) is even more identical to his career line. His triple slash line is equally buoyed this year by about 70 points all the way around (74/62/75):
Career: .267/.330/.425
2013: .341/.392/.500
If you erase the BABIP increase, he’s pretty much the Jhonny Peralta you knew. So how much, if at all, is the BABIP increase a change in skill?
Wait a second! Peralta is doing something different if you look at the results:

Peralta is hitting more line drives and more groundballs at the expense of hitting the ball in the air. This is important because line drives and groundballs are more likely to go for hits than flyballs, which could actually make his BABIP shift reasonable in direction if not in magnitude. In other words, the balls are coming off Peralta’s bat this season on a different trajectory that they did in the past. This could be something.
If we look at his spray charts from April and May from 2012 and 2013 we notice he’s using the lines more effectively this year, but the comparison I want to show you is the one between 2010 and 2013 because it shows the difference between a flyball heavy approach and a groundball heavy approach as you can divine from the graph above:
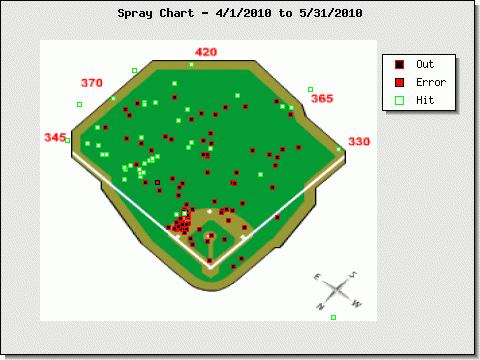
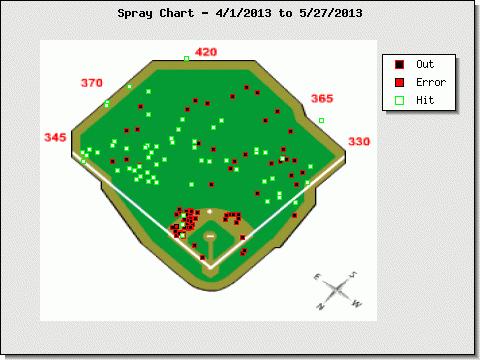
What we see here is that as Peralta has changed as a hitter, he has started to get hits to right field. Everyone knows that. He’s definitely learned to go the other way, but what is also striking to me is that he is also making fewer outs in the air to left field. He’s making fewer outs in the outfield period. He’s getting a band of hits in front of the outfielders in a way that didn’t happen in 2010.
So while Peralta’s numbers this year are great, his high BABIP means he’s not going to keep up this pace. But if you look at the batted ball data, you can see that he changing the way he makes contact to some degree and is inducing different trajectories off the bat. He’s not a 7.0 WAR player like the pace indicates, but there is reason to believe that if he continues to impress the defensive metrics, he may hit well enough to approach another 5.0 win season.

[…] On His Hot Start […]