How Was The Game? (September 21, 2014)

One you expected eventually.
Royals 5, Tigers 2
It was not Rick Porcello’s (30 GS, 201 IP, 3.31 ERA, 3.56 FIP, 3.4 fWAR) day. He didn’t have his command and the Royals put pressure on him early and often, bouncing him afer 3.1 innings, nine hits, four runs, two walks, and one strikeout. The Tigers got one back on a Kinsler home run and another on an extremely rough error by Moustakas in the 4th. The bullpen did solid enough work, allowing just one additional run but the Tigers couldn’t get to Guthrie before the Royals unleashed their three-headed monster and they managed to salvage the finale of the three game series. The Tigers will head home with a 1.5 game lead in the division with the Royals likely to lose the suspended game tomorrow afternoon. That means the magic number is effectively six with seven full games to play. Kyle Lobstein (4 GS, 27.2 IP, 3.58 ERA, 3.96 FIP, 0.3 fWAR) is slated for Monday.
The Moment: Hardy strikes out Gordon to avoid disaster in the 4th.
The Nine Worst Sacrifice Bunts of 2013
So now that we have sufficiently killed the win, bunting seems to be the topic of the day. Last week there were many examples of managers employing the sacrifice bunt at silly times and it seemed to set off a fervor among those wishing to debate new ideas and old tradition. I got into some debates with followers – and you all know Brian Kenny did the same.
The basic argument against the sacrifice bunt is that giving up and out to gain a base is a bad percentage play. The facts are pretty clear on the matter. You have to consider who is batting and the exact situation of the game, but it’s usually always a bad idea to bunt with a reasonably competent position player. Below I’ve presented The Nine Worst Sacrifice Bunt Attempts of 2013. This requires some definition, but first I want to lay out the basic argument for when bunting might be a good idea because some often taking anti-bunting comments as absolute:
When To Bunt
- When a pitcher is batting OR
- When a very low quality hitter is up AND
- There are zero outs AND
- There are men on first and second AND
- The batter has a high probability of striking out based on his skills or the opposing pitcher AND
- One run is sufficient (i.e., you’re down one run late or tied)
The Odds Against Bunting
Here’s my post from earlier this year that outlines Run Expectancy. If you don’t like the way I explain it, just Google it. Lots of smart people have explained it.
The Rules
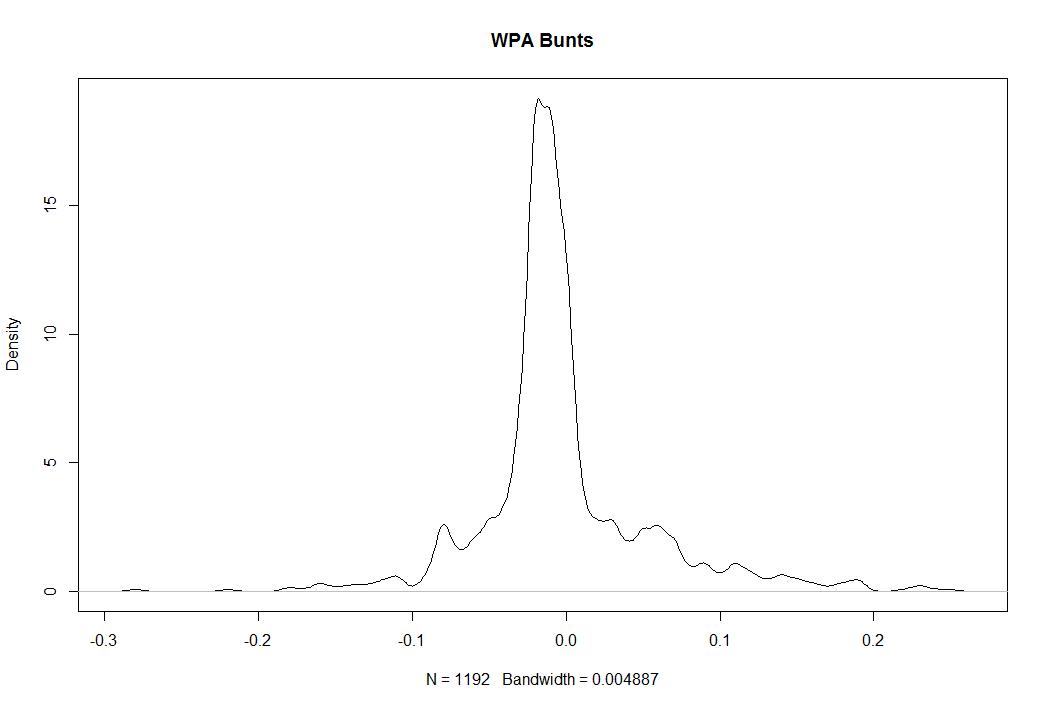
So the following are The Nine Worst Bunt Attempts of the year as defined like this. First, these are all bunts that have been put in play. I can’t examine the times a batter failed to get a bunt down and then the bunt sign was taken off. Second, this does not include bunts that went for hits. Bunting for a hit is great, this is about bunts in which an out was made – which is the goal of a bunt. Get on base and we don’t have a problem. Third, this is judged by Win Probability Added (WPA), which considers the game situation and the result of the play. So, if you call a bunt in a 10-0 game, who cares. If you call for a bunt in a 5-3 game with your two hitter, that’s probably silly. Finally, no pitchers. Pitchers can’t hit, so it’s fine to use them to bunt. Let’s see what happens!
There have been 1,192 sacrifice bunt attempts this season by non-pitchers. 174 have gone for hits and 39 have been turned into errors, so that’s 979 bunt attempts that resulted in at least one out. In sum, they have been worth -2.7 WPA. Here are the worst.
Let’s start with some data that sets the stage.
| Rank | Date | Batter | Tm |
| 9 | 9/16/2013 | Juan Uribe | LAD |
| 8 | 8/14/2013 | Alberto Callaspo | OAK |
| 7 | 8/14/2013 | Martin Prado | ARI |
| 6 | 8/10/2013 | Stephen Vogt | OAK |
| 5 | 9/9/2013 | Jonathan Herrera | COL |
| 4 | 9/18/2013 | Munenori Kawasaki | TOR |
| 3 | 4/25/2013 | Juan Pierre | MIA |
| 2 | 4/11/2013 | Brendan Ryan | SEA |
| 1 | 4/9/2013 | Rob Brantly | MIA |
There we have the date and hitters. Now the opponent and situation:
| Rank | Opp | Pitcher | Score | Inn | RoB | Out |
| 9 | @ARI | Brad Ziegler | down 2-1 | t9 | -12 | 0 |
| 8 | HOU | Josh Fields | down 2-1 | b11 | -2- | 0 |
| 7 | BAL | Jim Johnson | down 4-3 | b9 | -2- | 0 |
| 6 | @TOR | Casey Janssen | down 5-4 | t9 | -12 | 0 |
| 5 | @SFG | Javier Lopez | tied 2-2 | t10 | 1– | 0 |
| 4 | NYY | Mariano Rivera | down 4-3 | b9 | -12 | 0 |
| 3 | CHC | Carlos Marmol | down 4-3 | b9 | -12 | 0 |
| 2 | TEX | Robbie Ross | down 4-3 | b8 | 3 | 1 |
| 1 | ATL | Craig Kimbrel | down 3-2 | b9 | 1– | 0 |
All but one feature no outs and the hitting team has been trailing late or tied in each.
| Rank | Batter | WPA | RE24 | LI | Play Description |
| 9 | Juan Uribe | -0.16 | -0.56 | 5.6 | Bunt Groundout: P-3B/Forceout at 3B (Front of Home); Schumaker to 2B |
| 8 | Alberto Callaspo | -0.16 | -0.42 | 4.38 | Bunt Popfly: P (Front of Home) |
| 7 | Martin Prado | -0.16 | -0.42 | 4.38 | Bunt Groundout: P-1B (Front of Home) |
| 6 | Stephen Vogt | -0.16 | -0.58 | 5.48 | Bunt Groundout: P-3B/Forceout at 3B (Front of Home); Crisp to 2B |
| 5 | Jonathan Herrera | -0.17 | -0.68 | 3.51 | Bunt Ground Ball Double Play: Bunt C-SS-2B (Front of Home) |
| 4 | Munenori Kawasaki | -0.18 | -0.58 | 6.13 | Bunt Groundout: 1B-3B/Forceout at 3B (Front of Home); Rasmus to 2B |
| 3 | Juan Pierre | -0.18 | -0.56 | 6.21 | Bunt Groundout: C-3B/Forceout at 3B (Front of Home); Kearns to 2B |
| 2 | Brendan Ryan | -0.22 | -0.69 | 4.33 | Fielder’s Choice P; Chavez out at Hm/P-C; Ryan to 1B |
| 1 | Rob Brantly | -0.28 | -0.74 | 5.4 | Bunt Pop Fly Double Play: Bunt 3B (Short 3B Line); Solano out at 1B/3B-1B |
Alright, so a few notes. The very worst bunts are almost always the ones that include double plays or a runner getting thrown out at home somehow. Which makes sense, any time a bunt goes horribly wrong, it’s going to be more costly than a normal bunt. Martin Prado’s at #7 is the worst true sac bunt of the lot because the runner didn’t advance and Prado made an out.
So it’s perfectly reasonable to say these are poorly executed bunts. That’s true. But it’s not interesting to show you 9 very similar bunts that are all in the -4% range in the same situations. There are just so many of them. But, let me provide some summary stats to give you a better idea about the whole dataset. Of the 979 bunts that didn’t result in a hit or error, 722 resulted in a decrease in WPA, 160 resulted in no change, and 97 increased the team’s odds of winning. In other words, only 26% of sac bunts in the sample are good for the team.
So 18% of the time a batter attempts to sac bunt, he gets a hit or induces and error. That’s good. And 26% of the remaining 82% helps anyway. All told, about one quarter of position player bunts turn out to be a good idea based on WPA. Let’s go further.
Even including all of the bunts that ended in hits and errors, 276 resulted in more than one run, 339 resulted in one run exactly, and 577 resulted in zero runs. There are good bunts, but bunting is usually a bad idea. There are bunts that mess up the defense and open the door, but they are rare. Usually when you bunt, you don’t score.

You’re welcome to keep bunting, but the odds are not in your favor.
The Nine Worst Wins of 2013
If you’re here, you’ve likely been exposed to our series on pitcher wins and why we want to kill them. It’s become a pretty big topic of conversation around baseball and some people are calling for a cease fire because the win has been repeatedly slaughtered to the point that we’ve probably violated the Geneva Convention. So, I’ll make sure to avoid overdoing it because apparently #KillTheWin is sabr-bullying. If you’re new to the cause, check out the groundwork for why wins are a terrible statistic and then enjoy The Nine Worst Wins from 2013 (as of Sept 13th).
- You Can Have A Great Season and Not Win
- You Can Have A Bad Season and Win A Lot
- Wins Don’t Even Out in Big Samples
- A Case Study in Wins
- 12 Assorted Facts About Wins from 2013
- Dissecting the Case for Wins
- A Replacement for Wins
So the methodology is quite simple. Below are the pitchers in 2013 who have earned a “win” sorted by the lowest Win Probability Added (WPA). What WPA does is measure how much the team’s likelihood of winning changed as a result of every play and assigns that value to the pitcher and batter who took part. It’s not a perfect stat for measuring a player’s performance but it works for our purposes here for a simple reason. If a pitcher’s team scores 10 runs in the first inning, that pitcher can pitch poorly and get a win, but most of the pro-win alliance thinks that’s okay. They believe in something called “pitching to the score” which has been shown to be fiction. So in order to make the point clearly, I’ll use WPA which is entirely dependent on context. If you’re up 10, you’re allowed to give up 5. If you’re up 1, you better not give up two.
There are other ways to do this, but I think this is the most valuable way to do it given the audience still in need of persuasion.
| Rk | Player | Date | Tm | Opp | Rslt | App,Dec |
| 9 | Randall Delgado | 2-Aug | ARI | BOS | W 7-6 | GS-6 ,W |
| 8 | Brandon League | 31-May | LAD | COL | W 7-5 | 9-9 ,BW |
| 7 | CC Sabathia | 18-Aug | NYY | BOS | W 9-6 | GS-6 ,W |
| 6 | Alfredo Simon | 22-Apr | CIN | CHC | W 5-4 | 13-13f,W |
| 5 | Rafael Soriano | 17-May | WSN | SDP | W 6-5 | 9-9 ,BW |
| 4 | Matt Belisle | 28-Jul | COL | MIL | W 6-5 | 8-8 ,BW |
| 3 | Joe Smith | 26-Jun | CLE | BAL | W 4-3 | 8-8 ,BW |
| 2 | Michael Wacha | 19-Aug | STL | MIL | W 8-5 | 7-7 ,BW |
| 1 | Kyuji Fujikawa | 12-Apr | CHC | SFG | W 4-3 | 9-9f ,BW |
| Rk | Player | IP | H | R | ER | BB | SO | HR | Pit |
| 9 | Randall Delgado | 6 | 6 | 6 | 4 | 1 | 7 | 2 | 97 |
| 8 | Brandon League | 1 | 2 | 2 | 2 | 0 | 1 | 1 | 26 |
| 7 | CC Sabathia | 5.1 | 7 | 6 | 6 | 5 | 5 | 1 | 103 |
| 6 | Alfredo Simon | 1 | 1 | 2 | 1 | 0 | 1 | 1 | 15 |
| 5 | Rafael Soriano | 1 | 4 | 2 | 2 | 0 | 0 | 0 | 19 |
| 4 | Matt Belisle | 1 | 2 | 2 | 2 | 0 | 2 | 1 | 23 |
| 3 | Joe Smith | 1 | 3 | 2 | 2 | 1 | 0 | 0 | 21 |
| 2 | Michael Wacha | 1 | 4 | 3 | 3 | 0 | 1 | 1 | 30 |
| 1 | Kyuji Fujikawa | 1 | 3 | 3 | 3 | 0 | 0 | 0 | 30 |
| Rk | Player | ERA | RE24 | WPA |
| 9 | Randall Delgado | 6.00 | -2.939 | -0.392 |
| 8 | Brandon League | 18.00 | -1.479 | -0.404 |
| 7 | CC Sabathia | 10.12 | -3.472 | -0.410 |
| 6 | Alfredo Simon | 9.00 | -1.537 | -0.417 |
| 5 | Rafael Soriano | 18.00 | -1.594 | -0.430 |
| 4 | Matt Belisle | 18.00 | -1.479 | -0.431 |
| 3 | Joe Smith | 18.00 | -1.490 | -0.528 |
| 2 | Michael Wacha | 27.00 | -2.537 | -0.557 |
| 1 | Kyuji Fujikawa | 27.00 | -2.537 | -0.745 |
To date, there have been 282 wins in which the pitcher had a negative WPA in 2013. Above you’ve seen the nine worst including Fujikawa having just about the worst performance I could imagine in a win using this method. In fact, as far back as we have WPA data, it’s the 14th worst such win.
It looked like this! That’s pretty bad.

This is all by way of saying that wins aren’t a useful statistic and that even if we allow for the idea of pitching to the score, we still have a ton of ridiculous wins every season. If every win was handed out perfectly the rest of the season, we would still have seen 11.6% of the wins in 2013 go to pitchers who hurt their team’s chance to win.
#KillTheWinButDoItWithoutBeingSoDramatic
The Nine Pitchers Who Give Up The Most Unearned Runs
Something I’ve always found interesting is that pitchers get to deduct unearned runs from their ERA but they don’t get to deduct runs from their ERA when their defense doesn’t make an easy play that they should have. In the past, I’ve highlighted more advanced ways to demonstrate to measure a pitcher’s value that factors out defense like FIP, xFIP, and others and I’ve also pointed out why this distinction between ERA and Runs Allowed/9 is a little bit arbitrary.
Below, for no other reason than to think about something we almost never think about, are the pitchers who have allowed the most unearned runs in 2013 and the pitchers who have allowed the highest percentage of their runs in an unearned run fashion (min 50 IP).
| Rank | Name | Team | UER | UER% | ERA | IP | R | ER |
| 9 | Stephen Strasburg | Nationals | 10 | 16.13% | 2.85 | 164 | 62 | 52 |
| 8 | Hector Santiago | White Sox | 10 | 16.39% | 3.43 | 133.2 | 61 | 51 |
| 7 | Justin Verlander | Tigers | 10 | 11.90% | 3.59 | 185.2 | 84 | 74 |
| 6 | Ryan Dempster | Red Sox | 10 | 10.64% | 4.79 | 157.2 | 94 | 84 |
| 5 | Lucas Harrell | Astros | 11 | 11.22% | 5.69 | 137.2 | 98 | 87 |
| 4 | C.J. Wilson | Angels | 12 | 14.63% | 3.42 | 184 | 82 | 70 |
| 3 | Jeremy Hefner | Mets | 12 | 16.00% | 4.34 | 130.2 | 75 | 63 |
| 2 | Edwin Jackson | Cubs | 13 | 13.27% | 4.91 | 155.2 | 98 | 85 |
| 1 | Wily Peralta | Brewers | 17 | 17.00% | 4.51 | 165.2 | 100 | 83 |
| Rank | Name | Team | UER | UER% | ERA | IP | R | ER |
| 9 | Rex Brothers | Rockies | 3 | 20.00% | 1.81 | 59.2 | 15 | 12 |
| 8 | Charlie Furbush | Mariners | 5 | 20.00% | 3.16 | 57 | 25 | 20 |
| 7 | Stephen Fife | Dodgers | 4 | 21.05% | 2.55 | 53 | 19 | 15 |
| 6 | Tanner Scheppers | Rangers | 4 | 22.22% | 2.04 | 61.2 | 18 | 14 |
| 5 | Taylor Jordan | Nationals | 6 | 22.22% | 3.66 | 51.2 | 27 | 21 |
| 4 | Burke Badenhop | Brewers | 7 | 22.58% | 3.62 | 59.2 | 31 | 24 |
| 3 | Charlie Morton | Pirates | 9 | 23.08% | 3.00 | 90 | 39 | 30 |
| 2 | Craig Breslow | Red Sox | 4 | 25.00% | 2.12 | 51 | 16 | 12 |
| 1 | Bobby Parnell | Mets | 5 | 29.41% | 2.16 | 50 | 17 | 12 |
I think it’s important to think about this because we all agree that a pitcher isn’t responsible for every run he allows, but he also isn’t without blame for all of them either. Earned and unearned runs are the traditional line we draw, but there is nothing that meaningful about such a boundary. These runs count against the team and plenty of unearned runs aren’t the pitcher’s fault.
Food for thought.
The Nine Best Seasons from Non-Qualifying Hitters (since ’62)
When we talk about postseason statistical titles or when we break down numbers, we often talk about performance among qualifying players. For hitters, this means among players who have had 3.1 PA or more per each team game. Over the course of 162 games, that works out to just over 502 PA in a season. But players who don’t reach that threshold can still be valuable and I’d like to highlight some of the best.
Here are the basic rules. First, this is since 1962 when both leagues went to the 162 games schedule and I’ve dropped out all seasons with labor stoppages. I’ve also rounded down to 500 PA just for simplicity and because sometimes a team plays 161 or 163 games or whatever. Don’t get caught up the technicalities. Below are The Nine best ranked by WAR with the recognition that defensive numbers are pretty imprecise when we go back beyond the last 10 or so seasons.
| Rank | Season | Name | Team | G | PA | Fld | BsR | WAR |
| 9 | 2001 | J.D. Drew | Cardinals | 108 | 443 | 9.0 | 1.3 | 5.6 |
| 8 | 1970 | Bernie Carbo | Reds | 125 | 467 | 2.0 | 0.6 | 5.6 |
| 7 | 2012 | Joey Votto | Reds | 111 | 475 | 6.2 | -3.5 | 5.6 |
| 6 | 1992 | Rickey Henderson | Athletics | 116 | 500 | 3.0 | 5.2 | 5.6 |
| 5 | 1996 | Scott Brosius | Athletics | 114 | 500 | 19 | 0.4 | 5.8 |
| 4 | 1982 | Gary Roenicke | Orioles | 135 | 477 | 21 | -1.6 | 5.9 |
| 3 | 1995 | Mike Piazza | Dodgers | 112 | 475 | -2.0 | 0.1 | 6.0 |
| 2 | 1993 | Rick Wilkins | Cubs | 132 | 500 | 14 | 0.1 | 6.7 |
| 1 | 2003 | Javy Lopez | Braves | 129 | 495 | 1.0 | -1.2 | 6.8 |
And for more detailed information on those seasons:
| Rank | Season | Name | HR | AVG | OBP | SLG | wOBA | wRC+ |
| 9 | 2001 | J.D. Drew | 27 | 0.323 | 0.414 | 0.613 | 0.429 | 162 |
| 8 | 1970 | Bernie Carbo | 21 | 0.310 | 0.454 | 0.551 | 0.441 | 170 |
| 7 | 2012 | Joey Votto | 14 | 0.337 | 0.474 | 0.567 | 0.438 | 177 |
| 6 | 1992 | Rickey Henderson | 15 | 0.283 | 0.426 | 0.457 | 0.401 | 158 |
| 5 | 1996 | Scott Brosius | 22 | 0.304 | 0.393 | 0.516 | 0.392 | 131 |
| 4 | 1982 | Gary Roenicke | 21 | 0.270 | 0.392 | 0.499 | 0.397 | 148 |
| 3 | 1995 | Mike Piazza | 32 | 0.346 | 0.400 | 0.606 | 0.427 | 168 |
| 2 | 1993 | Rick Wilkins | 30 | 0.303 | 0.376 | 0.561 | 0.400 | 144 |
| 1 | 2003 | Javy Lopez | 43 | 0.328 | 0.378 | 0.687 | 0.442 | 170 |
All of these, as you would expect feature players who came very close to qualifying. Should you be curious Justin Morneau’s 2010 season of 4.9 WAR is the highest on the list among players who had fewer than 400 PA.
The Nine Pitchers Who Slowed Their Pace The Most in 2013
That’s a long headline but a simple topic. Which pitchers have increased their average time between pitches the most this year? Below I will present the The Nine pitchers with the largest increases from 2012 to 2013 among those who have thrown 100 innings in both seasons. I will also provide some descriptive stats about the entire sample because for whatever reason, I find “Pace” to be very interesting. Pace is housed over at FanGraphs and here is a link to the current rankings. For 2013, the slowest qualifying starter is Jeremy Hellickson who takes 25.7 seconds between pitches. RA Dickey is the quickest at 17.8, with league average at 22.6.
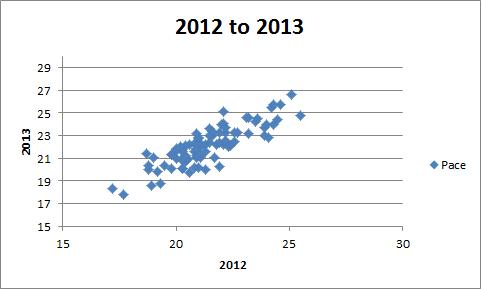
You can see that Pace is pretty consistent and that last year’s pace is a pretty good predictor of this year’s pace with an r squared of .72, meaning that about 72% of the variation in 2013 Pace can be explained by 2012 pace. Below are the players who most buck that trend.
| Rank | Name | Pace Diff | K/9 d | BB/9 d | ERA d | FIP d |
| 9 | Jerome Williams | 1.8 | -0.6 | 0.9 | 0.22 | 0.69 |
| 8 | Dillon Gee | 1.9 | -1.2 | -0.1 | -0.50 | 0.25 |
| 7 | Kyle Kendrick | 2.0 | -1.4 | -0.7 | 0.55 | -0.34 |
| 6 | Madison Bumgarner | 2.0 | 0.3 | 0.7 | -0.53 | -0.26 |
| 5 | Adam Wainwright | 2.1 | -0.1 | -1.2 | -1.36 | -0.77 |
| 4 | Anibal Sanchez | 2.1 | 2.1 | 0.4 | -1.41 | -1.19 |
| 3 | Jarrod Parker | 2.3 | -0.6 | -0.2 | 0.24 | 0.82 |
| 2 | Joe Blanton | 2.7 | -0.5 | 0.5 | 1.41 | 1.21 |
| 1 | David Price | 3.0 | -1.5 | -1.2 | 0.73 | 0.26 |
Positive numbers indicated an increase in 2013 over 2012. For example, Anibal Sanchez’s K/9 is up 2.1 and his FIP is down 1.19. What’s interesting is some pitchers who have slowed down have improved and some have gotten worse. Some have added Ks and BBs, some have cut both, and some have gone in opposite directions. Pretty much, this doesn’t seem very useful in predicting performance.
It’s interesting, though, that on this list we have some elite pitchers and some back end guys. I’m not sure if there is a clear take away from this other than that Pace probably doesn’t correlate that much with anything that has to do with performance on a broad scale and that it matters a lot to each pitcher but it matters in different ways. Let’s just take a quick look at FIP- up against Pace for 2013 qualifiers to illustrate that point:

Oh well, I’m still going to pretend it matters. It matters to fans, at least.
The Nine Most Underrated Baserunners of 2013
Here are New English D we like to dig below surface stats and discover the complete value of players. This post will illustrate that using a player’s value on the bases. Earlier this year we published a piece on the Tigers’ value on the bases that explained a number of baserunning statistics, most notably for our purposes here, UBR and wSB. wSB is a very simple stat that calculates the run value of stealing a base and getting caught. To calculate it you multiple a player’s SB by .2 and their CS by about -.38 and then scale that number based on league average so that a wSB of 0 is set to league average. Here’s the full formula from FanGraphs. UBR is a little more complicated but carries the same principles of turning advancing on the bases into run values that deviate from a league average of 0. Here’s how FanGraphs explains it.
The basic premise of both stats is that taking an extra base is almost always less valuable than getting thrown out is costly. You want to advance on the bases, but you REALLY don’t want to be thrown out. Below are The Nine Best Baserunners from 2013 who have negative value when it comes to stealing bases and positive value when it comes to running the bases when the ball is in play. For me, these are the most underrated baserunners because their stolen bases numbers aren’t good, but the rest of their numbers are great. Stats are for qualifying players entering games on August 17th.
| Rank | Name | Team | PA | UBR | wSB | SB | CS |
| 9 | Gregor Blanco | Giants | 388 | 2.4 | -0.1 | 11 | 5 |
| 8 | Yoenis Cespedes | Athletics | 434 | 2.4 | -1.8 | 6 | 7 |
| 7 | Marlon Byrd | Mets | 426 | 2.6 | -1.5 | 2 | 4 |
| 6 | Matt Carpenter | Cardinals | 534 | 2.8 | -1.5 | 1 | 3 |
| 5 | Brandon Crawford | Giants | 433 | 2.9 | -0.9 | 1 | 2 |
| 4 | Michael Bourn | Indians | 415 | 3.0 | -0.5 | 17 | 9 |
| 3 | Joey Votto | Reds | 547 | 3.2 | -0.4 | 5 | 2 |
| 2 | Brian Dozier | Twins | 443 | 3.2 | -0.9 | 9 | 6 |
| 1 | Austin Jackson | Tigers | 433 | 5.3 | -0.7 | 6 | 4 |
This list has a variety of different players on it. First, we have a couple of players who steal a decent number of bases but get caught too often for it to be worth it (Blance, Bourn, Dozier). We also have players who have decent speed but don’t run very often for a number of reasons (Cespedes, Crawford, Jackson). But we also have guys who aren’t know for their wheels but do a great job taking extra bases (Byrd, Carpenter, and Votto).
Votto and Carpenter really stand out to be because you would never think of them as good baserunners, in fact, some might call them “base-cloggers” because they get on base a lot and aren’t fleet of foot. It turns out they are very good baserunners who simply don’t get any credit because they don’t steal bases. Carpenter and Votto are actually above average baserunners overall despite their inability to steal. They also happen to be great hitters and fielders, so that’s a nice combination.
What this list tells you is that baserunning is not as simple as speed and stolen bases. Slow guys who don’t steal can add a lot of value if they have good instincts and read the ball well off the bat. Additionally, this is a good example of why advanced stats can be helpful. The basic baserunning stat (SB) would completely ignore most of these players and we would have no idea that they are so valuable.
If nothing else, this should cement how fantastic Joey Votto is at baseball.
The Nine Best Baseball People To Follow On Twitter
The headline covers most of what the following post will be. But I’ll make a few quick points. Baseball is fun and it’s a lot of fun to follow along and interact with people on Twitter about it. The following list has a few rules. First, these are not people you follow for news. Ken Rosenthal breaks lots of stories, but this list is about people who you follow because of their interesting commentary, not their ability as a reporter. Current players are also not eligible. Second, the account doesn’t have to reflect a person but it can’t be an entity like MLB or ESPN. Three, I’m not listing anyone I have a professional affiliation with. It wouldn’t really matter because this is a fun list and I can’t imagine anyone finding a way to profit from this, but it just felt more ethical. Finally, these accounts are being judged only by baseball tweeting. No points for your literature or food tweeting. Both quality and quantity are considered. Just like “Whose Line Is It Anyway?” everything is made up and the points don’t matter.
Honorable Mention. Batting Stance Guy
On the list for humor. I don’t follow him, but got some recommendations to put him on the list and I’m all about listening:
9. Keith Law
Law is pretty popular for his “snark” and hilarious ability to retweet people who don’t know the difference between your and you’re, but he’s worth a follow because he provides solid baseball commentary in most cases and it well informed on prospects. Mostly, his invention of #umpshow is reason enough.
https://twitter.com/keithlaw/status/364934374589870080
8. Heard on MLB Tonight
This is the designated Twitter account for pointing out hilariously off base baseball commentary.
https://twitter.com/HeardOnMLBT/status/365209714885271552
7. MLB Fake Rumors
This is a great play on MLB Trade Rumors. Their only failure is that they don’t tweet often enough.
6. Mark Simon
Simon posts a ton of statistical breakdowns and tidbits and is great about looking into advanced data for followers.
5. Dave Cameron
Cameron is the managing editor of FanGraphs and is just an excellent baseball analyst.
4. Can Predict Ball
These guys tweet when something hilariously predictable happens. Must follow.
3. Brian Kenny
Kenny is the mainstream media’s sabermetric champion and does a nice job providing commentary and taking people to task for not opening their minds.
https://twitter.com/MrBrianKenny/status/365670704982671360
2. Jeff Sullivan
Sullivan makes excellent observations about baseball, but is also supremely funny and always tweets what I’m thinking about national writers who tweet silly rumors.
1. You Can’t Predict Ball
They tweet when unpredictable things happen, which is just about the best thing about baseball.
The Nine Most Misleading Batting Averages of 2013
On this site, we often discuss which statistics are misleading and which statistics are better at determining a player’s value. Over in our Stat Primer section we have tons of posts about why pitcher wins are bad and why RBI aren’t a good way to measure individual players. We also have a post about why on base percentage is better than batting average and why you should use Weighted On Base Average (wOBA) if you’re really only interested in looking at a single number because it weighs each type of hit based on its actual contribution to scoring. You want to look at stats that correlate more highly with scoring and OBP and wOBA are much better than batting average (just click the OBP v AVG link above to see for yourself).
All in all, for hitters I’d tell you to look at Weighted Runs Created Plus (wRC+) because that is a park and league adjusted version of wOBA, meaning that you can compare players at Petco and Camden Yards and players from 2010 and 1960. It’s simple to understand as 100 is average and anything above it is that % better than average and anything below it is that much worse. One of our main goals is to make advanced statistics more popular in the broader baseball community because we think they will improve your enjoyment of the game.
Simply put, many of the traditional stats were invented before we knew enough and had the ability to calculate better ones. It’s always important to move forward. Today, I’m offering a bit of evidence from the 2013 season about why you should look beyond batting average when judging a player. Below you will find The Nine Most Misleading Batting Averages so far this season. The rules are simple. These are players who have a below average batting average and above average offensive value or an above average batting average and below average overall value. Players who had really good batting averages that still undersold their value (think Cabrera) are not included because that would just be a list of the best hitters in baseball and that would be boring.
Think of these players as guys who either walk a ton or not at all and/or guys with lots of power or no power. Batting average treats every hit the same and ignores walks. That’s not a good idea. Batting average is a fine stat, but it should only be a compliment to on base percentage if you want something simple and wOBA or wRC+ if you want something more daring. This is a plot of AVG and wRC+ to show you that while batting average is important in determining offensive value, there is a lot it doesn’t explain. About 54% of the variation in wRC+ can be explained by average. Walks, power, and ballpark make up the rest and we shouldn’t ignore them:

It’s important to note that I make no adjustment for position, meaning that these are all deviations from league average (.257 AVG) and not based on their respective positions. These are batting averages that don’t tell the whole story about a player, not batting averages that explain positional value.
| Rank | Name | Team | PA | BB% | AVG | OBP | SLG | wOBA | wRC+ |
| 9 | Jose Altuve | Astros | 436 | 5.50% | 0.284 | 0.323 | 0.362 | 0.298 | 87 |
| 8 | Brandon Moss | Athletics | 346 | 9.50% | 0.241 | 0.321 | 0.456 | 0.338 | 116 |
| 7 | Pedro Alvarez | Pirates | 402 | 8.00% | 0.240 | 0.301 | 0.490 | 0.337 | 117 |
| 6 | Chris Carter | Astros | 390 | 12.30% | 0.214 | 0.315 | 0.432 | 0.327 | 107 |
| 5 | Adam Dunn | White Sox | 418 | 12.90% | 0.217 | 0.323 | 0.457 | 0.337 | 109 |
| 4 | Raul Ibanez | Mariners | 350 | 7.10% | 0.249 | 0.303 | 0.520 | 0.353 | 126 |
| 3 | Jose Bautista | Blue Jays | 457 | 12.90% | 0.252 | 0.348 | 0.496 | 0.365 | 130 |
| 2 | Alexei Ramirez | White Sox | 455 | 3.10% | 0.277 | 0.302 | 0.349 | 0.285 | 73 |
| 1 | Dan Uggla | Braves | 422 | 13.30% | 0.198 | 0.315 | 0.419 | 0.325 | 106 |
What you have is three types of players. One are players who have a high average but never walk and don’t hit for power. Two are players with great walk rates. Three are players with a ton of power. Each of those qualities makes batting average deceptive. We don’t have to get rid of the stat, but it’s important to understand that walking and extra base hits are very important and just dividing hits by at bats doesn’t equal offensive value.
I say this because the person who wins the batting title is only the best offensive player 30% of the time. We call that person the “Batting Champion,” but that’s not really true. Offensive value is more complicated that H/AB and it’s important to start moving towards stats that capture that, especially because we already have those stats and it only requires a few minutes to learn about them.
The Nine Worst One Inning Saves in MLB History
At New English D we’re very critical of the save statistic because not only does it not reflect actual performance, but it has also affected the way managers actually use their bullpens. Managers chase saves which results in using their best relievers in the wrong situations. I won’t rehash the problems, but you can check out the whole rationale in the bullpen section of our Stat Primer page.
What I’d like to do is identify the The Nine Worst One Inning Saves in MLB History. Below you’ll find a list of the most ridiculous appearances in which a reliever was credited with a “save.” The argument here is that a three up three down inning with 3 strikeouts results in a save and is valued identically to these appearances in the save column.
In order to gather this list, I sorted every save since the stat became official in the late ’60s by the number of baserunners allowed after deleting runners who reached via errors. After that I sorted by walks and dropped out anyone who induced a double play in order to leave me with nine. From there, I broke any ties by sorting by the number of times each pitcher missed the strike zone. The only reason I was hunting for nine is because this is part of our The Nine series. A list of 11 or 13 would make the same point. I was just trying to find the absolute worst 1 inning saves in history. Let’s do it. Each of these appearances are 1 inning saves with 5 total baserunners:
| Rank | Player | Date | Tm | H | ER | BB | SO |
| 9 | Billy Koch | 9/27/2002 | OAK | 3 | 2 | 2 | 0 |
| 8 | Todd Jones | 5/19/2007 | DET | 3 | 2 | 2 | 0 |
| 7 | Bobby Jenks | 9/29/2006 | CHW | 3 | 2 | 2 | 3 |
| 6 | Trevor Hoffman | 4/3/2002 | SDP | 3 | 2 | 2 | 1 |
| 5 | Bryan Harvey | 6/25/1989 | CAL | 3 | 2 | 2 | 3 |
| 4 | Brad Lidge | 7/26/2010 | PHI | 3 | 2 | 2 | 0 |
| 3 | Jeff Brantley | 5/21/2000 | PHI | 2 | 2 | 3 | 0 |
| 2 | Joel Hanrahan | 9/15/2012 | PIT | 2 | 2 | 3 | 1 |
| 1 | Sergio Santos | 9/26/2011 | CHW | 2 | 2 | 3 | 3 |
You’ll notice most of these are quite recent. Managers didn’t used to only call on pitchers for one inning saves and they used to pull relievers who pitched terribly before things got this bad. All of these pitchers earned a save for these performances. If you can get a save for pitching like this, how much is a save really worth?
