The Nine Worst Sacrifice Bunts of 2013

So now that we have sufficiently killed the win, bunting seems to be the topic of the day. Last week there were many examples of managers employing the sacrifice bunt at silly times and it seemed to set off a fervor among those wishing to debate new ideas and old tradition. I got into some debates with followers – and you all know Brian Kenny did the same.
The basic argument against the sacrifice bunt is that giving up and out to gain a base is a bad percentage play. The facts are pretty clear on the matter. You have to consider who is batting and the exact situation of the game, but it’s usually always a bad idea to bunt with a reasonably competent position player. Below I’ve presented The Nine Worst Sacrifice Bunt Attempts of 2013. This requires some definition, but first I want to lay out the basic argument for when bunting might be a good idea because some often taking anti-bunting comments as absolute:
When To Bunt
- When a pitcher is batting OR
- When a very low quality hitter is up AND
- There are zero outs AND
- There are men on first and second AND
- The batter has a high probability of striking out based on his skills or the opposing pitcher AND
- One run is sufficient (i.e., you’re down one run late or tied)
The Odds Against Bunting
Here’s my post from earlier this year that outlines Run Expectancy. If you don’t like the way I explain it, just Google it. Lots of smart people have explained it.
The Rules
So the following are The Nine Worst Bunt Attempts of the year as defined like this. First, these are all bunts that have been put in play. I can’t examine the times a batter failed to get a bunt down and then the bunt sign was taken off. Second, this does not include bunts that went for hits. Bunting for a hit is great, this is about bunts in which an out was made – which is the goal of a bunt. Get on base and we don’t have a problem. Third, this is judged by Win Probability Added (WPA), which considers the game situation and the result of the play. So, if you call a bunt in a 10-0 game, who cares. If you call for a bunt in a 5-3 game with your two hitter, that’s probably silly. Finally, no pitchers. Pitchers can’t hit, so it’s fine to use them to bunt. Let’s see what happens!
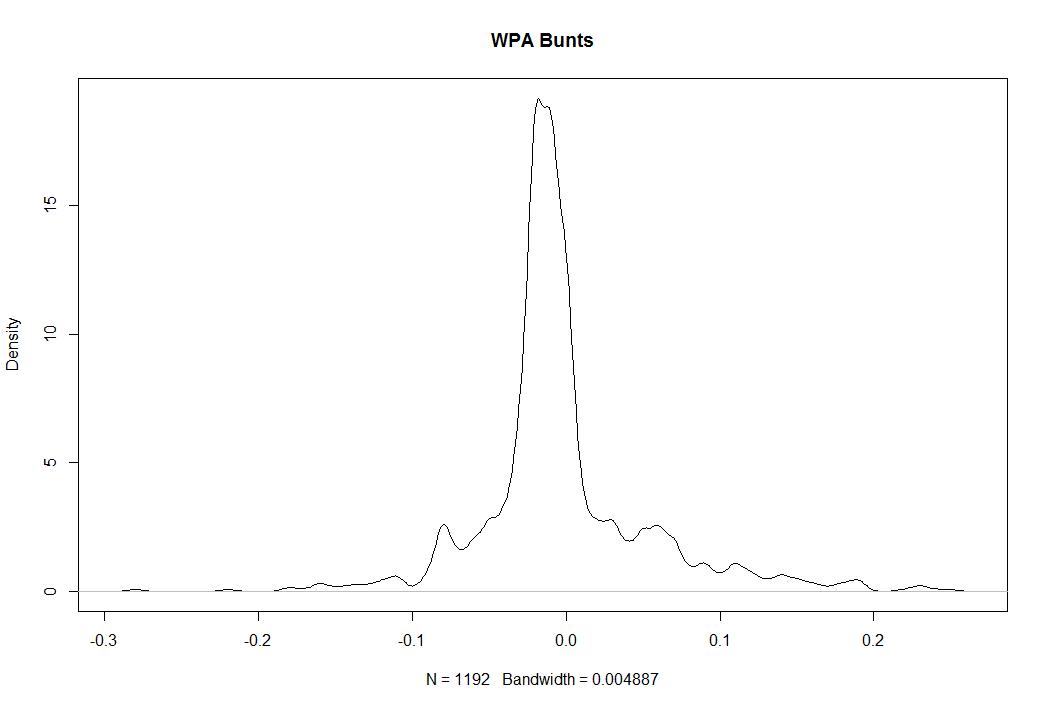
There have been 1,192 sacrifice bunt attempts this season by non-pitchers. 174 have gone for hits and 39 have been turned into errors, so that’s 979 bunt attempts that resulted in at least one out. In sum, they have been worth -2.7 WPA. Here are the worst.
Let’s start with some data that sets the stage.
| Rank | Date | Batter | Tm |
| 9 | 9/16/2013 | Juan Uribe | LAD |
| 8 | 8/14/2013 | Alberto Callaspo | OAK |
| 7 | 8/14/2013 | Martin Prado | ARI |
| 6 | 8/10/2013 | Stephen Vogt | OAK |
| 5 | 9/9/2013 | Jonathan Herrera | COL |
| 4 | 9/18/2013 | Munenori Kawasaki | TOR |
| 3 | 4/25/2013 | Juan Pierre | MIA |
| 2 | 4/11/2013 | Brendan Ryan | SEA |
| 1 | 4/9/2013 | Rob Brantly | MIA |
There we have the date and hitters. Now the opponent and situation:
| Rank | Opp | Pitcher | Score | Inn | RoB | Out |
| 9 | @ARI | Brad Ziegler | down 2-1 | t9 | -12 | 0 |
| 8 | HOU | Josh Fields | down 2-1 | b11 | -2- | 0 |
| 7 | BAL | Jim Johnson | down 4-3 | b9 | -2- | 0 |
| 6 | @TOR | Casey Janssen | down 5-4 | t9 | -12 | 0 |
| 5 | @SFG | Javier Lopez | tied 2-2 | t10 | 1– | 0 |
| 4 | NYY | Mariano Rivera | down 4-3 | b9 | -12 | 0 |
| 3 | CHC | Carlos Marmol | down 4-3 | b9 | -12 | 0 |
| 2 | TEX | Robbie Ross | down 4-3 | b8 | 3 | 1 |
| 1 | ATL | Craig Kimbrel | down 3-2 | b9 | 1– | 0 |
All but one feature no outs and the hitting team has been trailing late or tied in each.
| Rank | Batter | WPA | RE24 | LI | Play Description |
| 9 | Juan Uribe | -0.16 | -0.56 | 5.6 | Bunt Groundout: P-3B/Forceout at 3B (Front of Home); Schumaker to 2B |
| 8 | Alberto Callaspo | -0.16 | -0.42 | 4.38 | Bunt Popfly: P (Front of Home) |
| 7 | Martin Prado | -0.16 | -0.42 | 4.38 | Bunt Groundout: P-1B (Front of Home) |
| 6 | Stephen Vogt | -0.16 | -0.58 | 5.48 | Bunt Groundout: P-3B/Forceout at 3B (Front of Home); Crisp to 2B |
| 5 | Jonathan Herrera | -0.17 | -0.68 | 3.51 | Bunt Ground Ball Double Play: Bunt C-SS-2B (Front of Home) |
| 4 | Munenori Kawasaki | -0.18 | -0.58 | 6.13 | Bunt Groundout: 1B-3B/Forceout at 3B (Front of Home); Rasmus to 2B |
| 3 | Juan Pierre | -0.18 | -0.56 | 6.21 | Bunt Groundout: C-3B/Forceout at 3B (Front of Home); Kearns to 2B |
| 2 | Brendan Ryan | -0.22 | -0.69 | 4.33 | Fielder’s Choice P; Chavez out at Hm/P-C; Ryan to 1B |
| 1 | Rob Brantly | -0.28 | -0.74 | 5.4 | Bunt Pop Fly Double Play: Bunt 3B (Short 3B Line); Solano out at 1B/3B-1B |
Alright, so a few notes. The very worst bunts are almost always the ones that include double plays or a runner getting thrown out at home somehow. Which makes sense, any time a bunt goes horribly wrong, it’s going to be more costly than a normal bunt. Martin Prado’s at #7 is the worst true sac bunt of the lot because the runner didn’t advance and Prado made an out.
So it’s perfectly reasonable to say these are poorly executed bunts. That’s true. But it’s not interesting to show you 9 very similar bunts that are all in the -4% range in the same situations. There are just so many of them. But, let me provide some summary stats to give you a better idea about the whole dataset. Of the 979 bunts that didn’t result in a hit or error, 722 resulted in a decrease in WPA, 160 resulted in no change, and 97 increased the team’s odds of winning. In other words, only 26% of sac bunts in the sample are good for the team.
So 18% of the time a batter attempts to sac bunt, he gets a hit or induces and error. That’s good. And 26% of the remaining 82% helps anyway. All told, about one quarter of position player bunts turn out to be a good idea based on WPA. Let’s go further.
Even including all of the bunts that ended in hits and errors, 276 resulted in more than one run, 339 resulted in one run exactly, and 577 resulted in zero runs. There are good bunts, but bunting is usually a bad idea. There are bunts that mess up the defense and open the door, but they are rare. Usually when you bunt, you don’t score.

You’re welcome to keep bunting, but the odds are not in your favor.
Stat of the Week: Run Expectancy
A point of contention among members of the baseball community is bunting. Most sabermetricians would tell you that the sacrifice bunt is overused because it gives away an out while a lot of on-field Dusty Baker/Harold Reynolds type people love bunting to move runners closer to the plate. I’m not here to argue for or against bunting, but rather to offer you a tool for determining the answer for yourself. This tool is a Run Expectancy Matrix.
The idea behind Run Expectancy is figuring out how many runs, on average, a team scores in a given situation (based on the number of outs and which bases are occupied). The values are based on long run averages and you can calculate them based on many years or a single year, but the ratios are generally going to be the same. Presented below is the matrix from 2012. What you see in the grid is the expected number of runs a team will score given the situation as presented by the top row and left column. You can use the RE Matrix to determine which strategic move is best for you.

So let’s use an example. Runner on 1st base, no outs. At this point, the team is expected to score .8577 runs this inning because, on average, teams have scored that many runs in the inning after those situations have occurred. If we were to sacrifice bunt in this situation, we would move to runner on 2nd, 1 out, which has an expected run value of .6551. That’s obviously less than .8577, so the sacrifice bunt in that situation is not the right play on average. You can play around with other situations on your own.
An important caveat is that this chart is context neutral and reflects averages. If the baserunner is Austin Jackson and the guy bunting is Miguel Cabrera, you’re hurting yourself more than if the runner is Victor Martinez and the bunter is Ramon Santiago. You should be more willing to give up an out to move a runner if the batter is more likely to make an out. However, that doesn’t mean it’s necessarily ever the right play to give up the out. A pitcher who hits .150 is almost definitely going to make an out, so you want him to move the runner up, but Miguel Cabrera is pretty likely going to get a hit relative to average, so you don’t want him intentionally making an out.
I don’t mean to suggest that you should take these numbers as gospel, but rather that you should be aware of which situations lead to the most runs and which situations you want to get yourself into if possible. The takeaway here is that we know how many runs a team is likely to score in a given situation and we can make some sort of educated prediction about what will happen if we do something else. Context matters, but this matters too.
I’m generally not a fan of the sacrifice bunt (or conversely the intentional walk), but there are occasional situations in which it makes sense. This RE Matrix should help you better understand which situations call for which moves.
As always, if you have questions about how this works or how to use it, feel free to comment or contact us. Also, please let us know if there is a statistic or sabermetric concept you’d like to learn about and we’d be happy to cover it.
