The Nine Worst Sacrifice Bunts of 2013

So now that we have sufficiently killed the win, bunting seems to be the topic of the day. Last week there were many examples of managers employing the sacrifice bunt at silly times and it seemed to set off a fervor among those wishing to debate new ideas and old tradition. I got into some debates with followers – and you all know Brian Kenny did the same.
The basic argument against the sacrifice bunt is that giving up and out to gain a base is a bad percentage play. The facts are pretty clear on the matter. You have to consider who is batting and the exact situation of the game, but it’s usually always a bad idea to bunt with a reasonably competent position player. Below I’ve presented The Nine Worst Sacrifice Bunt Attempts of 2013. This requires some definition, but first I want to lay out the basic argument for when bunting might be a good idea because some often taking anti-bunting comments as absolute:
When To Bunt
- When a pitcher is batting OR
- When a very low quality hitter is up AND
- There are zero outs AND
- There are men on first and second AND
- The batter has a high probability of striking out based on his skills or the opposing pitcher AND
- One run is sufficient (i.e., you’re down one run late or tied)
The Odds Against Bunting
Here’s my post from earlier this year that outlines Run Expectancy. If you don’t like the way I explain it, just Google it. Lots of smart people have explained it.
The Rules
So the following are The Nine Worst Bunt Attempts of the year as defined like this. First, these are all bunts that have been put in play. I can’t examine the times a batter failed to get a bunt down and then the bunt sign was taken off. Second, this does not include bunts that went for hits. Bunting for a hit is great, this is about bunts in which an out was made – which is the goal of a bunt. Get on base and we don’t have a problem. Third, this is judged by Win Probability Added (WPA), which considers the game situation and the result of the play. So, if you call a bunt in a 10-0 game, who cares. If you call for a bunt in a 5-3 game with your two hitter, that’s probably silly. Finally, no pitchers. Pitchers can’t hit, so it’s fine to use them to bunt. Let’s see what happens!
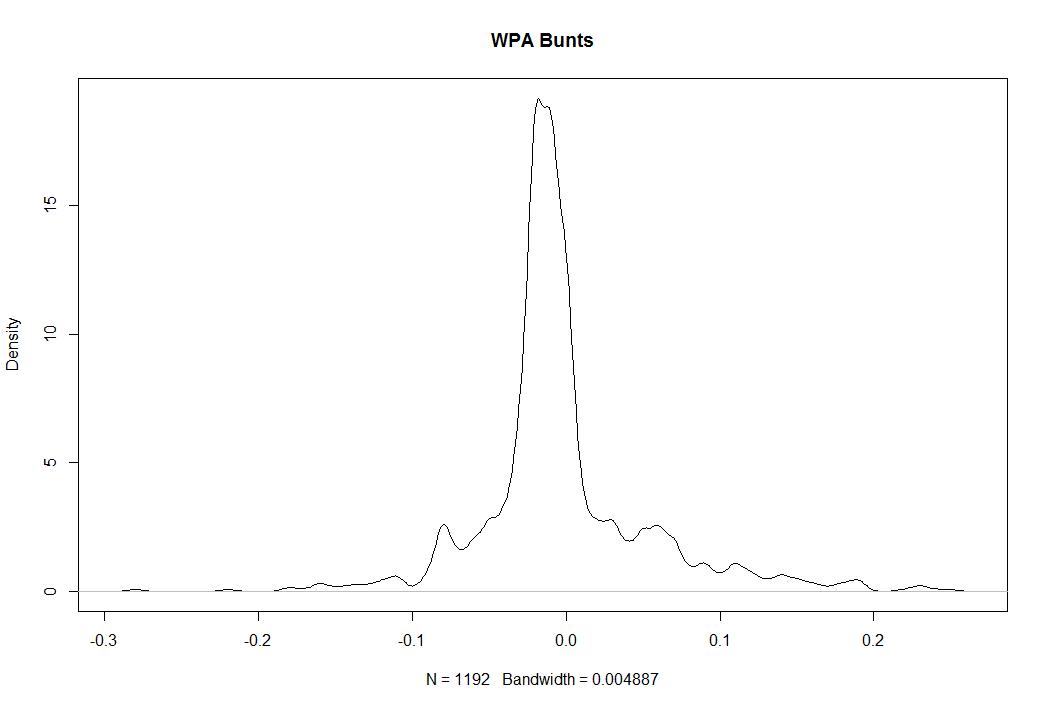
There have been 1,192 sacrifice bunt attempts this season by non-pitchers. 174 have gone for hits and 39 have been turned into errors, so that’s 979 bunt attempts that resulted in at least one out. In sum, they have been worth -2.7 WPA. Here are the worst.
Let’s start with some data that sets the stage.
| Rank | Date | Batter | Tm |
| 9 | 9/16/2013 | Juan Uribe | LAD |
| 8 | 8/14/2013 | Alberto Callaspo | OAK |
| 7 | 8/14/2013 | Martin Prado | ARI |
| 6 | 8/10/2013 | Stephen Vogt | OAK |
| 5 | 9/9/2013 | Jonathan Herrera | COL |
| 4 | 9/18/2013 | Munenori Kawasaki | TOR |
| 3 | 4/25/2013 | Juan Pierre | MIA |
| 2 | 4/11/2013 | Brendan Ryan | SEA |
| 1 | 4/9/2013 | Rob Brantly | MIA |
There we have the date and hitters. Now the opponent and situation:
| Rank | Opp | Pitcher | Score | Inn | RoB | Out |
| 9 | @ARI | Brad Ziegler | down 2-1 | t9 | -12 | 0 |
| 8 | HOU | Josh Fields | down 2-1 | b11 | -2- | 0 |
| 7 | BAL | Jim Johnson | down 4-3 | b9 | -2- | 0 |
| 6 | @TOR | Casey Janssen | down 5-4 | t9 | -12 | 0 |
| 5 | @SFG | Javier Lopez | tied 2-2 | t10 | 1– | 0 |
| 4 | NYY | Mariano Rivera | down 4-3 | b9 | -12 | 0 |
| 3 | CHC | Carlos Marmol | down 4-3 | b9 | -12 | 0 |
| 2 | TEX | Robbie Ross | down 4-3 | b8 | 3 | 1 |
| 1 | ATL | Craig Kimbrel | down 3-2 | b9 | 1– | 0 |
All but one feature no outs and the hitting team has been trailing late or tied in each.
| Rank | Batter | WPA | RE24 | LI | Play Description |
| 9 | Juan Uribe | -0.16 | -0.56 | 5.6 | Bunt Groundout: P-3B/Forceout at 3B (Front of Home); Schumaker to 2B |
| 8 | Alberto Callaspo | -0.16 | -0.42 | 4.38 | Bunt Popfly: P (Front of Home) |
| 7 | Martin Prado | -0.16 | -0.42 | 4.38 | Bunt Groundout: P-1B (Front of Home) |
| 6 | Stephen Vogt | -0.16 | -0.58 | 5.48 | Bunt Groundout: P-3B/Forceout at 3B (Front of Home); Crisp to 2B |
| 5 | Jonathan Herrera | -0.17 | -0.68 | 3.51 | Bunt Ground Ball Double Play: Bunt C-SS-2B (Front of Home) |
| 4 | Munenori Kawasaki | -0.18 | -0.58 | 6.13 | Bunt Groundout: 1B-3B/Forceout at 3B (Front of Home); Rasmus to 2B |
| 3 | Juan Pierre | -0.18 | -0.56 | 6.21 | Bunt Groundout: C-3B/Forceout at 3B (Front of Home); Kearns to 2B |
| 2 | Brendan Ryan | -0.22 | -0.69 | 4.33 | Fielder’s Choice P; Chavez out at Hm/P-C; Ryan to 1B |
| 1 | Rob Brantly | -0.28 | -0.74 | 5.4 | Bunt Pop Fly Double Play: Bunt 3B (Short 3B Line); Solano out at 1B/3B-1B |
Alright, so a few notes. The very worst bunts are almost always the ones that include double plays or a runner getting thrown out at home somehow. Which makes sense, any time a bunt goes horribly wrong, it’s going to be more costly than a normal bunt. Martin Prado’s at #7 is the worst true sac bunt of the lot because the runner didn’t advance and Prado made an out.
So it’s perfectly reasonable to say these are poorly executed bunts. That’s true. But it’s not interesting to show you 9 very similar bunts that are all in the -4% range in the same situations. There are just so many of them. But, let me provide some summary stats to give you a better idea about the whole dataset. Of the 979 bunts that didn’t result in a hit or error, 722 resulted in a decrease in WPA, 160 resulted in no change, and 97 increased the team’s odds of winning. In other words, only 26% of sac bunts in the sample are good for the team.
So 18% of the time a batter attempts to sac bunt, he gets a hit or induces and error. That’s good. And 26% of the remaining 82% helps anyway. All told, about one quarter of position player bunts turn out to be a good idea based on WPA. Let’s go further.
Even including all of the bunts that ended in hits and errors, 276 resulted in more than one run, 339 resulted in one run exactly, and 577 resulted in zero runs. There are good bunts, but bunting is usually a bad idea. There are bunts that mess up the defense and open the door, but they are rare. Usually when you bunt, you don’t score.

You’re welcome to keep bunting, but the odds are not in your favor.
The Nine Worst Wins of 2013
If you’re here, you’ve likely been exposed to our series on pitcher wins and why we want to kill them. It’s become a pretty big topic of conversation around baseball and some people are calling for a cease fire because the win has been repeatedly slaughtered to the point that we’ve probably violated the Geneva Convention. So, I’ll make sure to avoid overdoing it because apparently #KillTheWin is sabr-bullying. If you’re new to the cause, check out the groundwork for why wins are a terrible statistic and then enjoy The Nine Worst Wins from 2013 (as of Sept 13th).
- You Can Have A Great Season and Not Win
- You Can Have A Bad Season and Win A Lot
- Wins Don’t Even Out in Big Samples
- A Case Study in Wins
- 12 Assorted Facts About Wins from 2013
- Dissecting the Case for Wins
- A Replacement for Wins
So the methodology is quite simple. Below are the pitchers in 2013 who have earned a “win” sorted by the lowest Win Probability Added (WPA). What WPA does is measure how much the team’s likelihood of winning changed as a result of every play and assigns that value to the pitcher and batter who took part. It’s not a perfect stat for measuring a player’s performance but it works for our purposes here for a simple reason. If a pitcher’s team scores 10 runs in the first inning, that pitcher can pitch poorly and get a win, but most of the pro-win alliance thinks that’s okay. They believe in something called “pitching to the score” which has been shown to be fiction. So in order to make the point clearly, I’ll use WPA which is entirely dependent on context. If you’re up 10, you’re allowed to give up 5. If you’re up 1, you better not give up two.
There are other ways to do this, but I think this is the most valuable way to do it given the audience still in need of persuasion.
| Rk | Player | Date | Tm | Opp | Rslt | App,Dec |
| 9 | Randall Delgado | 2-Aug | ARI | BOS | W 7-6 | GS-6 ,W |
| 8 | Brandon League | 31-May | LAD | COL | W 7-5 | 9-9 ,BW |
| 7 | CC Sabathia | 18-Aug | NYY | BOS | W 9-6 | GS-6 ,W |
| 6 | Alfredo Simon | 22-Apr | CIN | CHC | W 5-4 | 13-13f,W |
| 5 | Rafael Soriano | 17-May | WSN | SDP | W 6-5 | 9-9 ,BW |
| 4 | Matt Belisle | 28-Jul | COL | MIL | W 6-5 | 8-8 ,BW |
| 3 | Joe Smith | 26-Jun | CLE | BAL | W 4-3 | 8-8 ,BW |
| 2 | Michael Wacha | 19-Aug | STL | MIL | W 8-5 | 7-7 ,BW |
| 1 | Kyuji Fujikawa | 12-Apr | CHC | SFG | W 4-3 | 9-9f ,BW |
| Rk | Player | IP | H | R | ER | BB | SO | HR | Pit |
| 9 | Randall Delgado | 6 | 6 | 6 | 4 | 1 | 7 | 2 | 97 |
| 8 | Brandon League | 1 | 2 | 2 | 2 | 0 | 1 | 1 | 26 |
| 7 | CC Sabathia | 5.1 | 7 | 6 | 6 | 5 | 5 | 1 | 103 |
| 6 | Alfredo Simon | 1 | 1 | 2 | 1 | 0 | 1 | 1 | 15 |
| 5 | Rafael Soriano | 1 | 4 | 2 | 2 | 0 | 0 | 0 | 19 |
| 4 | Matt Belisle | 1 | 2 | 2 | 2 | 0 | 2 | 1 | 23 |
| 3 | Joe Smith | 1 | 3 | 2 | 2 | 1 | 0 | 0 | 21 |
| 2 | Michael Wacha | 1 | 4 | 3 | 3 | 0 | 1 | 1 | 30 |
| 1 | Kyuji Fujikawa | 1 | 3 | 3 | 3 | 0 | 0 | 0 | 30 |
| Rk | Player | ERA | RE24 | WPA |
| 9 | Randall Delgado | 6.00 | -2.939 | -0.392 |
| 8 | Brandon League | 18.00 | -1.479 | -0.404 |
| 7 | CC Sabathia | 10.12 | -3.472 | -0.410 |
| 6 | Alfredo Simon | 9.00 | -1.537 | -0.417 |
| 5 | Rafael Soriano | 18.00 | -1.594 | -0.430 |
| 4 | Matt Belisle | 18.00 | -1.479 | -0.431 |
| 3 | Joe Smith | 18.00 | -1.490 | -0.528 |
| 2 | Michael Wacha | 27.00 | -2.537 | -0.557 |
| 1 | Kyuji Fujikawa | 27.00 | -2.537 | -0.745 |
To date, there have been 282 wins in which the pitcher had a negative WPA in 2013. Above you’ve seen the nine worst including Fujikawa having just about the worst performance I could imagine in a win using this method. In fact, as far back as we have WPA data, it’s the 14th worst such win.
It looked like this! That’s pretty bad.

This is all by way of saying that wins aren’t a useful statistic and that even if we allow for the idea of pitching to the score, we still have a ton of ridiculous wins every season. If every win was handed out perfectly the rest of the season, we would still have seen 11.6% of the wins in 2013 go to pitchers who hurt their team’s chance to win.
#KillTheWinButDoItWithoutBeingSoDramatic
The Nine Pitchers Who Give Up The Most Unearned Runs
Something I’ve always found interesting is that pitchers get to deduct unearned runs from their ERA but they don’t get to deduct runs from their ERA when their defense doesn’t make an easy play that they should have. In the past, I’ve highlighted more advanced ways to demonstrate to measure a pitcher’s value that factors out defense like FIP, xFIP, and others and I’ve also pointed out why this distinction between ERA and Runs Allowed/9 is a little bit arbitrary.
Below, for no other reason than to think about something we almost never think about, are the pitchers who have allowed the most unearned runs in 2013 and the pitchers who have allowed the highest percentage of their runs in an unearned run fashion (min 50 IP).
| Rank | Name | Team | UER | UER% | ERA | IP | R | ER |
| 9 | Stephen Strasburg | Nationals | 10 | 16.13% | 2.85 | 164 | 62 | 52 |
| 8 | Hector Santiago | White Sox | 10 | 16.39% | 3.43 | 133.2 | 61 | 51 |
| 7 | Justin Verlander | Tigers | 10 | 11.90% | 3.59 | 185.2 | 84 | 74 |
| 6 | Ryan Dempster | Red Sox | 10 | 10.64% | 4.79 | 157.2 | 94 | 84 |
| 5 | Lucas Harrell | Astros | 11 | 11.22% | 5.69 | 137.2 | 98 | 87 |
| 4 | C.J. Wilson | Angels | 12 | 14.63% | 3.42 | 184 | 82 | 70 |
| 3 | Jeremy Hefner | Mets | 12 | 16.00% | 4.34 | 130.2 | 75 | 63 |
| 2 | Edwin Jackson | Cubs | 13 | 13.27% | 4.91 | 155.2 | 98 | 85 |
| 1 | Wily Peralta | Brewers | 17 | 17.00% | 4.51 | 165.2 | 100 | 83 |
| Rank | Name | Team | UER | UER% | ERA | IP | R | ER |
| 9 | Rex Brothers | Rockies | 3 | 20.00% | 1.81 | 59.2 | 15 | 12 |
| 8 | Charlie Furbush | Mariners | 5 | 20.00% | 3.16 | 57 | 25 | 20 |
| 7 | Stephen Fife | Dodgers | 4 | 21.05% | 2.55 | 53 | 19 | 15 |
| 6 | Tanner Scheppers | Rangers | 4 | 22.22% | 2.04 | 61.2 | 18 | 14 |
| 5 | Taylor Jordan | Nationals | 6 | 22.22% | 3.66 | 51.2 | 27 | 21 |
| 4 | Burke Badenhop | Brewers | 7 | 22.58% | 3.62 | 59.2 | 31 | 24 |
| 3 | Charlie Morton | Pirates | 9 | 23.08% | 3.00 | 90 | 39 | 30 |
| 2 | Craig Breslow | Red Sox | 4 | 25.00% | 2.12 | 51 | 16 | 12 |
| 1 | Bobby Parnell | Mets | 5 | 29.41% | 2.16 | 50 | 17 | 12 |
I think it’s important to think about this because we all agree that a pitcher isn’t responsible for every run he allows, but he also isn’t without blame for all of them either. Earned and unearned runs are the traditional line we draw, but there is nothing that meaningful about such a boundary. These runs count against the team and plenty of unearned runs aren’t the pitcher’s fault.
Food for thought.
The Nine Best Seasons from Non-Qualifying Hitters (since ’62)
When we talk about postseason statistical titles or when we break down numbers, we often talk about performance among qualifying players. For hitters, this means among players who have had 3.1 PA or more per each team game. Over the course of 162 games, that works out to just over 502 PA in a season. But players who don’t reach that threshold can still be valuable and I’d like to highlight some of the best.
Here are the basic rules. First, this is since 1962 when both leagues went to the 162 games schedule and I’ve dropped out all seasons with labor stoppages. I’ve also rounded down to 500 PA just for simplicity and because sometimes a team plays 161 or 163 games or whatever. Don’t get caught up the technicalities. Below are The Nine best ranked by WAR with the recognition that defensive numbers are pretty imprecise when we go back beyond the last 10 or so seasons.
| Rank | Season | Name | Team | G | PA | Fld | BsR | WAR |
| 9 | 2001 | J.D. Drew | Cardinals | 108 | 443 | 9.0 | 1.3 | 5.6 |
| 8 | 1970 | Bernie Carbo | Reds | 125 | 467 | 2.0 | 0.6 | 5.6 |
| 7 | 2012 | Joey Votto | Reds | 111 | 475 | 6.2 | -3.5 | 5.6 |
| 6 | 1992 | Rickey Henderson | Athletics | 116 | 500 | 3.0 | 5.2 | 5.6 |
| 5 | 1996 | Scott Brosius | Athletics | 114 | 500 | 19 | 0.4 | 5.8 |
| 4 | 1982 | Gary Roenicke | Orioles | 135 | 477 | 21 | -1.6 | 5.9 |
| 3 | 1995 | Mike Piazza | Dodgers | 112 | 475 | -2.0 | 0.1 | 6.0 |
| 2 | 1993 | Rick Wilkins | Cubs | 132 | 500 | 14 | 0.1 | 6.7 |
| 1 | 2003 | Javy Lopez | Braves | 129 | 495 | 1.0 | -1.2 | 6.8 |
And for more detailed information on those seasons:
| Rank | Season | Name | HR | AVG | OBP | SLG | wOBA | wRC+ |
| 9 | 2001 | J.D. Drew | 27 | 0.323 | 0.414 | 0.613 | 0.429 | 162 |
| 8 | 1970 | Bernie Carbo | 21 | 0.310 | 0.454 | 0.551 | 0.441 | 170 |
| 7 | 2012 | Joey Votto | 14 | 0.337 | 0.474 | 0.567 | 0.438 | 177 |
| 6 | 1992 | Rickey Henderson | 15 | 0.283 | 0.426 | 0.457 | 0.401 | 158 |
| 5 | 1996 | Scott Brosius | 22 | 0.304 | 0.393 | 0.516 | 0.392 | 131 |
| 4 | 1982 | Gary Roenicke | 21 | 0.270 | 0.392 | 0.499 | 0.397 | 148 |
| 3 | 1995 | Mike Piazza | 32 | 0.346 | 0.400 | 0.606 | 0.427 | 168 |
| 2 | 1993 | Rick Wilkins | 30 | 0.303 | 0.376 | 0.561 | 0.400 | 144 |
| 1 | 2003 | Javy Lopez | 43 | 0.328 | 0.378 | 0.687 | 0.442 | 170 |
All of these, as you would expect feature players who came very close to qualifying. Should you be curious Justin Morneau’s 2010 season of 4.9 WAR is the highest on the list among players who had fewer than 400 PA.
The Nine Pitchers Who Slowed Their Pace The Most in 2013
That’s a long headline but a simple topic. Which pitchers have increased their average time between pitches the most this year? Below I will present the The Nine pitchers with the largest increases from 2012 to 2013 among those who have thrown 100 innings in both seasons. I will also provide some descriptive stats about the entire sample because for whatever reason, I find “Pace” to be very interesting. Pace is housed over at FanGraphs and here is a link to the current rankings. For 2013, the slowest qualifying starter is Jeremy Hellickson who takes 25.7 seconds between pitches. RA Dickey is the quickest at 17.8, with league average at 22.6.
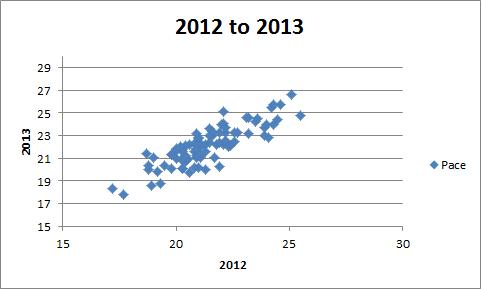
You can see that Pace is pretty consistent and that last year’s pace is a pretty good predictor of this year’s pace with an r squared of .72, meaning that about 72% of the variation in 2013 Pace can be explained by 2012 pace. Below are the players who most buck that trend.
| Rank | Name | Pace Diff | K/9 d | BB/9 d | ERA d | FIP d |
| 9 | Jerome Williams | 1.8 | -0.6 | 0.9 | 0.22 | 0.69 |
| 8 | Dillon Gee | 1.9 | -1.2 | -0.1 | -0.50 | 0.25 |
| 7 | Kyle Kendrick | 2.0 | -1.4 | -0.7 | 0.55 | -0.34 |
| 6 | Madison Bumgarner | 2.0 | 0.3 | 0.7 | -0.53 | -0.26 |
| 5 | Adam Wainwright | 2.1 | -0.1 | -1.2 | -1.36 | -0.77 |
| 4 | Anibal Sanchez | 2.1 | 2.1 | 0.4 | -1.41 | -1.19 |
| 3 | Jarrod Parker | 2.3 | -0.6 | -0.2 | 0.24 | 0.82 |
| 2 | Joe Blanton | 2.7 | -0.5 | 0.5 | 1.41 | 1.21 |
| 1 | David Price | 3.0 | -1.5 | -1.2 | 0.73 | 0.26 |
Positive numbers indicated an increase in 2013 over 2012. For example, Anibal Sanchez’s K/9 is up 2.1 and his FIP is down 1.19. What’s interesting is some pitchers who have slowed down have improved and some have gotten worse. Some have added Ks and BBs, some have cut both, and some have gone in opposite directions. Pretty much, this doesn’t seem very useful in predicting performance.
It’s interesting, though, that on this list we have some elite pitchers and some back end guys. I’m not sure if there is a clear take away from this other than that Pace probably doesn’t correlate that much with anything that has to do with performance on a broad scale and that it matters a lot to each pitcher but it matters in different ways. Let’s just take a quick look at FIP- up against Pace for 2013 qualifiers to illustrate that point:

Oh well, I’m still going to pretend it matters. It matters to fans, at least.
The Nine Most Misleading Batting Averages of 2013
On this site, we often discuss which statistics are misleading and which statistics are better at determining a player’s value. Over in our Stat Primer section we have tons of posts about why pitcher wins are bad and why RBI aren’t a good way to measure individual players. We also have a post about why on base percentage is better than batting average and why you should use Weighted On Base Average (wOBA) if you’re really only interested in looking at a single number because it weighs each type of hit based on its actual contribution to scoring. You want to look at stats that correlate more highly with scoring and OBP and wOBA are much better than batting average (just click the OBP v AVG link above to see for yourself).
All in all, for hitters I’d tell you to look at Weighted Runs Created Plus (wRC+) because that is a park and league adjusted version of wOBA, meaning that you can compare players at Petco and Camden Yards and players from 2010 and 1960. It’s simple to understand as 100 is average and anything above it is that % better than average and anything below it is that much worse. One of our main goals is to make advanced statistics more popular in the broader baseball community because we think they will improve your enjoyment of the game.
Simply put, many of the traditional stats were invented before we knew enough and had the ability to calculate better ones. It’s always important to move forward. Today, I’m offering a bit of evidence from the 2013 season about why you should look beyond batting average when judging a player. Below you will find The Nine Most Misleading Batting Averages so far this season. The rules are simple. These are players who have a below average batting average and above average offensive value or an above average batting average and below average overall value. Players who had really good batting averages that still undersold their value (think Cabrera) are not included because that would just be a list of the best hitters in baseball and that would be boring.
Think of these players as guys who either walk a ton or not at all and/or guys with lots of power or no power. Batting average treats every hit the same and ignores walks. That’s not a good idea. Batting average is a fine stat, but it should only be a compliment to on base percentage if you want something simple and wOBA or wRC+ if you want something more daring. This is a plot of AVG and wRC+ to show you that while batting average is important in determining offensive value, there is a lot it doesn’t explain. About 54% of the variation in wRC+ can be explained by average. Walks, power, and ballpark make up the rest and we shouldn’t ignore them:

It’s important to note that I make no adjustment for position, meaning that these are all deviations from league average (.257 AVG) and not based on their respective positions. These are batting averages that don’t tell the whole story about a player, not batting averages that explain positional value.
| Rank | Name | Team | PA | BB% | AVG | OBP | SLG | wOBA | wRC+ |
| 9 | Jose Altuve | Astros | 436 | 5.50% | 0.284 | 0.323 | 0.362 | 0.298 | 87 |
| 8 | Brandon Moss | Athletics | 346 | 9.50% | 0.241 | 0.321 | 0.456 | 0.338 | 116 |
| 7 | Pedro Alvarez | Pirates | 402 | 8.00% | 0.240 | 0.301 | 0.490 | 0.337 | 117 |
| 6 | Chris Carter | Astros | 390 | 12.30% | 0.214 | 0.315 | 0.432 | 0.327 | 107 |
| 5 | Adam Dunn | White Sox | 418 | 12.90% | 0.217 | 0.323 | 0.457 | 0.337 | 109 |
| 4 | Raul Ibanez | Mariners | 350 | 7.10% | 0.249 | 0.303 | 0.520 | 0.353 | 126 |
| 3 | Jose Bautista | Blue Jays | 457 | 12.90% | 0.252 | 0.348 | 0.496 | 0.365 | 130 |
| 2 | Alexei Ramirez | White Sox | 455 | 3.10% | 0.277 | 0.302 | 0.349 | 0.285 | 73 |
| 1 | Dan Uggla | Braves | 422 | 13.30% | 0.198 | 0.315 | 0.419 | 0.325 | 106 |
What you have is three types of players. One are players who have a high average but never walk and don’t hit for power. Two are players with great walk rates. Three are players with a ton of power. Each of those qualities makes batting average deceptive. We don’t have to get rid of the stat, but it’s important to understand that walking and extra base hits are very important and just dividing hits by at bats doesn’t equal offensive value.
I say this because the person who wins the batting title is only the best offensive player 30% of the time. We call that person the “Batting Champion,” but that’s not really true. Offensive value is more complicated that H/AB and it’s important to start moving towards stats that capture that, especially because we already have those stats and it only requires a few minutes to learn about them.
The Nine Worst One Inning Saves in MLB History
At New English D we’re very critical of the save statistic because not only does it not reflect actual performance, but it has also affected the way managers actually use their bullpens. Managers chase saves which results in using their best relievers in the wrong situations. I won’t rehash the problems, but you can check out the whole rationale in the bullpen section of our Stat Primer page.
What I’d like to do is identify the The Nine Worst One Inning Saves in MLB History. Below you’ll find a list of the most ridiculous appearances in which a reliever was credited with a “save.” The argument here is that a three up three down inning with 3 strikeouts results in a save and is valued identically to these appearances in the save column.
In order to gather this list, I sorted every save since the stat became official in the late ’60s by the number of baserunners allowed after deleting runners who reached via errors. After that I sorted by walks and dropped out anyone who induced a double play in order to leave me with nine. From there, I broke any ties by sorting by the number of times each pitcher missed the strike zone. The only reason I was hunting for nine is because this is part of our The Nine series. A list of 11 or 13 would make the same point. I was just trying to find the absolute worst 1 inning saves in history. Let’s do it. Each of these appearances are 1 inning saves with 5 total baserunners:
| Rank | Player | Date | Tm | H | ER | BB | SO |
| 9 | Billy Koch | 9/27/2002 | OAK | 3 | 2 | 2 | 0 |
| 8 | Todd Jones | 5/19/2007 | DET | 3 | 2 | 2 | 0 |
| 7 | Bobby Jenks | 9/29/2006 | CHW | 3 | 2 | 2 | 3 |
| 6 | Trevor Hoffman | 4/3/2002 | SDP | 3 | 2 | 2 | 1 |
| 5 | Bryan Harvey | 6/25/1989 | CAL | 3 | 2 | 2 | 3 |
| 4 | Brad Lidge | 7/26/2010 | PHI | 3 | 2 | 2 | 0 |
| 3 | Jeff Brantley | 5/21/2000 | PHI | 2 | 2 | 3 | 0 |
| 2 | Joel Hanrahan | 9/15/2012 | PIT | 2 | 2 | 3 | 1 |
| 1 | Sergio Santos | 9/26/2011 | CHW | 2 | 2 | 3 | 3 |
You’ll notice most of these are quite recent. Managers didn’t used to only call on pitchers for one inning saves and they used to pull relievers who pitched terribly before things got this bad. All of these pitchers earned a save for these performances. If you can get a save for pitching like this, how much is a save really worth?
Revisiting The Nine Best Shortstops for 2013
In the weeks leading up to the 2013 season, I unveiled my predictions for The Nine best players at each position. Some of the lists look good, some look terrible at this point, but that’s all part of the fun. Over the next few weeks I will be revisiting these lists to see how things are going so far, around the halfway mark.
Obviously, the early evaluations will feature fewer than half a season and the later lists will feature a bit more, but try to think of these as the state of the position at the halfway mark. I’ll be using Wins Above Replacement (WAR) to generate the rankings because it is the number that best captures the entire value of a player. It isn’t perfect, so don’t take the precise values too seriously, but it’s certainly the best way to make any type of holistic list. WAR values offense, defense, baserunning, and playing time, so it represents exactly what I was trying to capture when I made the rankings during Spring Training.
Here’s how this will work. Below, you’ll see all nine players I ranked in the preseason and any player who currently ranks in the top 9 at that position. The current ranking drives the order and the preseason ranking and their current WAR is noted. Hit, miss, and push distinctions are based on where their first half places them going forward. For example, I can miss on a player even if I expect them to play much better in the second half if their first half was so poor that it is impossible to make up the ground overall.
We’ve already covered the catchers, first basemen, and second basemen so let’s move on to first base. Here’s The Nine Best Shortstops for 2013. Numbers are as of the July 22.
35. Derek Jeter, Yankees (Preseason Rank: 8, 2013 WAR: 0.0)
When I wrote the list, the word on Jeter was that he’s going to be ready early in the season and that obviously didn’t reflect reality. I absorb some of the blame for not being more cautious on Jeter, but I also can’t do much more than trust a basic medical timetable. He’s played 0 games at SS this year and only one game at DH. MISS
22. Alcides Escobar, Royals (Preseason Rank: 9, 2013 WAR: 0.7)
Escobar was trending up offensively over the last few seasons but has been absolutely awful at the plate this season, posting a 59 wRC+ (what’s wRC+?). Escobar has done a nice job adding value on the bases and on defense so this pick wasn’t a massive whiff, but the previous gains at the plate have gone missing. MISS
21. Elvis Andrus, Rangers (Preseason Rank: 2, 2013 WAR: 0.7)
The Andrus story matches the Escobar one. He’s been a very solid offensive player over his first few seasons but has looked terrible to date in 2013 at the dish. He’s still adding tons of value on the field and on the bases, but at the dish he’s at 58 wRC+. Coming off a big contract it makes you sweat if you’re a Rangers fan because Andrus doesn’t need to be great to earn the deal, but he can’t be this bad.
18. Jimmy Rollins, Phillies (Preseason Rank: 6, 2013 WAR: 0.9)
Rollins is only a little off the pace I pegged him for at #6, but he’s not putting up the offensive numbers he needs to this season. Right now he’s playing like an average shortstop instead of an above average one and it’s to blame for his stop on this list. He’s getting older, but I bet he’s got another nice run in there somewhere. MISS
17. Jose Reyes, Jays (Preseason Rank: 3, 2013 WAR: 1.0)
Reyes is having a top 3 season right now when he’s on the field, but of course, he’s missed time with an injury. I gambled on health with my ranking, but he’s be matching it if he didn’t get hurt so I don’t feel too bad about the performance half of my judgement. I’m holding off on judgement because he could easily run off an amazing second half and get close to the top of the list. PUSH
10. JJ Hardy, Orioles (Preseason Rank: 5, 2013 WAR: 1.7)
The Hardy ranking is a little off mostly because of the other guys on the list. He’s having the season I’d have pegged him for, low OBP, nice pop, solid defense. The reason he’s at 10 instead of 5 is because I whiffed on a lot of guys ahead of him. I’m calling this a push for now, but it’s probably going to end up as a miss. PUSH
9. Alexei Ramirez, White Sox (Preseason Rank: N/A, 2013 WAR: 1.9)
Ramirez is getting much of his value from great defense and solid baserunning but he’s doing well enough at the dish (79 wRC+) to add some value at the plate given his position. He has no pop and no eye at the plate, but for now his BABIP is high enough that it is carrying him to a solid batting average. I don’t think this ranking sticks and he was just off my original list. HIT
8. Andrelton Simmons, Braves (Preseason Rank: 4, 2013 WAR: 1.9)
I thought Simmons would hit a bit better than this, but his amazing, all-world defensive is what carries him. He’s got a 14 UZR right now and is slugging pretty well for a SS despite his low OBP. He’s not going to be in the top 4, but he’s very good. MISS
7. Yunel Escobar, Rays (Preseason Rank: N/A, 2013 WAR: 2.3)
Yeah, I never know what to make of this guy. I’m sure I didn’t give him enough credit, partially for his non-baseball issues, but anytime the Rays trade for you, you’re worth watching. Solid bat and good defense for Escobar this year. MISS
6. Jhonny Peralta, Tigers (Preseason Rank: N/A, 2013 WAR: 2.7)
I figured Peralta for a bounce back season, but not to this degree. Peralta is the 5th best SS on our list at the plate and has put together a league average season in the field. Peralta is doing it with a high BABIP, but he’s kept it up for 90+ games, so it’s probably not going to come crashing down and totally erase his value. MISS
5. Everth Cabrera, Padres (Preseason Rank: N/A, 2013 WAR: 2.9)
So he’s a great baserunner and always has been. But he’s added 45 points in OBP and 70 points in SLG over last season. I don’t know what you want from me. If you saw this coming, you’re a better predictor of SS that me. MISS
4. Hanley Ramirez, Dodgers (Preseason Rank: N/A, 2013 WAR: 3.1)
I left Hanley just off the list because I was worried about his ability to stay healthy. Good call, Neil. He’s at 3 WAR in 42 games. Whatever, this is stupid. MISS
3. Jean Segura, Brewers (Preseason Rank: N/A, 2013 WAR: 3.3)
Segura is having a great season. He’s hitting like a madman. I didn’t know enough about his skills as a prospect coming into the season to rank him, but at least for now, I’ve missed. I don’t think this level is sustainable, but he’s certainly good enough to have made the list. MISS
2. Ian Desmond, Nationals (Preseason Rank: 7, 2013 WAR: 3.4)
So I’ll be honest, I have no idea what to make of Ian Desmond. No non-Ben Zobrist SS put up a higher WAR (5.4) in 2012, but it seemingly came out of nowhere. He walked no more than previous years and struck out no less. His BABIP ticked up a bit and UZR liked him better, but he also managed to hit for a lot higher average and more power. That’s generally a good sign, but it’s also a bit strange. He didn’t improve his approach at the plate and his BABIP didn’t shoot up, but he got a lot better. I’m generally favorable toward Desmond, but I just don’t know if we’re going to look back at last year as a fluke or not. I’m not quite ready to buy into him just year, but check back later in the season because he could make me a believer in no time.
That’s what I said about him before the season. I’m just going to let that stand. PUSH
1. Troy Tulowitzki, Rockies (Preseason Rank: 1, 2013 WAR: 3.6)
Tulo is the best SS in baseball despite missing 30 games. Great defender and he’s an elite hitter at any position. This is the best shortstop in baseball when he’s on the field, and apparently, sometimes when he isn’t. After a pretty bad ranking so far, I’m hanging my hat on not screwing this one up. HIT
The Nine Worst 100 RBI Seasons in MLB History
Yesterday we took a look at a case study in RBI to help explain why it’s a misleading statistic. The idea here is that RBI is very dependent on your team and the context you’re in. Two identical hitters will accumulate much different RBI totals depending on how many runners on base ahead of them and which bases those runners occupy. You can read all about it here.
Today, I’d like to start highlighting some broader evidence of the problems with RBI as a stat. You’ve already seen how a better season can result in fewer RBI depending on how the team around you performs, now let’s take a look at The Nine Worst 100 RBI Seasons in MLB History. This list is meant to show you that you can have a very poor season and still accumulate 100 RBI, which is often considered a magic number by people who value RBI. The phrase “100 RBI guy” is something you might here an analyst like John Kruk say when commenting on a player’s value. I’m here to show you that 100 RBI does not necessarily mean the player had a very good season.
Below, we have The Nine worst seasons by wRC+ since 1901 in which the player drove in 100 or more runs. wRC+ is a statistic that measures how a player stacks up to other players in the league and it factors in park effects. It’s easy to interpret the number. A wRC+ of 100 is league average and every point above 100 is a percent better than average a percent below average is a 99 wRC+. For example, an 85 wRC+ is a player who is 15% worse than a league average player. 115 wRC+ is 15% better than league average. You can read all about wRC+ here.
| Rank | Season | Name | Team | PA | RBI | AVG | OBP | SLG | wRC+ |
| 9 | 1927 | Glenn Wright | Pirates | 626 | 105 | 0.281 | 0.328 | 0.388 | 86 |
| 8 | 2006 | Jeff Francoeur | Braves | 686 | 103 | 0.260 | 0.293 | 0.449 | 84 |
| 7 | 1983 | Tony Armas | Red Sox | 613 | 107 | 0.218 | 0.254 | 0.453 | 84 |
| 6 | 1934 | Ray Pepper | Browns | 598 | 101 | 0.298 | 0.333 | 0.399 | 82 |
| 5 | 1990 | Joe Carter | Padres | 697 | 115 | 0.232 | 0.290 | 0.391 | 80 |
| 4 | 1993 | Ruben Sierra | Athletics | 692 | 101 | 0.233 | 0.288 | 0.390 | 79 |
| 3 | 1999 | Vinny Castilla | Rockies | 674 | 102 | 0.275 | 0.331 | 0.478 | 78 |
| 2 | 2004 | Tony Batista | Expos | 650 | 110 | 0.241 | 0.272 | 0.455 | 77 |
| 1 | 1997 | Joe Carter | Blue Jays | 668 | 102 | 0.234 | 0.284 | 0.399 | 72 |
What you have here is a list of players who are “100 RBI guys” who were substantially worse than league average. Perhaps some comparisons might be help. Let’s find a couple of current MLB players who slot in around 70-85 wRC+. Brendan Ryan has a career 72 wRC+. Jason Nix is at 72. Ramon Santiago is 75. Willie Bloomquist is 78. Ruben Tejada is 83. I’m not saying any of the guys on this list are bad players, I’m saying they all had bad seasons in which they still had 100 or more RBI. They guys had Ramon Santiago seasons at the plate and drove in over 100 runs.
Do you really want to place so much stock in a statistic that says a guy who hits like Brendan Ryan is among the league’s best hitters? I don’t. RBI is very much a team dependent statistic and we shouldn’t use it to value individual players. Players can’t control the situations you put them into, they can only control what they do in those situations. As seen here, even players who don’t do very well can still add RBI to their resumes if they are put into situations with many runners on base.
Revisiting The Nine Best Second Basemen for 2013
In the weeks leading up to the 2013 season, I unveiled my predictions for The Nine best players at each position. Some of the lists look good, some look terrible at this point, but that’s all part of the fun. Over the next two weeks leading up to the All-Star Game I will be revisiting these lists to see how things are going so far, around the halfway mark.
Obviously, the early evaluations will feature fewer than half a season and the later lists will feature a bit more, but try to think of these as the state of the position at the halfway mark. I’ll be using Wins Above Replacement (WAR) to generate the rankings because it is the number that best captures the entire value of a player. It isn’t perfect, so don’t take the precise values too seriously, but it’s certainly the best way to make any type of holistic list. WAR values offense, defense, baserunning, and playing time, so it represents exactly what I was trying to capture when I made the rankings during Spring Training.
Here’s how this will work. Below, you’ll see all nine players I ranked in the preseason and any player who currently ranks in the top 9 at that position. The current ranking drives the order and the preseason ranking and their current WAR is noted. Hit, miss, and push distinctions are based on where their first half places them going forward. For example, I can miss on a player even if I expect them to play much better in the second half if their first half was so poor that it is impossible to make up the ground overall.
We’ve already covered the catchers and first basemen, so let’s move on to first base. Here’s The Nine Best Second Basemen for 2013. Numbers are as of the All-Star Break.
81. Dustin Ackley, Mariners (Preseason Rank: 9, 2013 WAR: -0.6)
I would feel worse about Ackley if the rest of this list wasn’t as good as it is. I whiffed on this one. Ackley might have a future yet in MLB, but he’s not going to be a top 2B for 2013 unless something otherworldly happens. MISS
26. Aaron Hill, Dbacks (Preseason Rank: 4, 2013 WAR: 0.5)
Hill’s rate stats are great, he just got hurt and has only played 30 games after fracturing his hand. That’s not an “injury-prone” kind of injury, so it’s not like the kind of thing you should account for when considering a ranking because it could happen to anyone. This one is off, but for good reason. MISS
13. Ian Kinsler, Rangers (Preseason Rank: 5, 2013 WAR: 1.4)
Kinsler is much the same as Hill, as he missed time with an injury. The rate stats are good, but he hasn’t accumulated the value because he’s about 20-25 games short of his competitors. No sweat. PUSH
12. Neil Walker, Pirates (Preseason Rank: 7, 2013 WAR: 1.5)
Walker, too, is having a good season but missed a bit of time with an injury. He’s still pretty close to on track to finish 7th among 2B, so no issues here. HIT
10. Brandon Phillips, Reds (Preseason Rank: 6, 2013 WAR: 2.0)
Phillips is pretty much who I thought he’d be. A low on base, solid power guy who plays good defense. His precise ranking isn’t dead on, but it’s very close and there’s no reason to think he won’t be right around 6-8 when all is said and done. HIT
9. Marco Scutaro, Giants (Preseason Rank: N/A, 2013 WAR: 2.1)
Scutaro is a guy who has gotten better as he’s aged and is doing a nice job getting on base and limiting strikeouts. I had him out of the top 9, but not that far. I’ll call it a push and see how things go. He’d certainly have been 10-13th before the season. PUSH
8. Ben Zobrist, Rays (Preseason Rank: 2 among RF, 2013 WAR: 2.2)
Zobrist started the year in RF and I could only rank him in one place. I ranked him as the 2nd best RF in baseball. Nothing you can do about that. PUSH
7. Omar Infante, Tigers (Preseason Rank: N/A, 2013 WAR: 2.4)
Infante has done a very nice job improving his defensive and baserunning game, which has done a lot to improve his overall value. Infante was a middle of the pack guy for me, so I undershot him a little to this point. MISS
6. Howie Kendrick, Angels (Preseason Rank: N/A, 2013 WAR: 2.4)
Kendrick is another guy who I left just outside the list, and that’s on me. He’s having a strong year with the bat and it’s carrying him onto the list. MISS
5. Chase Utley, Phillies (Preseason Rank: 1, 2013 WAR: 2.6)
I’m a huge Utley fan and ranked him first as a bit of bold prediction that he’d stay healthy. He’s the best 2B in baseball in my book but he’s had trouble staying healthy, and despite missing about 25 games, he’s still 5th on this list. If he plays 65 games the rest of the way at the pace he’s on, we’re talking about a 5+ win player in 130 games. I’ll stand by him. He won’t finish first, but he’s definitely going to stick in the top five. HIT
4. Jason Kipnis, Indians (Preseason Rank: 8, 2013 WAR: 3.4)
Kipnis was one of those young players coming into the season who could easily have taken the leap or faded back. He’s done the former and has established himself as one of the game’s better power hitting second basemen with .514 SLG to go with his .383 OBP and good baserunning. Kipnis may not sustain this pace, but he’s a very good second baseman who I expect to finish in the 4-7 range this season. HIT
3. Dustin Pedroia, Red Sox (Preseason Rank: 3, 2013 WAR: 3.7)
Number 3, nailed it. Pedroia is just a great all-around player. I don’t think much else needs to be said about a guy who gets on base, hits for solid power, plays good defense, and runs the bases well. Pedroia is great. HIT
2. Robinson Cano, Yankees (Preseason Rank: 2, 2013 WAR: 3.8)
Another direct hit. Cano is a very good hitter, trailing only Kipnis and the guy who is 1st on the list in wRC+ and his defense and baserunning are about average. He’s been the only Yankees who can stay healthy and he’s setting himself up for a big payday. HIT
1. Matt Carpenter, Cardinals (Preseason Rank: N/A, 2013 WAR: 4.3)
I really like Carpenter as a player, I just had no idea he was going to turn into this guy. Pretty much everyone will tell you he’s turned himself into a much better player and when I wrote the original list he wasn’t even a lock to get the 2B job. He’s done a great job. He’s the best hitting 2B in baseball right now and is playing great defense. MISS
