SOEFA Sunday: Reliever Rankings Update (September 8, 2013)

You’ll recall earlier this year we introduced our very own reliever rankings called SOEFA, which you can read about in detail here. For a brief refresher, it combines inherited runner strand rate, expected OBP against, ERA-, and FIP- into a deviation from league average. This is a measure of performance, not necessarily ability, and seeks to provide a single number to judge relievers that balances context neutral and context dependent numbers. Certain pitchers, such as Craig Kimbrel, cannot be credited for stranding runners because they are never put into those situations. They are not penalized either, however. Additionally, SOEFA penalizes pitchers like Joe Nathan and Mariano Rivera who have done a very poor job when they have been asked to strand runners this season despite great numbers in other categories.
Zero is average, and will generally range between -2.5 to 2.5 with -1 to 1 being most common. This includes all pitchers who have thrown at least 20 IP in relief as of this morning, so the average score on this list is closer to 0.10 and the inherited runner threshold has been increased from 5 to 8. SOEFA is a rate stat not a counting stat. Should you wish to know the SOEFA for any other reliever, or on a day that isn’t Sunday, hit us on Twitter or in the comments section. Also, as we look to improve SOEFA for next season, let us know if you have any suggestions!
| Rank | Player | Team | SOEFA |
| 1 | Neal Cotts | Rangers | 1.01 |
| 2 | Kenley Jansen | Dodgers | 0.93 |
| 3 | Greg Holland | Royals | 0.92 |
| 4 | Koji Uehara | Red Sox | 0.90 |
| 5 | Kevin Siegrist | Cardinals | 0.87 |
| 6 | Mark Melancon | Pirates | 0.81 |
| 7 | Craig Kimbrel | Braves | 0.79 |
| 8 | Javier Lopez | Giants | 0.78 |
| 9 | Jesse Crain | White Sox | 0.78 |
| 10 | Drew Smyly | Tigers | 0.75 |
| 11 | Will Smith | Royals | 0.71 |
| 12 | Sergio Romo | Giants | 0.70 |
| 13 | Jordan Walden | Braves | 0.70 |
| 14 | Louis Coleman | Royals | 0.70 |
| 15 | Chris Withrow | Dodgers | 0.69 |
| 16 | Jason Grilli | Pirates | 0.67 |
| 17 | Luke Hochevar | Royals | 0.67 |
| 18 | Nick Vincent | Padres | 0.67 |
| 19 | Edward Mujica | Cardinals | 0.66 |
| 20 | Alex Torres | Rays | 0.65 |
| 21 | Sam LeCure | Reds | 0.64 |
| 22 | Joaquin Benoit | Tigers | 0.62 |
| 23 | Sean Doolittle | Athletics | 0.59 |
| 24 | Trevor Rosenthal | Cardinals | 0.58 |
| 25 | Tanner Roark | Nationals | 0.57 |
| 26 | Jim Henderson | Brewers | 0.56 |
| 27 | Brandon Kintzler | Brewers | 0.54 |
| 28 | Brian Matusz | Orioles | 0.54 |
| 29 | Paco Rodriguez | Dodgers | 0.54 |
| 30 | Josh Collmenter | Diamondbacks | 0.52 |
| 31 | Jason Frasor | Rangers | 0.52 |
| 32 | Glen Perkins | Twins | 0.52 |
| 33 | Carlos Torres | Mets | 0.51 |
| 34 | Juan Perez | Blue Jays | 0.50 |
| 35 | Antonio Bastardo | Phillies | 0.50 |
| 36 | Casey Fien | Twins | 0.48 |
| 37 | Aroldis Chapman | Reds | 0.47 |
| 38 | Dan Otero | Athletics | 0.47 |
| 39 | Tommy Hunter | Orioles | 0.47 |
| 40 | Shawn Kelley | Yankees | 0.47 |
| 41 | Andrew Miller | Red Sox | 0.47 |
| 42 | Joel Peralta | Rays | 0.46 |
| 43 | Jake Diekman | Phillies | 0.45 |
| 44 | Manny Parra | Reds | 0.45 |
| 45 | Brett Cecil | Blue Jays | 0.45 |
| 46 | Bobby Parnell | Mets | 0.44 |
| 47 | Will Harris | Diamondbacks | 0.43 |
| 48 | Randy Choate | Cardinals | 0.43 |
| 49 | Seth Maness | Cardinals | 0.43 |
| 50 | Matt Reynolds | Diamondbacks | 0.42 |
| 51 | Vin Mazzaro | Pirates | 0.42 |
| 52 | Junichi Tazawa | Red Sox | 0.41 |
| 53 | Joe Thatcher | – – – | 0.41 |
| 54 | Donovan Hand | Brewers | 0.41 |
| 55 | Francisco Rodriguez | – – – | 0.40 |
| 56 | Chad Qualls | Marlins | 0.40 |
| 57 | Luis Avilan | Braves | 0.40 |
| 58 | Jonathan Papelbon | Phillies | 0.40 |
| 59 | Steve Delabar | Blue Jays | 0.39 |
| 60 | Brad Ziegler | Diamondbacks | 0.38 |
| 61 | Scott Downs | – – – | 0.37 |
| 62 | Josh Outman | Rockies | 0.37 |
| 63 | Addison Reed | White Sox | 0.36 |
| 64 | Darren O’Day | Orioles | 0.36 |
| 65 | David Carpenter | Braves | 0.36 |
| 66 | Steve Cishek | Marlins | 0.35 |
| 67 | Preston Claiborne | Yankees | 0.35 |
| 68 | Tanner Scheppers | Rangers | 0.35 |
| 69 | J.P. Howell | Dodgers | 0.35 |
| 70 | Jean Machi | Giants | 0.34 |
| 71 | Tony Watson | Pirates | 0.33 |
| 72 | Ross Ohlendorf | Nationals | 0.33 |
| 73 | Ernesto Frieri | Angels | 0.33 |
| 74 | Robbie Ross | Rangers | 0.33 |
| 75 | Santiago Casilla | Giants | 0.33 |
| 76 | Ryan Cook | Athletics | 0.32 |
| 77 | Jerome Williams | Angels | 0.31 |
| 78 | Tom Gorzelanny | Brewers | 0.31 |
| 79 | Tyler Clippard | Nationals | 0.31 |
| 80 | Casey Janssen | Blue Jays | 0.31 |
| 81 | David Robertson | Yankees | 0.30 |
| 82 | Craig Breslow | Red Sox | 0.29 |
| 83 | Nate Jones | White Sox | 0.28 |
| 84 | Tim Collins | Royals | 0.27 |
| 85 | Danny Farquhar | Mariners | 0.27 |
| 86 | Grant Balfour | Athletics | 0.27 |
| 87 | Mariano Rivera | Yankees | 0.27 |
| 88 | Cody Allen | Indians | 0.27 |
| 89 | Joe Smith | Indians | 0.26 |
| 90 | Carlos Villanueva | Cubs | 0.26 |
| 91 | Jeanmar Gomez | Pirates | 0.26 |
| 92 | Aaron Loup | Blue Jays | 0.26 |
| 93 | Matt Belisle | Rockies | 0.25 |
| 94 | Anthony Varvaro | Braves | 0.25 |
| 95 | Neil Wagner | Blue Jays | 0.25 |
| 96 | Boone Logan | Yankees | 0.23 |
| 97 | Jared Burton | Twins | 0.22 |
| 98 | Craig Stammen | Nationals | 0.22 |
| 99 | Chad Gaudin | Giants | 0.22 |
| 100 | Jamey Wright | Rays | 0.22 |
| 101 | Luke Gregerson | Padres | 0.21 |
| 102 | Charlie Furbush | Mariners | 0.21 |
| 103 | Luis Ayala | – – – | 0.20 |
| 104 | Brian Duensing | Twins | 0.20 |
| 105 | Jose Veras | – – – | 0.19 |
| 106 | Blake Parker | Cubs | 0.18 |
| 107 | Rafael Betancourt | Rockies | 0.17 |
| 108 | Carter Capps | Mariners | 0.17 |
| 109 | Caleb Thielbar | Twins | 0.17 |
| 110 | Luke Putkonen | Tigers | 0.17 |
| 111 | Wilton Lopez | Rockies | 0.17 |
| 112 | Alfredo Simon | Reds | 0.17 |
| 113 | Dan Jennings | Marlins | 0.16 |
| 114 | Oliver Perez | Mariners | 0.16 |
| 115 | Fernando Rodney | Rays | 0.16 |
| 116 | Rex Brothers | Rockies | 0.16 |
| 117 | Mike Dunn | Marlins | 0.15 |
| 118 | Tim Stauffer | Padres | 0.15 |
| 119 | J.J. Putz | Diamondbacks | 0.15 |
| 120 | Alfredo Figaro | Brewers | 0.14 |
| 121 | Dale Thayer | Padres | 0.13 |
| 122 | Anthony Swarzak | Twins | 0.13 |
| 123 | Yoervis Medina | Mariners | 0.12 |
| 124 | Scott Rice | Mets | 0.11 |
| 125 | Jesse Chavez | Athletics | 0.11 |
| 126 | Matt Lindstrom | White Sox | 0.11 |
| 127 | Kevin Gregg | Cubs | 0.11 |
| 128 | Bryan Shaw | Indians | 0.10 |
| 129 | Rafael Soriano | Nationals | 0.10 |
| 130 | J.J. Hoover | Reds | 0.10 |
| 131 | Sandy Rosario | Giants | 0.09 |
| 132 | Justin Wilson | Pirates | 0.08 |
| 133 | Andrew Bailey | Red Sox | 0.08 |
| 134 | Ross Wolf | Rangers | 0.07 |
| 135 | Kelvin Herrera | Royals | 0.07 |
| 136 | Bruce Rondon | Tigers | 0.07 |
| 137 | J.C. Gutierrez | – – – | 0.07 |
| 138 | Joe Nathan | Rangers | 0.07 |
| 139 | Joe Kelly | Cardinals | 0.06 |
| 140 | Adam Ottavino | Rockies | 0.06 |
| 141 | James Russell | Cubs | 0.06 |
| 142 | Ryan Webb | Marlins | 0.06 |
| 143 | Heath Bell | Diamondbacks | 0.05 |
| 144 | Michael Kohn | Angels | 0.05 |
| 145 | Tyson Ross | Padres | 0.04 |
| 146 | Jim Johnson | Orioles | 0.04 |
| 147 | Matt Thornton | – – – | 0.04 |
| 148 | Manuel Corpas | Rockies | 0.04 |
| 149 | LaTroy Hawkins | Mets | 0.03 |
| 150 | Darren Oliver | Blue Jays | 0.03 |
| 151 | Fernando Abad | Nationals | 0.02 |
| 152 | Matt Guerrier | – – – | 0.01 |
| 153 | Josh Edgin | Mets | 0.00 |
| 154 | Edgmer Escalona | Rockies | -0.01 |
| 155 | Kevin Jepsen | Angels | -0.03 |
| 156 | Joe Ortiz | Rangers | -0.03 |
| 157 | Pat Neshek | Athletics | -0.03 |
| 158 | Ryan Pressly | Twins | -0.03 |
| 159 | Gonzalez Germen | Mets | -0.03 |
| 160 | Dane de la Rosa | Angels | -0.04 |
| 161 | Burke Badenhop | Brewers | -0.04 |
| 162 | Ronald Belisario | Dodgers | -0.04 |
| 163 | Chris Perez | Indians | -0.04 |
| 164 | Rob Scahill | Rockies | -0.05 |
| 165 | Tyler Thornburg | Brewers | -0.05 |
| 166 | Tony Sipp | Diamondbacks | -0.05 |
| 167 | Huston Street | Padres | -0.06 |
| 168 | David Aardsma | Mets | -0.07 |
| 169 | Jerry Blevins | Athletics | -0.09 |
| 170 | Logan Ondrusek | Reds | -0.10 |
| 171 | Darin Downs | Tigers | -0.11 |
| 172 | Jared Hughes | Pirates | -0.12 |
| 173 | Troy Patton | Orioles | -0.13 |
| 174 | Phil Coke | Tigers | -0.14 |
| 175 | Josh Fields | Astros | -0.14 |
| 176 | Josh Roenicke | Twins | -0.14 |
| 177 | Jake McGee | Rays | -0.14 |
| 178 | Aaron Crow | Royals | -0.14 |
| 179 | Fernando Salas | Cardinals | -0.16 |
| 180 | Tom Wilhelmsen | Mariners | -0.16 |
| 181 | Cesar Ramos | Rays | -0.17 |
| 182 | Rich Hill | Indians | -0.17 |
| 183 | Drew Storen | Nationals | -0.18 |
| 184 | Wesley Wright | – – – | -0.18 |
| 185 | Jose Mijares | Giants | -0.18 |
| 186 | Raul Valdes | Phillies | -0.19 |
| 187 | Cory Gearrin | Braves | -0.19 |
| 188 | Matt Albers | Indians | -0.19 |
| 189 | Ramon Troncoso | White Sox | -0.19 |
| 190 | Jake Dunning | Giants | -0.20 |
| 191 | Brad Brach | Padres | -0.20 |
| 192 | Nick Hagadone | Indians | -0.21 |
| 193 | Jonathan Broxton | Reds | -0.23 |
| 194 | Bryan Morris | Pirates | -0.24 |
| 195 | Mike Adams | Phillies | -0.26 |
| 196 | Blake Beavan | Mariners | -0.26 |
| 197 | Kyle Farnsworth | – – – | -0.26 |
| 198 | A.J. Ramos | Marlins | -0.26 |
| 199 | Evan Scribner | Athletics | -0.27 |
| 200 | Lucas Luetge | Mariners | -0.27 |
| 201 | Pedro Strop | – – – | -0.27 |
| 202 | David Hernandez | Diamondbacks | -0.29 |
| 203 | Vinnie Pestano | Indians | -0.30 |
| 204 | Greg Burke | Mets | -0.30 |
| 205 | Brad Lincoln | Blue Jays | -0.30 |
| 206 | Garrett Richards | Angels | -0.30 |
| 207 | George Kontos | Giants | -0.31 |
| 208 | Justin De Fratus | Phillies | -0.31 |
| 209 | Marc Rzepczynski | – – – | -0.32 |
| 210 | Donnie Veal | White Sox | -0.32 |
| 211 | Michael Bowden | Cubs | -0.33 |
| 212 | Zach Duke | – – – | -0.33 |
| 213 | Paul Clemens | Astros | -0.36 |
| 214 | T.J. McFarland | Orioles | -0.36 |
| 215 | Michael Gonzalez | Brewers | -0.37 |
| 216 | Adam Warren | Yankees | -0.38 |
| 217 | Clayton Mortensen | Red Sox | -0.41 |
| 218 | Esmil Rogers | Blue Jays | -0.42 |
| 219 | John Axford | – – – | -0.42 |
| 220 | Al Alburquerque | Tigers | -0.43 |
| 221 | Travis Blackley | Astros | -0.44 |
| 222 | Alex Wilson | Red Sox | -0.45 |
| 223 | Scott Atchison | Mets | -0.46 |
| 224 | Joba Chamberlain | Yankees | -0.48 |
| 225 | Brandon Lyon | Mets | -0.48 |
| 226 | Brandon Maurer | Mariners | -0.51 |
| 227 | Ryan Mattheus | Nationals | -0.53 |
| 228 | Bruce Chen | Royals | -0.54 |
| 229 | Carlos Marmol | – – – | -0.58 |
| 230 | Jose Cisnero | Astros | -0.58 |
| 231 | Jeremy Horst | Phillies | -0.59 |
| 232 | Hector Ambriz | Astros | -0.62 |
| 233 | Ian Krol | Nationals | -0.63 |
| 234 | Dallas Keuchel | Astros | -0.63 |
| 235 | Jeremy Affeldt | Giants | -0.64 |
| 236 | Henry Rodriguez | – – – | -0.70 |
| 237 | Michael Kirkman | Rangers | -0.74 |
| 238 | Hector Rondon | Cubs | -0.74 |
| 239 | Lucas Harrell | Astros | -0.80 |
| 240 | Luis Garcia | Phillies | -0.87 |
| 241 | Brandon League | Dodgers | -0.88 |
| 242 | Anthony Bass | Padres | -0.88 |
| 243 | Shawn Camp | Cubs | -1.03 |
Could We Assign “Wins” Differently?
If you’ve been here before, or someone like Brian Kenny tweeted a link to this post, you know that we are big proponents of the #KillTheWin movement. We don’t like wins and losses as a pitching statistic for many reasons. You can pitch well and not get a win, you can pitch terribly and get a win, wins don’t even out, and wins are extremely misleading. Put simply, wins are dependent on things that pitchers can’t control and it’s silly to measure them based on something their teammates do. Here are links to all of our formative #KillTheWin work:
- You Can Pitch Great and Not Win
- You Can Pitch Poorly and Win
- Wins Don’t Even Out Over Long Careers
- Wins Mislead You When Comparing Players
- Assorted Facts About Wins from 2013
- Dissecting the Case in Support of Wins
But today I’d like to address a solution that a lot of people are calling for. You see, the old guard won’t let go of the wins and losses concept and language. They can’t accept things like FIP, xFIP, and WAR, or even K%, BB%, GB%. Even ERA is doesn’t satisfy their longing for the “W.” So I’d like to propose a simple idea that simply changes the methodology for awarding wins and losses. Currently, a starter has to pitch at least 5 innings, leave with a lead, and not watch the bullpen surrender that lead. If we invented wins and losses today, no doubt we wouldn’t use such a silly rule.
So let’s use a better one. If there is an appetite for Wins and Losses, why don’t we actually tie wins and losses to performance? Here are two basic proposals that do that while solving a couple of key issues with wins.
The first problem with wins and losses is that it depends on how much and when your team scores. So what we want is something that only measures the impact of the pitcher on the game. Another problem with wins and losses is that the no-decision essentially erases everything you did on a given day. If a pitcher throws 7 shutout innings and gets a no decision, that game shows up in every single one of his stats except wins and losses. We want to judge every start a pitcher makes, not just one in which the right conditions are met by his offense and bullpen.
To partially resolve this issue, let’s turn to the 2013 Tigers as an example. Instead of wins and losses as determined by the current rule, what if we allocate them by Win Probability Added (WPA) or Run Expectancy 24 (RE24)? Those two stats are a bit complicated to calculate, but extremely easy to understand. WPA reflects the percentage by which a player improved his team’s chances of winning. It is very context dependent, but you can still earn positive values even when your team is losing. RE24 is a similar statistic except it doesn’t pay attention to the score of the game and just reflects how many runs above or below average you are contributing. Think of it this way, in a 10-0 game a solo homerun has a pretty low WPA because the game is already decided, but it has the same RE24 in a 10-0 as it does in a 2-0 game. Both allow for the addition of value in a context dependent sense, but both also allow a player to add value even when his team is not. Both of these stats are readily available on FanGraphs and Baseball-Reference.
Below I present the 2013 Tigers with WPA and RE24 “wins.” If a pitcher has a positive WPA or RE24 for a single game they get a win. If it’s negative, they get a loss. No no-decisions and no concern about how the game actually ended. Did the pitcher improve his team’s chances of winning a single game? That’s what wins and losses should tell us, so let’s try this.
There are obvious weakness to this approach, namely that I’m not addressing by how much a pitcher helped his team, but to answer that question, we have season long numbers that are more important. This approach is meant to give people who want to see wins and losses a better reflection of true value.
| Pitcher | Starts | W-L | WPA W-L | RE24 W-L |
| Fister | 28 | 12-7 | 18-10 | 19-9 |
| Sanchez | 24 | 12-7 | 16-8 | 17-7 |
| Scherzer | 27 | 19-1 | 22-5 | 22-5 |
| Verlander | 29 | 12-10 | 17-12 | 18-11 |
| Porcello | 26 | 11-7 | 15-11 | 16-10 |
You will notice a couple of things. You’ll notice that Scherzer’s no-decisions are primarily the function of his team bailing him out and Fister, Sanchez, and Verlander’s are almost all a case of the Tigers not providing enough run support. Porcello’s are divided pretty evenly. This is interesting because it shows that even on individual teams, wins/losses/no decisions are handed out irregularly despite the same contingent of position players.
For the die-hard #KillTheWin-er, this approach is still too context dependent and derived from an illogical attempt to hand wins and losses to a single player. But for a more traditional observer, hopefully this is compelling. Even if you like wins and losses, surely you can appreciate that the actual way in which wins and losses are assigned is arbitrary and foolish. Why is 5 innings the cutoff? Why do you not get a win if you pitch 8 shutout innings and your team wins in a walkoff? Why should you get a win if you allow 6 runs? Even if you want to track day to day contribution, at least track it in a way that reflects what the player you’re judging actually did.
Now I’m not sure if this is the best way, but this is definitely an improvement over wins and losses as currently defined. The current stat makes no contribution to analysis, this one makes some contribution. I’d still rather pay attention to season long numbers, but if we’re going to judge a player in each individual game, let’s at least do it right.
SOEFA Sunday: Reliever Rankings Update (August 4, 2013)
You’ll recall earlier this year we introduced our very own reliever rankings called SOEFA, which you can read about in detail here. For a brief refresher, it combines inherited runner strand rate, expected OBP against, ERA-, and FIP- into a deviation from league average. This is a measure of performance, not necessarily ability, and seeks to provide a single number to judge relievers that balances context neutral and context dependent numbers. Certain pitchers, such as Craig Kimbrel, cannot be credited for stranding runners because they are never put into those situations. They are not penalized either, however. Zero is average, and will generally range between -2.5 to 2.5 with -1 to 1 being most common. This includes all pitchers who have thrown at least 20 IP in relief, so the average score on this list is 0.13. Should you wish to know the SOEFA for any other reliever, or on a day that isn’t Sunday, hit us on Twitter or in the comments section.
| Rank | Player | Team | SOEFA |
| 1 | Alex Torres | Rays | 1.06 |
| 2 | Drew Smyly | Tigers | 1.00 |
| 3 | Neal Cotts | Rangers | 0.99 |
| 4 | Greg Holland | Royals | 0.87 |
| 5 | Kenley Jansen | Dodgers | 0.86 |
| 6 | Sergio Romo | Giants | 0.84 |
| 7 | Joaquin Benoit | Tigers | 0.82 |
| 8 | Javier Lopez | Giants | 0.80 |
| 9 | Juan Perez | Blue Jays | 0.79 |
| 10 | Mark Melancon | Pirates | 0.79 |
| 11 | Jesse Crain | White Sox | 0.78 |
| 12 | Casey Fien | Twins | 0.77 |
| 13 | Carlos Torres | Mets | 0.76 |
| 14 | Joe Thatcher | – – – | 0.73 |
| 15 | Koji Uehara | Red Sox | 0.73 |
| 16 | Jordan Walden | Braves | 0.72 |
| 17 | Preston Claiborne | Yankees | 0.72 |
| 18 | Jason Grilli | Pirates | 0.71 |
| 19 | Nick Vincent | Padres | 0.71 |
| 20 | Will Harris | Diamondbacks | 0.71 |
| 21 | Casey Janssen | Blue Jays | 0.70 |
| 22 | Craig Kimbrel | Braves | 0.70 |
| 23 | Fernando Abad | Nationals | 0.69 |
| 24 | Sean Doolittle | Athletics | 0.69 |
| 25 | Jose Veras | – – – | 0.68 |
| 26 | Edward Mujica | Cardinals | 0.67 |
| 27 | Sam LeCure | Reds | 0.67 |
| 28 | Shawn Kelley | Yankees | 0.66 |
| 29 | David Robertson | Yankees | 0.64 |
| 30 | Glen Perkins | Twins | 0.63 |
| 31 | Brandon Kintzler | Brewers | 0.59 |
| 32 | Manny Parra | Reds | 0.59 |
| 33 | Trevor Rosenthal | Cardinals | 0.53 |
| 34 | Andrew Bailey | Red Sox | 0.52 |
| 35 | Brian Matusz | Orioles | 0.52 |
| 36 | Joel Peralta | Rays | 0.51 |
| 37 | Ryan Cook | Athletics | 0.50 |
| 38 | Antonio Bastardo | Phillies | 0.49 |
| 39 | Luke Hochevar | Royals | 0.49 |
| 40 | Matt Belisle | Rockies | 0.49 |
| 41 | Andrew Miller | Red Sox | 0.47 |
| 42 | Jason Frasor | Rangers | 0.46 |
| 43 | Josh Collmenter | Diamondbacks | 0.46 |
| 44 | Juan Gutierrez | – – – | 0.46 |
| 45 | Boone Logan | Yankees | 0.45 |
| 46 | Tommy Hunter | Orioles | 0.45 |
| 47 | Bobby Parnell | Mets | 0.44 |
| 48 | Paco Rodriguez | Dodgers | 0.44 |
| 49 | Brett Cecil | Blue Jays | 0.43 |
| 50 | Chad Qualls | Marlins | 0.43 |
| 51 | Darren O’Day | Orioles | 0.43 |
| 52 | Junichi Tazawa | Red Sox | 0.43 |
| 53 | Jim Henderson | Brewers | 0.42 |
| 54 | Matt Reynolds | Diamondbacks | 0.42 |
| 55 | Robbie Ross | Rangers | 0.42 |
| 56 | Seth Maness | Cardinals | 0.42 |
| 57 | Brad Ziegler | Diamondbacks | 0.41 |
| 58 | Chad Gaudin | Giants | 0.41 |
| 59 | Dale Thayer | Padres | 0.41 |
| 60 | Vin Mazzaro | Pirates | 0.40 |
| 61 | Luis Avilan | Braves | 0.39 |
| 62 | Randy Choate | Cardinals | 0.39 |
| 63 | J.P. Howell | Dodgers | 0.38 |
| 64 | Neil Wagner | Blue Jays | 0.38 |
| 65 | Tyler Clippard | Nationals | 0.38 |
| 66 | Aroldis Chapman | Reds | 0.37 |
| 67 | Sandy Rosario | Giants | 0.37 |
| 68 | Scott Downs | – – – | 0.37 |
| 69 | Jonathan Papelbon | Phillies | 0.36 |
| 70 | Pat Neshek | Athletics | 0.36 |
| 71 | David Carpenter | Braves | 0.35 |
| 72 | Aaron Loup | Blue Jays | 0.34 |
| 73 | Addison Reed | White Sox | 0.34 |
| 74 | Tom Gorzelanny | Brewers | 0.34 |
| 75 | Nate Jones | White Sox | 0.33 |
| 76 | Santiago Casilla | Giants | 0.33 |
| 77 | Tanner Scheppers | Rangers | 0.33 |
| 78 | Alfredo Figaro | Brewers | 0.31 |
| 79 | Oliver Perez | Mariners | 0.30 |
| 80 | Cody Allen | Indians | 0.29 |
| 81 | Josh Outman | Rockies | 0.29 |
| 82 | Jared Burton | Twins | 0.28 |
| 83 | Steve Delabar | Blue Jays | 0.28 |
| 84 | Tony Watson | Pirates | 0.28 |
| 85 | Alfredo Simon | Reds | 0.27 |
| 86 | Kevin Gregg | Cubs | 0.27 |
| 87 | Dan Jennings | Marlins | 0.25 |
| 88 | Fernando Rodney | Rays | 0.25 |
| 89 | Heath Bell | Diamondbacks | 0.25 |
| 90 | Luke Gregerson | Padres | 0.25 |
| 91 | Rafael Betancourt | Rockies | 0.25 |
| 92 | Jerome Williams | Angels | 0.24 |
| 93 | Steve Cishek | Marlins | 0.24 |
| 94 | Michael Kohn | Angels | 0.23 |
| 95 | Caleb Thielbar | Twins | 0.22 |
| 96 | Jim Johnson | Orioles | 0.22 |
| 97 | Rafael Soriano | Nationals | 0.22 |
| 98 | Francisco Rodriguez | – – – | 0.21 |
| 99 | Jamey Wright | Rays | 0.21 |
| 100 | J.J. Hoover | Reds | 0.20 |
| 101 | Tim Collins | Royals | 0.20 |
| 102 | Craig Breslow | Red Sox | 0.19 |
| 103 | Ernesto Frieri | Angels | 0.19 |
| 104 | Jose Mijares | Giants | 0.19 |
| 105 | Mariano Rivera | Yankees | 0.18 |
| 106 | Anthony Swarzak | Twins | 0.16 |
| 107 | Aaron Crow | Royals | 0.15 |
| 108 | Matt Thornton | – – – | 0.15 |
| 109 | Rex Brothers | Rockies | 0.15 |
| 110 | Justin Wilson | Pirates | 0.14 |
| 111 | Jean Machi | Giants | 0.13 |
| 112 | Anthony Varvaro | Braves | 0.12 |
| 113 | David Aardsma | Mets | 0.12 |
| 114 | James Russell | Cubs | 0.11 |
| 115 | Logan Ondrusek | Reds | 0.11 |
| 116 | Manuel Corpas | Rockies | 0.11 |
| 117 | Matt Guerrier | – – – | 0.09 |
| 118 | Bryan Morris | Pirates | 0.08 |
| 119 | Chris Perez | Indians | 0.08 |
| 120 | Dane de la Rosa | Angels | 0.07 |
| 121 | Danny Farquhar | Mariners | 0.07 |
| 122 | Ryan Pressly | Twins | 0.07 |
| 123 | Joe Kelly | Cardinals | 0.06 |
| 124 | Joe Nathan | Rangers | 0.06 |
| 125 | Kevin Jepsen | Angels | 0.06 |
| 126 | Mike Dunn | Marlins | 0.06 |
| 127 | Ross Wolf | Rangers | 0.06 |
| 128 | LaTroy Hawkins | Mets | 0.05 |
| 129 | Tyson Ross | Padres | 0.04 |
| 130 | Burke Badenhop | Brewers | 0.03 |
| 131 | Wilton Lopez | Rockies | 0.03 |
| 132 | Adam Ottavino | Rockies | 0.02 |
| 133 | Bryan Shaw | Indians | 0.02 |
| 134 | Charlie Furbush | Mariners | 0.02 |
| 135 | Jeanmar Gomez | Pirates | 0.02 |
| 136 | Craig Stammen | Nationals | 0.01 |
| 137 | Joe Smith | Indians | 0.01 |
| 138 | A.J. Ramos | Marlins | 0.00 |
| 139 | Cesar Ramos | Rays | 0.00 |
| 140 | Josh Edgin | Mets | 0.00 |
| 141 | Yoervis Medina | Mariners | 0.00 |
| 142 | Ryan Webb | Marlins | -0.02 |
| 143 | Scott Rice | Mets | -0.02 |
| 144 | Jesse Chavez | Athletics | -0.03 |
| 145 | Joe Ortiz | Rangers | -0.04 |
| 146 | Brad Lincoln | Blue Jays | -0.05 |
| 147 | Darren Oliver | Blue Jays | -0.05 |
| 148 | J.J. Putz | Diamondbacks | -0.05 |
| 149 | Edgmer Escalona | Rockies | -0.06 |
| 150 | Matt Lindstrom | White Sox | -0.06 |
| 151 | Carter Capps | Mariners | -0.07 |
| 152 | Greg Burke | Mets | -0.09 |
| 153 | Troy Patton | Orioles | -0.09 |
| 154 | Brad Brach | Padres | -0.1 |
| 155 | Tony Sipp | Diamondbacks | -0.1 |
| 156 | Darin Downs | Tigers | -0.11 |
| 157 | Jake McGee | Rays | -0.11 |
| 158 | Tim Stauffer | Padres | -0.11 |
| 159 | Blake Parker | Cubs | -0.12 |
| 160 | Rich Hill | Indians | -0.12 |
| 161 | Ross Ohlendorf | Nationals | -0.14 |
| 162 | Wesley Wright | Astros | -0.15 |
| 163 | Luke Putkonen | Tigers | -0.17 |
| 164 | Brian Duensing | Twins | -0.18 |
| 165 | Josh Roenicke | Twins | -0.18 |
| 166 | Michael Bowden | Cubs | -0.18 |
| 167 | Cory Gearrin | Braves | -0.19 |
| 168 | Phil Coke | Tigers | -0.19 |
| 169 | Jerry Blevins | Athletics | -0.21 |
| 170 | Joba Chamberlain | Yankees | -0.21 |
| 171 | Nick Hagadone | Indians | -0.21 |
| 172 | Ronald Belisario | Dodgers | -0.23 |
| 173 | John Axford | Brewers | -0.24 |
| 174 | Scott Atchison | Mets | -0.25 |
| 175 | Jonathan Broxton | Reds | -0.26 |
| 176 | Michael Gonzalez | Brewers | -0.27 |
| 177 | Vinnie Pestano | Indians | -0.27 |
| 178 | Blake Beavan | Mariners | -0.28 |
| 179 | Kelvin Herrera | Royals | -0.28 |
| 180 | Jose Cisnero | Astros | -0.29 |
| 181 | David Hernandez | Diamondbacks | -0.30 |
| 182 | Grant Balfour | Athletics | -0.30 |
| 183 | Tom Wilhelmsen | Mariners | -0.30 |
| 184 | Garrett Richards | Angels | -0.31 |
| 185 | Fernando Salas | Cardinals | -0.33 |
| 186 | Huston Street | Padres | -0.33 |
| 187 | T.J. McFarland | Orioles | -0.35 |
| 188 | Drew Storen | Nationals | -0.36 |
| 189 | George Kontos | Giants | -0.36 |
| 190 | Kyle Farnsworth | Rays | -0.36 |
| 191 | Paul Clemens | Astros | -0.37 |
| 192 | Justin De Fratus | Phillies | -0.38 |
| 193 | Mike Adams | Phillies | -0.40 |
| 194 | Clayton Mortensen | Red Sox | -0.41 |
| 195 | Dallas Keuchel | Astros | -0.41 |
| 196 | Raul Valdes | Phillies | -0.41 |
| 197 | Travis Blackley | Astros | -0.43 |
| 198 | Alex Wilson | Red Sox | -0.44 |
| 199 | Pedro Strop | – – – | -0.44 |
| 200 | Al Alburquerque | Tigers | -0.45 |
| 201 | Matt Albers | Indians | -0.46 |
| 202 | Brandon Lyon | Mets | -0.48 |
| 203 | Esmil Rogers | Blue Jays | -0.50 |
| 204 | Bruce Chen | Royals | -0.54 |
| 205 | Jeremy Horst | Phillies | -0.59 |
| 206 | Hector Ambriz | Astros | -0.63 |
| 207 | Jeremy Affeldt | Giants | -0.64 |
| 208 | Henry Rodriguez | – – – | -0.70 |
| 209 | Adam Warren | Yankees | -0.72 |
| 210 | Michael Kirkman | Rangers | -0.73 |
| 211 | Brandon League | Dodgers | -0.76 |
| 212 | Carlos Marmol | – – – | -0.86 |
| 213 | Anthony Bass | Padres | -0.91 |
| 214 | Hector Rondon | Cubs | -1.02 |
| 215 | Shawn Camp | Cubs | -1.03 |
The Nine Most Misleading Batting Averages of 2013
On this site, we often discuss which statistics are misleading and which statistics are better at determining a player’s value. Over in our Stat Primer section we have tons of posts about why pitcher wins are bad and why RBI aren’t a good way to measure individual players. We also have a post about why on base percentage is better than batting average and why you should use Weighted On Base Average (wOBA) if you’re really only interested in looking at a single number because it weighs each type of hit based on its actual contribution to scoring. You want to look at stats that correlate more highly with scoring and OBP and wOBA are much better than batting average (just click the OBP v AVG link above to see for yourself).
All in all, for hitters I’d tell you to look at Weighted Runs Created Plus (wRC+) because that is a park and league adjusted version of wOBA, meaning that you can compare players at Petco and Camden Yards and players from 2010 and 1960. It’s simple to understand as 100 is average and anything above it is that % better than average and anything below it is that much worse. One of our main goals is to make advanced statistics more popular in the broader baseball community because we think they will improve your enjoyment of the game.
Simply put, many of the traditional stats were invented before we knew enough and had the ability to calculate better ones. It’s always important to move forward. Today, I’m offering a bit of evidence from the 2013 season about why you should look beyond batting average when judging a player. Below you will find The Nine Most Misleading Batting Averages so far this season. The rules are simple. These are players who have a below average batting average and above average offensive value or an above average batting average and below average overall value. Players who had really good batting averages that still undersold their value (think Cabrera) are not included because that would just be a list of the best hitters in baseball and that would be boring.
Think of these players as guys who either walk a ton or not at all and/or guys with lots of power or no power. Batting average treats every hit the same and ignores walks. That’s not a good idea. Batting average is a fine stat, but it should only be a compliment to on base percentage if you want something simple and wOBA or wRC+ if you want something more daring. This is a plot of AVG and wRC+ to show you that while batting average is important in determining offensive value, there is a lot it doesn’t explain. About 54% of the variation in wRC+ can be explained by average. Walks, power, and ballpark make up the rest and we shouldn’t ignore them:

It’s important to note that I make no adjustment for position, meaning that these are all deviations from league average (.257 AVG) and not based on their respective positions. These are batting averages that don’t tell the whole story about a player, not batting averages that explain positional value.
| Rank | Name | Team | PA | BB% | AVG | OBP | SLG | wOBA | wRC+ |
| 9 | Jose Altuve | Astros | 436 | 5.50% | 0.284 | 0.323 | 0.362 | 0.298 | 87 |
| 8 | Brandon Moss | Athletics | 346 | 9.50% | 0.241 | 0.321 | 0.456 | 0.338 | 116 |
| 7 | Pedro Alvarez | Pirates | 402 | 8.00% | 0.240 | 0.301 | 0.490 | 0.337 | 117 |
| 6 | Chris Carter | Astros | 390 | 12.30% | 0.214 | 0.315 | 0.432 | 0.327 | 107 |
| 5 | Adam Dunn | White Sox | 418 | 12.90% | 0.217 | 0.323 | 0.457 | 0.337 | 109 |
| 4 | Raul Ibanez | Mariners | 350 | 7.10% | 0.249 | 0.303 | 0.520 | 0.353 | 126 |
| 3 | Jose Bautista | Blue Jays | 457 | 12.90% | 0.252 | 0.348 | 0.496 | 0.365 | 130 |
| 2 | Alexei Ramirez | White Sox | 455 | 3.10% | 0.277 | 0.302 | 0.349 | 0.285 | 73 |
| 1 | Dan Uggla | Braves | 422 | 13.30% | 0.198 | 0.315 | 0.419 | 0.325 | 106 |
What you have is three types of players. One are players who have a high average but never walk and don’t hit for power. Two are players with great walk rates. Three are players with a ton of power. Each of those qualities makes batting average deceptive. We don’t have to get rid of the stat, but it’s important to understand that walking and extra base hits are very important and just dividing hits by at bats doesn’t equal offensive value.
I say this because the person who wins the batting title is only the best offensive player 30% of the time. We call that person the “Batting Champion,” but that’s not really true. Offensive value is more complicated that H/AB and it’s important to start moving towards stats that capture that, especially because we already have those stats and it only requires a few minutes to learn about them.
Hidden Value: Assessing the Tigers on The Bases
Baserunning is pretty much the red-headed stepchild of baseball analysis. We care a lot about hitting. We care a lot about pitching. Most people given a courtesy nod to defense, even if they basically ignore it. But no one talks about baserunning aside from stolen base totals, or maybe stolen base efficiency.
But there is so much more going on on the bases that we could be talking about. Going first to third, scoring on singles, not making outs you don’t have to make. All of these are critical aspects of baserunning that we don’t talk about, but very easily could. In the text of this post I’ll be introducing some statistics (which are very simple) and discussing them in the context of the 2013 Tigers to date (July 30th).
Let’s start by digging deeper on stolen bases. Stolen bases add value to the team, about 1/4 of the value added by a single. But getting caught is costly, and is about twice as costly as stealing a base is beneficial because the value of moving up a base is not as important as not making an extra out. In other words, you need to steal at about a 70% rate or better in order to be adding value to your team overall.
| Name | wSB |
| Andy Dirks | 0.7 |
| Don Kelly | 0.3 |
| Hernan Perez | 0.2 |
| Miguel Cabrera | 0.1 |
| Matt Tuiasosopo | -0.1 |
| Ramon Santiago | -0.1 |
| Omar Infante | -0.2 |
| Alex Avila | -0.2 |
| Austin Jackson | -0.3 |
| Torii Hunter | -0.4 |
| Avisail Garcia | -0.4 |
| Prince Fielder | -0.6 |
| Victor Martinez | -0.8 |
| Jhonny Peralta | -0.9 |
| Brayan Pena | -0.9 |
Presented above are the number of runs each Tiger has added via SB and CS. As you can see, nobody is doing much of anything. The Tigers best basestealer isn’t even up to a full run (10 runs = 1 win) of value and the worst basestealer costs about the same. The Tigers don’t steal a lot of bases, but they don’t get caught a ton either. All told they are a -3.7 wSB, which means their basestealing exploits has cost the team about one-third of a win. Not very significant.
Now let’s take a look at UBR, which is simply the same formula for all other baserunning activities. This includes the value of going first to third and the cost of getting thrown out trying to stretch something. I’m going to talk about some pieces of this in a moment, but first let me give you the overall numbers.
| Name | UBR |
| Austin Jackson | 5.0 |
| Don Kelly | 2.1 |
| Omar Infante | 1.6 |
| Avisail Garcia | 0.7 |
| Miguel Cabrera | 0.6 |
| Alex Avila | 0.6 |
| Ramon Santiago | 0.3 |
| Hernan Perez | 0.1 |
| Andy Dirks | -0.2 |
| Bryan Holaday | -0.6 |
| Jhonny Peralta | -0.7 |
| Brayan Pena | -0.7 |
| Torii Hunter | -1.2 |
| Prince Fielder | -2.1 |
| Matt Tuiasosopo | -2.8 |
| Victor Martinez | -4.6 |
Here we have a chance to see more overall value impact. It will not surprise you to learn that Austin Jackson is the Tigers best runner and that he has been worth half a win to the team simply on the bases (this does not include stealing). Kelly ranks well in this department and despite being slow, Cabrera’s solid instincts help him add value here as well. Dirks is a bit surprising because he’s the team’s best basestealer, but it looks like he doesn’t help much with the ball in play. Overall, the team has a -1.9 UBR, which is just a tick below average. Adding wSB and UBR together, the Tigers have cost themselves something like half a win this season with their baserunning (25th in MLB). You’re not happy about that, but given their collection of lumbering sluggers, it’s nice to see they aren’t giving runs back on the bases they are earning with the bat.
So now that we have an idea about the Tigers overall baserunning value, what are some other things we can track. Let’s start with outs made on the bases. The table below is sorted by total outs, but includes where each out was made. These are outs made when the runner was not forced, so it would include something like getting thrown out at the plate trying to score from second, but not getting forced out in the middle of a double play:
| Player | OOB1 | OOB2 | OOB3 | OOBHm | OOB |
| Torii Hunter | 1 | 1 | 1 | 1 | 4 |
| Victor Martinez | 0 | 1 | 0 | 3 | 4 |
| Matt Tuiasosopo | 0 | 0 | 1 | 3 | 4 |
| Andy Dirks | 1 | 0 | 0 | 2 | 3 |
| Prince Fielder | 0 | 0 | 0 | 3 | 3 |
| Omar Infante | 1 | 0 | 1 | 1 | 3 |
| Austin Jackson | 0 | 2 | 1 | 0 | 3 |
| Jhonny Peralta | 1 | 2 | 0 | 0 | 3 |
| Miguel Cabrera | 0 | 2 | 0 | 0 | 2 |
| Don Kelly | 0 | 0 | 1 | 1 | 2 |
| Alex Avila | 1 | 0 | 0 | 0 | 1 |
| Avisail Garcia | 0 | 0 | 0 | 0 | 0 |
| Bryan Holaday | 0 | 0 | 0 | 0 | 0 |
| Brayan Pena | 0 | 0 | 0 | 0 | 0 |
| Hernan Perez | 0 | 0 | 0 | 0 | 0 |
| Ramon Santiago | 0 | 0 | 0 | 0 | 0 |
You’ll notice the Tigers have made 32 outs on the bases while the average team has made 33. Essentially, the Tigers know their limitations like with stolen bases. This is not a club blessed with speed, but they know not to push it and don’t run into an inordinate amount of outs. It’s important to recognize that the base coaches are partially responsible for this, so don’t look at Fielder’s 3 outs at home and put it all on him. This isn’t a perfectly individual situation and it’s important to consider the context of every action and game situations. It would just be way too difficult for me to show you the percentage of time Fielder scored on singles from second versus the times he stopped at 3B versus the times he got thrown out in a simple table.
Now let’s look at the Tigers’ Extra Bases Taken Percentage. This is how often a player takes an extra base when the opportunity presents itself. Note that this is how often they go from first to third when the opportunity comes up not how often the make it when they try for it.
| Player | XBT% |
| Omar Infante | 55% |
| Torii Hunter | 49% |
| Austin Jackson | 48% |
| Miguel Cabrera | 41% |
| Avisail Garcia | 40% |
| Jhonny Peralta | 37% |
| Ramon Santiago | 36% |
| Don Kelly | 33% |
| Hernan Perez | 33% |
| Andy Dirks | 29% |
| Prince Fielder | 29% |
| Victor Martinez | 23% |
| Alex Avila | 17% |
| Brayan Pena | 13% |
| Matt Tuiasosopo | 8% |
| Bryan Holaday | 0% |
League average is 40% and the Tigers as a unit take 35%. Some Tigers do this very well and some do it quite poorly. It’s important to think about the last two stats together. The Tigers make an average number of outs and take a slightly below average number of extra bases. This is a team that knows what it can and can’t do and doesn’t run into a lot of outs relative to the rest of the league. Remember our lesson from the stolen bases section. Not making outs is more important than moving up a base.
You can break these stats down further to each base situation. I’ll just give you one to demonstrate. Let’s try for how many times each Tiger has scored from second base on a single:
| Player | 2ndSH |
| Torii Hunter | 14 |
| Austin Jackson | 11 |
| Victor Martinez | 11 |
| Miguel Cabrera | 9 |
| Omar Infante | 8 |
| Jhonny Peralta | 7 |
| Andy Dirks | 6 |
| Don Kelly | 4 |
| Ramon Santiago | 3 |
| Alex Avila | 3 |
| Avisail Garcia | 2 |
| Prince Fielder | 2 |
| Brayan Pena | 2 |
| Hernan Perez | 0 |
| Matt Tuiasosopo | 0 |
| Bryan Holaday | 0 |
It’s important to think about all of these numbers in the context of opportunity and situations, but they are valuable to know. Baserunning doesn’t swing entire seasons dramatically (usually 1-2 wins over an entire season), but it does matter and could easily be talked about more often. In just a few short minutes I’ve given you some other ways to think about baserunning. Stolen bases are important, but they can be measured a bit more accurately too. Additionally, there are stats readily available at sites like Baseball Reference that can tell you more about baserunning value such as XBT% and Outs on the Bases.
As always, there is a lot of information out there and I think you’ll enjoy your baseball watching experience a lot more if you know just a little bit more. Baserunning is about more than raw speed and there are ways to measure which players add value on the bases beyond the stolen base. The 2013 Tigers aren’t the poster children, but they seem to know their game is more about swinging that motoring.
SOEFA Sunday: Reliever Rankings Update (July 28, 2013)
You’ll recall earlier this year we introduced our very own reliever rankings called SOEFA, which you can read about in detail here. For a brief refresher, it combines strand rate, expected OBP against, ERA-, and FIP- into a deviation from league average. Zero is average, and will generally range between -2.5 to 2.5. This includes all pitchers who have thrown at least 20 IP in relief. Should you wish to know the SOEFA for any other reliever, or on a day that isn’t Sunday, hit us on Twitter or in the comments section.
| Rank | Player | Team | SOEFA |
| 1 | Alex Torres | Rays | 1.02 |
| 2 | Neal Cotts | Rangers | 1.00 |
| 3 | Drew Smyly | Tigers | 0.99 |
| 4 | Sergio Romo | Giants | 0.86 |
| 5 | Joaquin Benoit | Tigers | 0.84 |
| 6 | Greg Holland | Royals | 0.84 |
| 7 | Will Harris | Diamondbacks | 0.83 |
| 8 | Kenley Jansen | Dodgers | 0.79 |
| 9 | Mark Melancon | Pirates | 0.79 |
| 10 | Javier Lopez | Giants | 0.79 |
| 11 | Jesse Crain | White Sox | 0.78 |
| 12 | Juan Perez | Blue Jays | 0.77 |
| 13 | Casey Fien | Twins | 0.77 |
| 14 | Jordan Walden | Braves | 0.74 |
| 15 | Joe Thatcher | Padres | 0.73 |
| 16 | Sam LeCure | Reds | 0.72 |
| 17 | Koji Uehara | Red Sox | 0.72 |
| 18 | Jason Grilli | Pirates | 0.71 |
| 19 | Shawn Kelley | Yankees | 0.68 |
| 20 | Preston Claiborne | Yankees | 0.67 |
| 21 | Casey Janssen | Blue Jays | 0.67 |
| 22 | Edward Mujica | Cardinals | 0.66 |
| 23 | Craig Kimbrel | Braves | 0.65 |
| 24 | Glen Perkins | Twins | 0.63 |
| 25 | Sean Doolittle | Athletics | 0.62 |
| 26 | Manny Parra | Reds | 0.59 |
| 27 | Paco Rodriguez | Dodgers | 0.57 |
| 28 | Brandon Kintzler | Brewers | 0.55 |
| 29 | Oliver Perez | Mariners | 0.55 |
| 30 | Robbie Ross | Rangers | 0.55 |
| 31 | Seth Maness | Cardinals | 0.55 |
| 32 | Trevor Rosenthal | Cardinals | 0.54 |
| 33 | Andrew Bailey | Red Sox | 0.52 |
| 34 | David Aardsma | Mets | 0.52 |
| 35 | Chad Qualls | Marlins | 0.51 |
| 36 | Edgmer Escalona | Rockies | 0.51 |
| 37 | Matt Belisle | Rockies | 0.50 |
| 38 | Brian Matusz | Orioles | 0.49 |
| 39 | Brett Cecil | Blue Jays | 0.49 |
| 40 | Joel Peralta | Rays | 0.49 |
| 41 | Fernando Abad | Nationals | 0.49 |
| 42 | Antonio Bastardo | Phillies | 0.48 |
| 43 | Ryan Cook | Athletics | 0.48 |
| 44 | Andrew Miller | Red Sox | 0.48 |
| 45 | Boone Logan | Yankees | 0.48 |
| 46 | Luke Hochevar | Royals | 0.47 |
| 47 | Darren O’Day | Orioles | 0.47 |
| 48 | Tommy Hunter | Orioles | 0.46 |
| 49 | Aroldis Chapman | Reds | 0.45 |
| 50 | Bobby Parnell | Mets | 0.45 |
| 51 | Ross Ohlendorf | Nationals | 0.44 |
| 52 | Junichi Tazawa | Red Sox | 0.44 |
| 53 | Josh Collmenter | Diamondbacks | 0.43 |
| 54 | Tyler Clippard | Nationals | 0.43 |
| 55 | Jim Henderson | Brewers | 0.42 |
| 56 | Matt Reynolds | Diamondbacks | 0.42 |
| 57 | Jonathan Papelbon | Phillies | 0.42 |
| 58 | Dale Thayer | Padres | 0.42 |
| 59 | Chad Gaudin | Giants | 0.41 |
| 60 | Sandy Rosario | Giants | 0.40 |
| 61 | Dan Jennings | Marlins | 0.40 |
| 62 | Francisco Rodriguez | – – – | 0.40 |
| 63 | Addison Reed | White Sox | 0.39 |
| 64 | J.P. Howell | Dodgers | 0.39 |
| 65 | Brad Ziegler | Diamondbacks | 0.38 |
| 66 | Luis Avilan | Braves | 0.36 |
| 67 | Jason Frasor | Rangers | 0.36 |
| 68 | Vin Mazzaro | Pirates | 0.36 |
| 69 | David Carpenter | Braves | 0.34 |
| 70 | Tom Gorzelanny | Brewers | 0.34 |
| 71 | Jeanmar Gomez | Pirates | 0.34 |
| 72 | Kevin Gregg | Cubs | 0.33 |
| 73 | Cody Allen | Indians | 0.33 |
| 74 | Santiago Casilla | Giants | 0.32 |
| 75 | Randy Choate | Cardinals | 0.32 |
| 76 | Steve Cishek | Marlins | 0.30 |
| 77 | Tanner Scheppers | Rangers | 0.30 |
| 78 | Ernesto Frieri | Angels | 0.30 |
| 79 | Alfredo Simon | Reds | 0.30 |
| 80 | Scott Downs | Angels | 0.28 |
| 81 | James Russell | Cubs | 0.28 |
| 82 | Pat Neshek | Athletics | 0.27 |
| 83 | Michael Kohn | Angels | 0.27 |
| 84 | Jean Machi | Giants | 0.27 |
| 85 | Josh Outman | Rockies | 0.26 |
| 86 | Rafael Betancourt | Rockies | 0.26 |
| 87 | Aaron Loup | Blue Jays | 0.26 |
| 88 | Tony Watson | Pirates | 0.25 |
| 89 | Alfredo Figaro | Brewers | 0.25 |
| 90 | Jerome Williams | Angels | 0.25 |
| 91 | Jared Burton | Twins | 0.24 |
| 92 | Jose Veras | Astros | 0.24 |
| 93 | Steve Delabar | Blue Jays | 0.23 |
| 94 | Anthony Swarzak | Twins | 0.23 |
| 95 | Nate Jones | White Sox | 0.23 |
| 96 | Jim Johnson | Orioles | 0.23 |
| 97 | Jose Mijares | Giants | 0.23 |
| 98 | Fernando Rodney | Rays | 0.21 |
| 99 | Craig Breslow | Red Sox | 0.21 |
| 100 | Luke Gregerson | Padres | 0.21 |
| 101 | Justin Wilson | Pirates | 0.20 |
| 102 | David Robertson | Yankees | 0.20 |
| 103 | Rex Brothers | Rockies | 0.19 |
| 104 | Rafael Soriano | Nationals | 0.18 |
| 105 | Caleb Thielbar | Twins | 0.17 |
| 106 | Ross Wolf | Rangers | 0.16 |
| 107 | J.J. Hoover | Reds | 0.16 |
| 108 | Jamey Wright | Rays | 0.15 |
| 109 | Mariano Rivera | Yankees | 0.14 |
| 110 | Dane de la Rosa | Angels | 0.14 |
| 111 | Logan Ondrusek | Reds | 0.14 |
| 112 | Charlie Furbush | Mariners | 0.13 |
| 113 | Jesse Chavez | Athletics | 0.13 |
| 114 | Heath Bell | Diamondbacks | 0.12 |
| 115 | Kevin Jepsen | Angels | 0.11 |
| 116 | Bryan Morris | Pirates | 0.11 |
| 117 | A.J. Ramos | Marlins | 0.11 |
| 118 | Joe Nathan | Rangers | 0.09 |
| 119 | John Axford | Brewers | 0.09 |
| 120 | Anthony Varvaro | Braves | 0.08 |
| 121 | Burke Badenhop | Brewers | 0.07 |
| 122 | Tim Collins | Royals | 0.07 |
| 123 | Chris Perez | Indians | 0.06 |
| 124 | Joe Kelly | Cardinals | 0.06 |
| 125 | Aaron Crow | Royals | 0.05 |
| 126 | Tyson Ross | Padres | 0.04 |
| 127 | LaTroy Hawkins | Mets | 0.04 |
| 128 | Mike Dunn | Marlins | 0.04 |
| 129 | Cesar Ramos | Rays | 0.02 |
| 130 | Yoervis Medina | Mariners | 0.01 |
| 131 | Matt Lindstrom | White Sox | 0.01 |
| 132 | Ryan Pressly | Twins | 0.00 |
| 133 | Matt Thornton | – – – | -0.01 |
| 134 | Joe Smith | Indians | -0.01 |
| 135 | Adam Ottavino | Rockies | -0.02 |
| 136 | Bryan Shaw | Indians | -0.04 |
| 137 | Manuel Corpas | Rockies | -0.04 |
| 138 | Joe Ortiz | Rangers | -0.04 |
| 139 | Michael Bowden | Cubs | -0.05 |
| 140 | Carter Capps | Mariners | -0.05 |
| 141 | Wilton Lopez | Rockies | -0.05 |
| 142 | Jake McGee | Rays | -0.07 |
| 143 | Craig Stammen | Nationals | -0.08 |
| 144 | Brad Brach | Padres | -0.09 |
| 145 | Greg Burke | Mets | -0.09 |
| 146 | Darren Oliver | Blue Jays | -0.09 |
| 147 | Scott Rice | Mets | -0.09 |
| 148 | Ryan Webb | Marlins | -0.09 |
| 149 | Josh Edgin | Mets | -0.09 |
| 150 | Tony Sipp | Diamondbacks | -0.10 |
| 151 | Matt Guerrier | – – – | -0.11 |
| 152 | Troy Patton | Orioles | -0.11 |
| 153 | Darin Downs | Tigers | -0.11 |
| 154 | Joba Chamberlain | Yankees | -0.12 |
| 155 | Brian Duensing | Twins | -0.12 |
| 156 | J.J. Putz | Diamondbacks | -0.12 |
| 157 | Tim Stauffer | Padres | -0.13 |
| 158 | Blake Parker | Cubs | -0.14 |
| 159 | Brad Lincoln | Blue Jays | -0.15 |
| 160 | Luke Putkonen | Tigers | -0.17 |
| 161 | Tom Wilhelmsen | Mariners | -0.17 |
| 162 | Josh Roenicke | Twins | -0.19 |
| 163 | Cory Gearrin | Braves | -0.19 |
| 164 | Rich Hill | Indians | -0.20 |
| 165 | Nick Hagadone | Indians | -0.21 |
| 166 | Jerry Blevins | Athletics | -0.22 |
| 167 | Wesley Wright | Astros | -0.23 |
| 168 | David Hernandez | Diamondbacks | -0.23 |
| 169 | Ronald Belisario | Dodgers | -0.25 |
| 170 | Jonathan Broxton | Reds | -0.26 |
| 171 | Blake Beavan | Mariners | -0.27 |
| 172 | Phil Coke | Tigers | -0.28 |
| 173 | Michael Gonzalez | Brewers | -0.28 |
| 174 | Vinnie Pestano | Indians | -0.28 |
| 175 | Danny Farquhar | Mariners | -0.29 |
| 176 | Garrett Richards | Angels | -0.30 |
| 177 | Jose Cisnero | Astros | -0.32 |
| 178 | Pedro Strop | – – – | -0.34 |
| 179 | George Kontos | Giants | -0.35 |
| 180 | Drew Storen | Nationals | -0.36 |
| 181 | T.J. McFarland | Orioles | -0.36 |
| 182 | Grant Balfour | Athletics | -0.36 |
| 183 | Paul Clemens | Astros | -0.37 |
| 184 | Kyle Farnsworth | Rays | -0.37 |
| 185 | Matt Albers | Indians | -0.39 |
| 186 | Mike Adams | Phillies | -0.40 |
| 187 | Huston Street | Padres | -0.40 |
| 188 | Kelvin Herrera | Royals | -0.40 |
| 189 | Clayton Mortensen | Red Sox | -0.41 |
| 190 | Travis Blackley | Astros | -0.42 |
| 191 | Scott Atchison | Mets | -0.43 |
| 192 | Alex Wilson | Red Sox | -0.44 |
| 193 | Al Alburquerque | Tigers | -0.47 |
| 194 | Brandon Lyon | Mets | -0.48 |
| 195 | Esmil Rogers | Blue Jays | -0.49 |
| 196 | Justin De Fratus | Phillies | -0.52 |
| 197 | Bruce Chen | Royals | -0.54 |
| 198 | Jeremy Horst | Phillies | -0.59 |
| 199 | Raul Valdes | Phillies | -0.62 |
| 200 | Hector Ambriz | Astros | -0.62 |
| 201 | Jeremy Affeldt | Giants | -0.64 |
| 202 | Adam Warren | Yankees | -0.67 |
| 203 | Henry Rodriguez | – – – | -0.70 |
| 204 | Michael Kirkman | Rangers | -0.73 |
| 205 | Carlos Marmol | – – – | -0.86 |
| 206 | Anthony Bass | Padres | -0.91 |
| 207 | Shawn Camp | Cubs | -1.02 |
| 208 | Hector Rondon | Cubs | -1.05 |
| 209 | Brandon League | Dodgers | -1.12 |
The Nine Worst One Inning Saves in MLB History
At New English D we’re very critical of the save statistic because not only does it not reflect actual performance, but it has also affected the way managers actually use their bullpens. Managers chase saves which results in using their best relievers in the wrong situations. I won’t rehash the problems, but you can check out the whole rationale in the bullpen section of our Stat Primer page.
What I’d like to do is identify the The Nine Worst One Inning Saves in MLB History. Below you’ll find a list of the most ridiculous appearances in which a reliever was credited with a “save.” The argument here is that a three up three down inning with 3 strikeouts results in a save and is valued identically to these appearances in the save column.
In order to gather this list, I sorted every save since the stat became official in the late ’60s by the number of baserunners allowed after deleting runners who reached via errors. After that I sorted by walks and dropped out anyone who induced a double play in order to leave me with nine. From there, I broke any ties by sorting by the number of times each pitcher missed the strike zone. The only reason I was hunting for nine is because this is part of our The Nine series. A list of 11 or 13 would make the same point. I was just trying to find the absolute worst 1 inning saves in history. Let’s do it. Each of these appearances are 1 inning saves with 5 total baserunners:
| Rank | Player | Date | Tm | H | ER | BB | SO |
| 9 | Billy Koch | 9/27/2002 | OAK | 3 | 2 | 2 | 0 |
| 8 | Todd Jones | 5/19/2007 | DET | 3 | 2 | 2 | 0 |
| 7 | Bobby Jenks | 9/29/2006 | CHW | 3 | 2 | 2 | 3 |
| 6 | Trevor Hoffman | 4/3/2002 | SDP | 3 | 2 | 2 | 1 |
| 5 | Bryan Harvey | 6/25/1989 | CAL | 3 | 2 | 2 | 3 |
| 4 | Brad Lidge | 7/26/2010 | PHI | 3 | 2 | 2 | 0 |
| 3 | Jeff Brantley | 5/21/2000 | PHI | 2 | 2 | 3 | 0 |
| 2 | Joel Hanrahan | 9/15/2012 | PIT | 2 | 2 | 3 | 1 |
| 1 | Sergio Santos | 9/26/2011 | CHW | 2 | 2 | 3 | 3 |
You’ll notice most of these are quite recent. Managers didn’t used to only call on pitchers for one inning saves and they used to pull relievers who pitched terribly before things got this bad. All of these pitchers earned a save for these performances. If you can get a save for pitching like this, how much is a save really worth?
What’s Going On With Verlander?
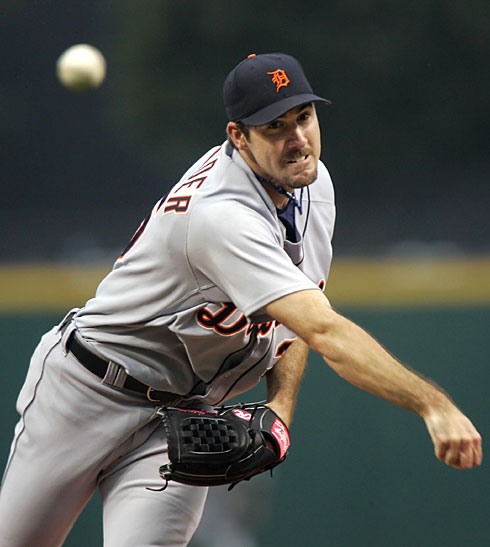
Justin Verlander was baseball’s best pitcher over the last four seasons, but this year Verlander has regressed all the way down to being, like, baseball’s 10th best pitcher. We’ve overblown his struggles because we’re used to him never struggling. He’s not 2009-2012 Justin Verlander, but he’s still better than almost anyone else in baseball.
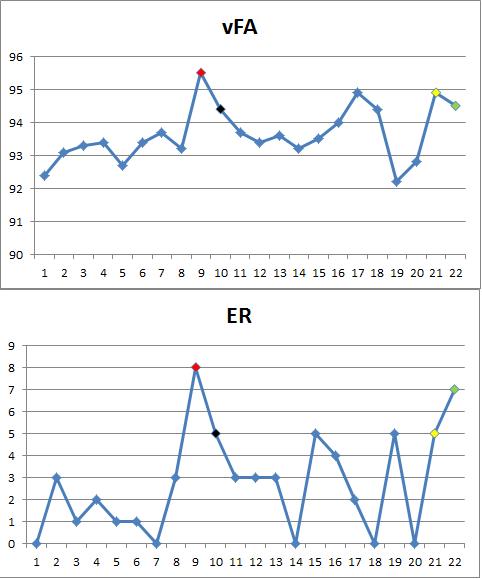
That said, despite a respectable 3.69 ERA, 3.35 FIP (what’s FIP?), and 3.0 WAR (what’s WAR?), there are some signs of trouble. He has the lowest K/9 and highest BB/9 since his 2008 struggles:

The strikeout drop isn’t dramatic, but the walk differential is a bit concerning. He’s allowing a higher batting average against and a higher BABIP (what’s BABIP?) so some of this could be luck, but it could also be because he’s easier to hit. His line drive, fly ball, and ground ball rates are almost identical to his 2012 numbers .
The key for JV is a little bit of batted ball luck, but mostly it’s a strikeout to walk ratio problem. Try this on for size, in 2012, 32% of Verlander’s total batters faced ended in a walk, HBP, or strikeout. In 2013, it’s exactly the same. He’s allowing the same percentage of balls to be put in play as last season and he’s allowed the exact same line drive, fly ball, and ground ball mix. Exactly the same.
The difference for Verlander in 2013, we can say, is that he’s walking batters during at bats in which he used to strike them out. This is evident when you consider opposing hitters are chasing pitches outside the zone against Verlander less often and he’s getting fewer swinging strikes. Basically, batters aren’t chasing Verlander’s pitches and he isn’t inducing as many swings and misses as he did last season. As a result, instead of striking out a batter chasing on 3-2, he’s walking them which extends innings and makes the hits he does allow more costly in terms of run prevention.
He’s not allowing more balls in play as a percentage of batters faced, but he is allowing more overall because walks are extending his innings and giving other teams more chances to cash in. In 2012 he faced 3.7 batters per inning on average. In 2013 it’s 4.3. The problem with Verlander is that he’s doesn’t put hitters away with a strikeout and instead grants a walk. Everything else unravels from there.
What’s behind all of this?
I have two basic answers with one common cause. None of it has anything to do with his velocity. We’ve seen Verlander pitch effectively with lower velocity before and he’s been successful this season when he didn’t have a good fastball and he’s been bad this season when he has had the 95+mph.
This is something different. It’s something fixable. It’s not something we should worry too much about. Let’s break it down.
1. Movement on His Breaking Balls
Last season his curveball averaged 6.3 inches of horizontal movement and 8.5 inches of vertical movement (these are Pitch F/X numbers and are based on where the ball would be expected to finish based on a baseball that wasn’t rotating). This year, he’s at 5.2 and 7.7 inches respectively. It’s easier to see graphically (All graphs from catcher’s perspective. H/T to Brooks and FanGraphs):
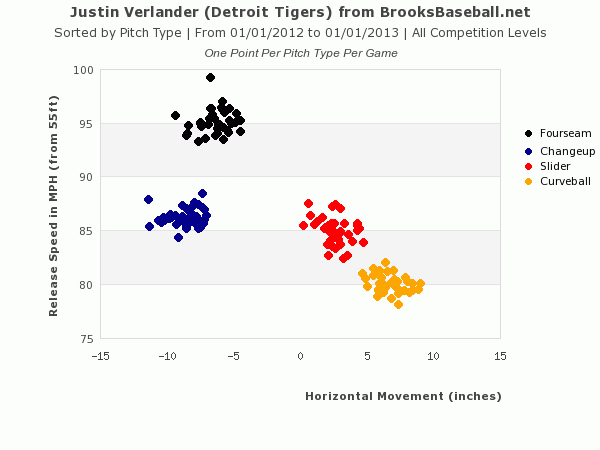

Notice how his curveball has as much horizontal break as his slider this season when it used to have more in the past. Now let’s look at horizontal and vertical movement together.


You can see the problem in his slider too a little bit, actually. The curveball isn’t breaking horizontally enough and the slider doesn’t have enough vertical depth. Both pitches are blending into a hanging breaking ball. The slider is faster, but it lacks the vertical depth needed to get hitters (especially lefties) out. The curveball is essentially just a slower version of the slider with some vertical depth. Neither is what it was in 2012. In order for Verlander to use these pitches effectively, they need to have different properties. The curveball is a slower pitch with more break and the slider is faster with less. They need to be different in all three dimensions – velocity, horizontal, and vertical – and they need to both break more in general than they are this season.
As a result, hitters are laying off the sliders that they used to swing through and more of those sliders are getting called as balls. The curveball has still been an effective weapon at times, but he’s throwing it less often because it isn’t moving the way he wants it to.
This is a bit convoluted so I’lll try to make it clearer. His curveball is getting more swings than it used to and the contact against on it is up because it isn’t moving the way it used to. The slider is less effective because hitters are swinging less and it’s not landing in the zone. The curveball is more hittable and the slider is less enticing. This is problem number one.
2. Fastball…Movement
In the charts above, you could see the breaking ball problems if you looked at overall averages from each game. They are clear as day. But the fastball doesn’t look much different other than a bit of a drop in average velocity. But as I pointed out earlier, two of his rockiest starts have come when he had his best fastball. The success isn’t about velocity. It’s above vertical movement on his fastball and you can’t see the problem if you don’t look at every pitch.
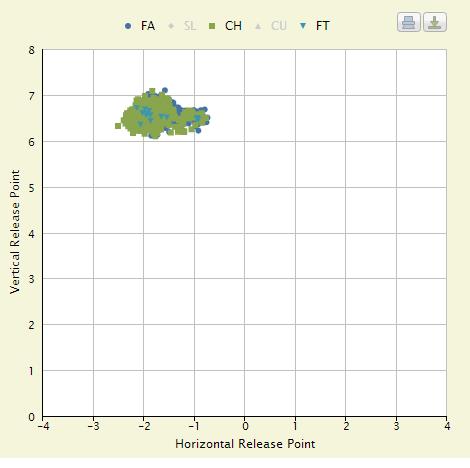
The horizontal problem with the curveball and vertical issue with the slider are evident overall because they are a consistent problem. But the fastball issue is only some of the time, take a look at 2012 and then 2013:

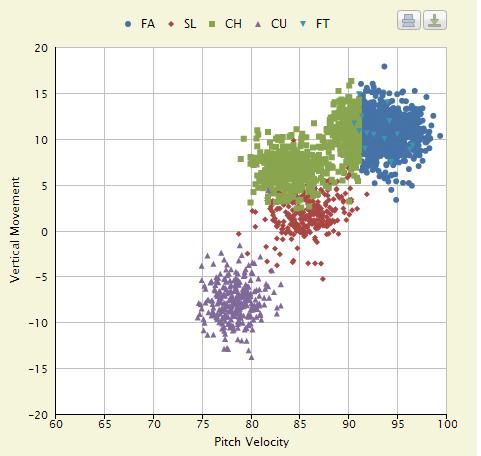
Notice that missing cluster of fastballs in the 0-5 vertical movement section? Those are gone. He’s missing a subset of his fastballs that drop significantly on their way to the plate. You can see it in the horizontal and vertical plots too, 2012 and then 2013:


A cluster of fastballs (and changeups because of some Pitch F/X confusion) is missing that are just down and to the left of center. They are gone. It’s not like there are fewer or they aren’t moving as much, they are totally absent. And this isn’t a classification issue because we’re not talking about these being fastballs OR changeups, there simply are no pitches thrown in that location on the chart.
His fastballs all have the same general horizontal and vertical movement as each other this season when Verlander used to be able to go to a fastball that had more sink on it in 2012. Not having that pitch in his arsenal is likely the cause of a nearly 3% drop in his fastball swing and miss rate from 2012 to 2013. Verlander used to get more whiffs on the fastball and now he isn’t anymore and when they do make contact they do so for more line drives. They’re squaring up his fastball more because there is less variation in its movement.
So now that we’ve established the problem and the connection to the results, we have to ask what is responsible for this? Everyone wants to talk velocity, but two of his worst starts were two of his “best” fastball days. No friends, this is something much more technical.
Release Point
Let’s take a look at his release points form 2012 and 2013:
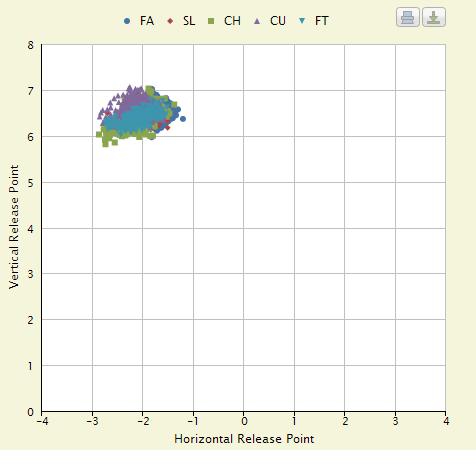
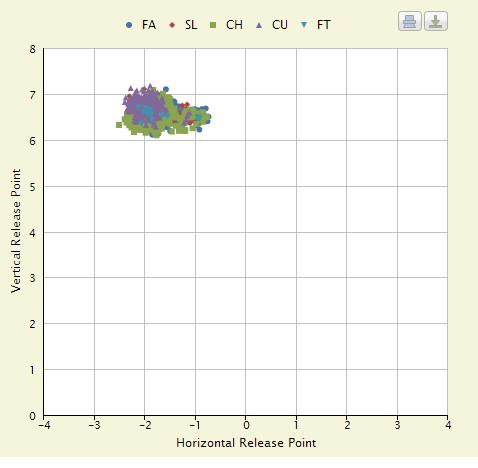
That looks awfully different. Terrifyingly different, one might say if they were prone to hyperbole. Let’s take a look at just curveballs and sliders first:


That’s a big difference. The scale is in feet. We’re talking about release the ball 6-12 inches different from normal in some cases, and at the very least it’s a more inconsistent release point that we saw in 2012. Let’s try fastballs and changeups:

Again, this is a big difference. I don’t even need to describe it to you. He’s releasing the ball closer to first base on his breaking balls and on his fastballs and changeups. This is the difference. It’s a mechanical issue that he needs to correct. I’m not a master of .gifs and screenshots, but I’ve seen the tape from 2012 and 2013 and can tell you he’s falling off to the first base side more in 2013 than he used to. His body is taking him away from the plate and it’s preventing him from getting on top of his pitches – which makes sense that he can’t get the vertical movement on some of his fastballs but the horizontal movement is just fine. It also explains the problem with his breaking balls. Less depth on the slider and less horizontal break on the curveball.
I’m not a pitching coach and I didn’t pitch growing up (I caught, so I can diagnose the problem even if I can’t fix it), but I can clearly see the problem. I don’t know if Verlander is out of whack in his timing or if he’s favoring a lower body injury, but this is what’s going on.
The problem with his pitches lines up with the problems in results and this release point problem explains it all very nicely. Something else could be wrong, but this definitely is. It’s right there in front of you.
This is good news for Tigers fans because it’s really easy to fix compared to an injury. Verlander can just straighten out and get back to being himself. He just signed a huge contract, so it’s good to see this might not be him wearing down but rather him just being out of sync. That’s actually the explanation he’s given the press. It seems to be true.
It also explains why he’s shown flashes of himself. Sometimes he does throw the ball from the right spot and those pitches do their thing. The problem is when he gets out of sync and he loses it, things can turn quickly. Have you noticed how it’s tended to blow up in some innings but rarely across entire games. This is Verlander fighting his delivery, not fighting his body.
And he can fix it. Heck, Scherzer has a way more complicated motion and he’s repeated that like a champ so far this season. It’s going to be okay Tigers fans, the ace isn’t fading, he’s just going through a bit of a rough patch. And he can find a way to fix it. (Here’s a post from August 6th, showing improvement!)
Why OBP Should Be Your New Batting Average
Part of my ethos as an educator is to take nothing for granted. Don’t assume your student knows something just because you know it. I want to bring a little more of that to baseball, especially when discussing modern statistics. One of the most basic sabermetric ideas is that On-Base Percentage (OBP) is a better way to measure players than batting average (AVG). This is something a lot of people understand, but not everyone does. That’s okay, I’d like to explain why you should use OBP instead of AVG when evaluating players and I’ll even teach you a trick to make it easier.
OBP = (H+BB+HBP)/(AB+BB+HBP+SF)
Let’s use 2012 David Wright as our example. Wright had a .306 AVG in 2012 as he got 178 hits in 581 AB. Batting average tells you the rate at which a player gets a hit in trips to the plate in which they don’t walk, get hit, or sacrifice. That’s useful information, but it is incomplete information. If you want to look at batting average to compliment OBP, that’s great, but don’t look at just AVG. Here’s why.
In this is example, you’ve ignore the times Wright reached base via a walk or hit by pitch. You’ve essentially removed that part of his value from the stat at which you’re looking. David Wright got on base 84 more times in 2012 that you wouldn’t know about if you only look at batting average. You’re right that a walk isn’t quite as good as a hit, but it is much, much better than an out. Walking puts you on base for someone else to move you over and in and getting on base correlates much more closely with runs scored than batting average.
To be specific, a walk is about 78% as good as a single. It’s perfectly reasonable to prefer a hit to a walk, but a walk is much better than an out and if you’re going to use a basic rate statistic, use a stat that includes walks. If you’re more ambitious, Weighted On Base Average (wOBA) actually weighs each outcome relative to its value, but let’s keep it simple and use OBP.
The point is simple. David Wright’s AVG is .306, but his OBP was .391. He was 17th in AVG, but 8th in OBP. If you ignore walks, you’re missing out on a big part of a player’s offensive game. You’re underrating him because you’re not considering how often he gets on base. If you want everything to count the same, OBP is the stat for you. If you’re looking for something even better, try wOBA. Don’t use batting average because it simply ignores and important part of baseball.
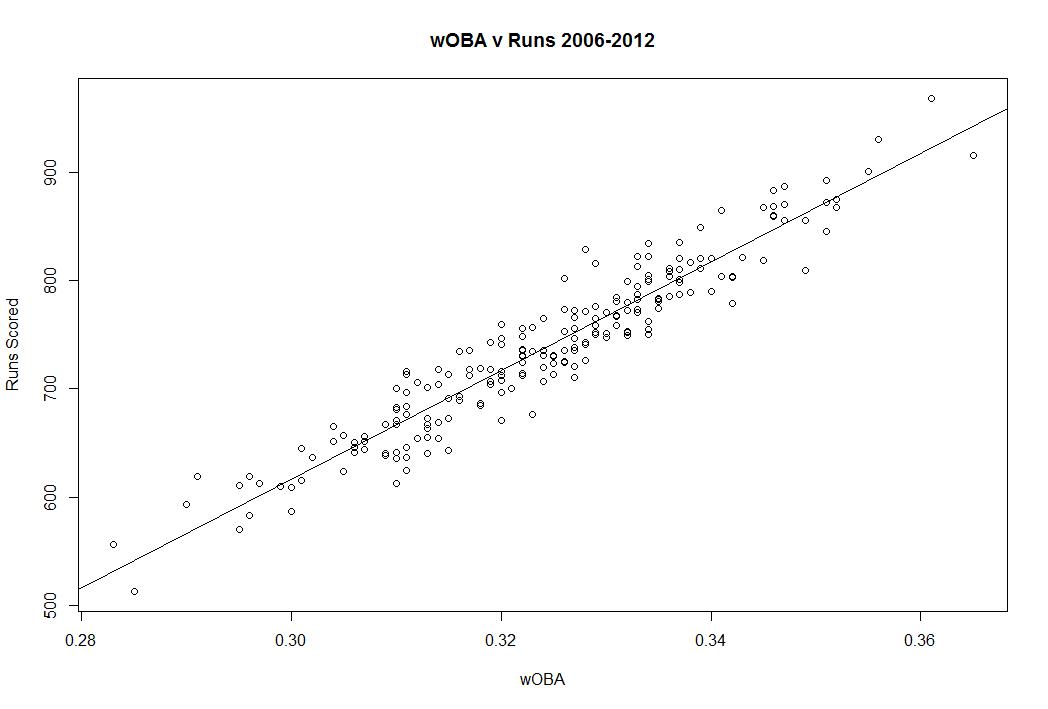
Let’s do something very simple to understand the power of OBP vs AVG. I took each team’s seasons from 2006-2012 and compared their runs scored to AVG and OBP. The correlation is much stronger for OBP than AVG. For batting average the adjusted R squared is .612. For OBP, it’s .7738. In other words, you can explain 61% of the variation in runs scored with batting average and 77% of the variation in runs scored with OBP. OBP is more highly correlated with scoring runs than batting average. Why wouldn’t you want to look at stats that better predict scoring? Here it is in graphical form (the vertical axes are the same):
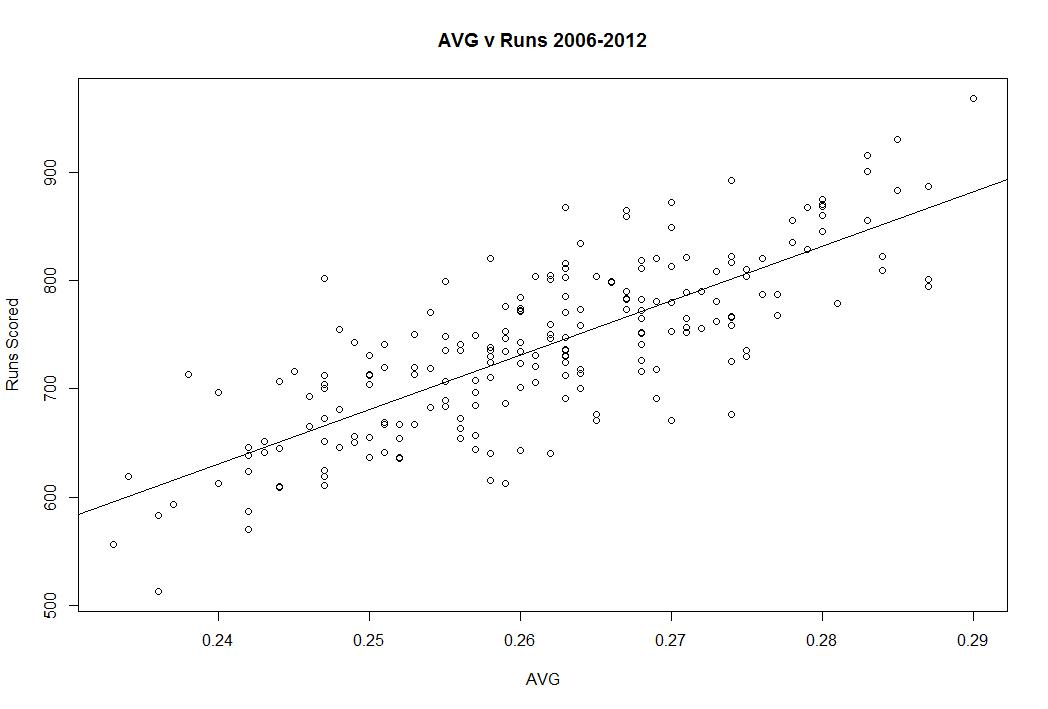

If you’re interested in going further, take a look at wOBA, because wOBA’s adjusted R squared is .9077, which is a lot better. wOBA tells you more about runs scoring than AVG and even more than OBP. Here it is in graphical form:
I think one reason people are resistant to OBP is because batting average is imprinted on the DNA of the game. We know that .300 is a good average and that .400 is iconic. You have a really good idea what each batting average means, but to use OBP you have to learn how to properly adjust your expectations. .300 is a good average, but you don’t really know what the equivalent OBP is. I’m going to help with a simple rule.
The 60 Rule. That’s it. Take a player’s OBP and subtract .060 from it to get it on the batting average scale. The average OBP is about 60 points higher and the standard deviations are similar. This rule won’t be perfect if you’re statistically savvy, but it will allow you to easily interpret OBP.
If a player has a .390 OBP, just drop 60 points and that is essentially as good as a player who hits .330 using batting average. So David Wright’s average last year was .306, but in reality, he was better than that because of his above average walk rate. He’s more like a .330 hitter than a .300 hitter when you factor in the walks if you choose to think in terms of the batting average scale you learned growing up.
If you’re interested in new stats, we have plenty of info in our Stat Primer page, but the key takeaway here is that little steps are important. OBP is telling you exactly what you think batting average should. It’s telling you how often someone gets on base, while batting average tells you how often they get on base when they get a hit in trips to the plate in which they didn’t walk. Which one makes more sense when you put it like that?
Take a look at OBP next time you scan the stats. It’ll help you understand the game a lot better. Ask questions and be curious. If you don’t agree with a statistic, ask yourself why. Think critically. Look at every stat, but OBP is where you should look if you’re interested in the concept batting average is going after.
The Nine Best Seasons Under 70 RBI
By now I’m sure you’ve seen our series explaining why RBI is not a good statistic for measuring individual value. The reasons are simple. RBI is simply too dependent on the quality of the team around you to be a good measure of individual value because the number of baserunners, location of baserunners, and number of outs are outside of a player’s control. To catch you up, we’ve already seen:
- How RBI can mislead you when comparing two players
- How you can have a lot of RBI during a bad season
- And how RBI don’t even out over the course of a career
Now, let’s turn the question on its head. Below you’ll find the best seasons since 1920 (when RBI became an official stat) in which a player had fewer than 70 RBI while also having 600 or more plate appearances. In other words, these are players who had a full season of at bats, played great, and didn’t have many RBI. The ranking uses wRC+ (what’s wRC+?) which is an offensive rate statistic that compares a player to league average and park, meaning that you can use it to compare across eras. 100 is average and every number above or below is a percent better or worse than league average.
| Rank | Season | Name | Team | PA | RBI | AVG | OBP | SLG | wRC+ |
| 9 | 1938 | Arky Vaughan | Pirates | 650 | 68 | 0.322 | 0.433 | 0.444 | 150 |
| 8 | 1993 | Rickey Henderson | – – – | 610 | 59 | 0.289 | 0.432 | 0.474 | 151 |
| 7 | 1968 | Pete Rose | Reds | 692 | 49 | 0.335 | 0.391 | 0.470 | 151 |
| 6 | 1975 | Ken Singleton | Orioles | 714 | 55 | 0.300 | 0.415 | 0.454 | 152 |
| 5 | 1987 | Tony Gwynn | Padres | 680 | 54 | 0.370 | 0.447 | 0.511 | 153 |
| 4 | 1974 | Rod Carew | Twins | 690 | 55 | 0.364 | 0.433 | 0.446 | 153 |
| 3 | 1968 | Jimmy Wynn | Astros | 646 | 67 | 0.269 | 0.376 | 0.474 | 159 |
| 2 | 1974 | Joe Morgan | Reds | 641 | 67 | 0.293 | 0.427 | 0.494 | 162 |
| 1 | 1988 | Wade Boggs | Red Sox | 719 | 58 | 0.366 | 0.476 | 0.490 | 167 |
What you can see from this list is that these are excellent seasons and none of them gathered more than 68 RBI. Let’s put this in the modern context. In 2012, only 8 players had a wRC+ of 150 or better. Cano, Encarnacion, Fielder, McCutchen, Braun, Posey, Cabrera, and Trout. On the other hand, 80 players had 70 or more RBI in 2012. Among them were Alexei Ramirez who had 73 RBI and a 71 wRC+ and Delmon Young who had 74 RBI and a 89 wRC+.
Usually big RBI numbers and high wRC+ go hand in hand, but there is a lot of variation that obscures the results. Good hitters usually have a lot of RBI, but not always. You’ve seen it in our previous posts on the subject and now you can see that great seasons don’t guarantee you anything in terms of RBI.
RBI isn’t the worst statistic in the world, but it just isn’t a good way to measure individual value when you consider how some players can have 100 RBI in a year and be 25% below average and some can have fewer than 70 RBI and be 50% better than league average. These numbers don’t even out over an entire career and you can’t use RBI to compare two players.
There isn’t a lot RBI can tell you about individual players. You can be good and not have them, you can be bad and have them, and this isn’t about small samples. RBI describe what happened on the field, but they are a blunt and unhelpful tool in measuring individuals. It’s time to move forward and stat lining up our valuations with better measures like wOBA, wRC+, and wRAA. If you use RBI to measure players, you going to end up thinking Ruben Sierra’s 1993 season in which he had 101 RBI is better than Rickey Henderson’s 1993 in which he had 59 RBI when in reality Sierra was 20% below average and Henderson was 50% below average. That’s way too big a mistake to make when there are much better alternatives.
