
One of our missions here at New English D is to help popularize sabermetric concepts and statistics and diminish the use of certain traditional stats that are very misleading. If you’re a return reader, you’ve no doubt seen our series about the pitcher win:
- The Nine Best Seasons Under 9 Wins
- The Nine Worst 20 Win Seasons
- Comparing Wins Over Entire Careers
- A Case Study from 2012 about Wins
- 12 Assorted Facts Regarding Wins
I encourage you to read those posts if you haven’t already, but I’m confident in the case I’ve laid out. Wins aren’t a good way to measure pitchers’ performance and I’ll let those five links stand on their own. Today, I’d like to move forward and pick up the mantle with another statistic that is very misleading based on how it is currently used: Runs Batted In (RBI).
I’ll have a series of posts on the subject, but I’m going to start with a case study in order to explain the theory. RBI are a bad statistic because they are a misleading measure of value. Most people consider RBI to be really important because “driving in runs” is critical to success, but RBI is very much dependent on the performance of the other players on your team. A very good hitter on a bad team will have fewer RBI than a good hitter on a good team because even if they perform in an identical manner, the first hitter will have fewer chances to drive in runners. Even if they have the same average, on base, and slugging percentages overall and with runners on and with runners in scoring position. The raw number RBI is a blunt tool to measure the ability to drive in runs.
Factors that determine how many RBI you have outside of your control are the number and position of runners on base for you, the number of outs when you come to the plate with men on base, and the quality of the baserunners. If you get a hit with runners in scoring position 40% of the time (a great number) but there are just 100 runners on base for you during a season, you will get no more than 40 RBI. If you get a hit 40% of the time and have 400 runners on base for you during a season, you could have 100 RBI. That’s a big difference even if you perform in the same way.
I’m not making the case here that RBI is completely meaningless and that hitting with runners on base is exactly the same as hitting with the bases empty, but simply that RBI as a counting stat is very misleading. Even if you think the best hitters are the guys who get timely hits and can turn it up in the clutch, you surely can appreciate that certain guys have different opportunities to drive in runs. RBI is very dependent on context and that means it’s not a very good way to measure individual players.
Allow me to demonstrate with a simple case study. Let’s start with comparing two seasons in which the following two players both played the same number of games.
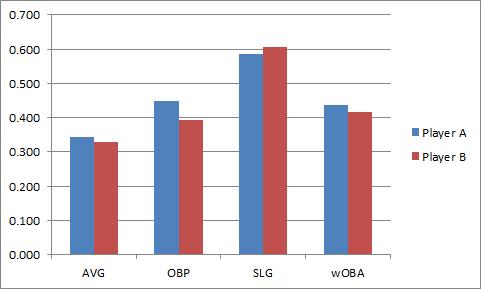
As you can see, Player A leads in average, OBP, and wOBA (what’s wOBA?) and is just a but behind in slugging. In wRC+, Player A leads 177 to 166 over Player B. If we take a look at BB% and K%, Player A looks much better.

All in all, Player A is the better player. We’ve looked at all of their rate stats and we’ve looked at wRC+ which controls for league average and park effect. It’s hard to argue that Player B is better. I couldn’t make a case to that effect.
Here’s the big reveal which some of you have probably figured out. Player A is Miguel Cabrera in 2011, Player B is Miguel Cabrera in 2012. This is the same player during two different seasons. In 2011, when Cabrera was clearly the better player, he had 105 RBI. In 2012, when he was worse, he drove in 139. Everything tells us he was better in 2011 except RBI. That should make use skeptical. It’s even more of a problem when you consider his situational hitting.
The graphs below are on identical scales:

Cabrera was better in 2011 in every situation and by each statistic except for his average (very close) and slugging percentage with no one on base. Which tells you nothing about how well he drives in runs. If you look at the HR distribution it tells you the same story.
| HRs | 2011 | 2012 |
| Bases Empty | 14 | 27 |
| Men on Base | 16 | 17 |
| Men in Scoring | 10 | 9 |
We can give him credit for those solo HR RBI from 2012, so let’s just lop 13 off the top. That still leaves 2012 Cabrera with 21 more RBI than 2011 Cabrera. Cabrera had a better season in 2011, but he had fewer RBI than in 2012. Most of this can simply be explained by the Tigers’ team OBP in the two seasons and where he hit in the lineup. If you subtract out Cabrera the Tigers got on base about 32% of the time in 2011 and 32.4% of the time in 2012 while Cabrera got to the plate a little less often because he hit 4th instead of 3rd. So there are more baserunners in general in 2012, but we can break this down even further.
In sum, Cabrera actually had more runners on base for him in 2011 than in 2012 but that doesn’t really tell the whole story. Let’s break it down by the number of baserunners on each base when he came to the plate:
| 2011 | 2012 | |
| Runner on 1B | 235 | 212 |
| Runner on 2B | 150 | 146 |
| Runner on 3B | 74 | 86 |
This should tell you the story even better. Cabrera had more baserunners in 2011, but the baserunners in 2012 were more heavily slanted toward scoring position. Cabrera had more runners closer to the plate so it’s easier to drive them in.
I intentionally chose Cabrera for this example because it strips away the idea that a given player just “has a knack” for driving in runs. Cabrera is an “RBI guy” if you subscribe to that idea. Miguel Cabrera had a better season in 2011 than 2012 when you break it down overall and in contextual situations. The only thing that helped 2012 Cabrera accumulate more RBI is that he had more runners on base closer to home when he got there. He played no role in getting those runners on base or closer to home, but he was able to more easily drive them and get credit in the RBI column. This is also isn’t as simple as converting RBI into a simple rate stat because where the baserunners are located and how many outs there are matter too, not just the number of situations.
This is the first step in a longer conversation but the takeaway point here is that RBI is stat that depends a lot on the team around you. Cabrera can’t control how many runners get on base and where they are on the bases when he comes to the plate. We shouldn’t judge a player for where he hits in the lineup and how the rest of the hitters on the team perform. It’s important to hit well with runners on base. I personally think we overvalue that skill over the ability to hit well in general, but I’ll leave that alone for now. Can we at least agree that a player who hits better with runners in scoring position and overall should be considered the better hitter? If that’s the case, then RBI is misleading you as an individual statistic. It’s that simple. I’m going to start laying out more evidence over the next couple weeks so stay tuned, but I’ll leave with this.
RBI is a descriptive statistic. It tells you who was at bat when a run scored and is critical to keeping track of a game in the box score. That’s why it was invented in the 1920s. You want to be able to scan a scorecard and recreate the game. RBI has a place in baseball, but only as a descriptive measure, not as a measure of value. Yet the RBI is still critical to MVP voting, arbitration salaries, and overall financial health of the players. They are judged by a statistic that doesn’t measure individual value and it is bad for their psyches. Players should focus on stats they can control and RBI isn’t one of those. It doesn’t measure individual value because as you can seen, in this very controlled example, RBI is misleading you.

[…] Yesterday we took a look at a case study in RBI to help explain why it’s a misleading statistic. The idea here is that RBI is very dependent on your team and the context you’re in. Two identical hitters will accumulate much different RBI totals depending on how many runners on base ahead of them and which bases those runners occupy. You can read all about it here. […]
[…] I’d like to take another look at RBI as a statistic. Recently, I’ve shown you why RBI can be misleading when comparing two players’ value and why having a lot of RBI doesn’t necessarily mean you had a good season. To catch up on […]
[…] How RBI can mislead you when comparing two players […]
Somehow, I feel like RBI supporters will argue that Cabrera was a more “mature” hitter in ’12 having been through his experiences in ’11, and that is why the total is higher.
What can you do?