Ballpark Review: Camden Yards
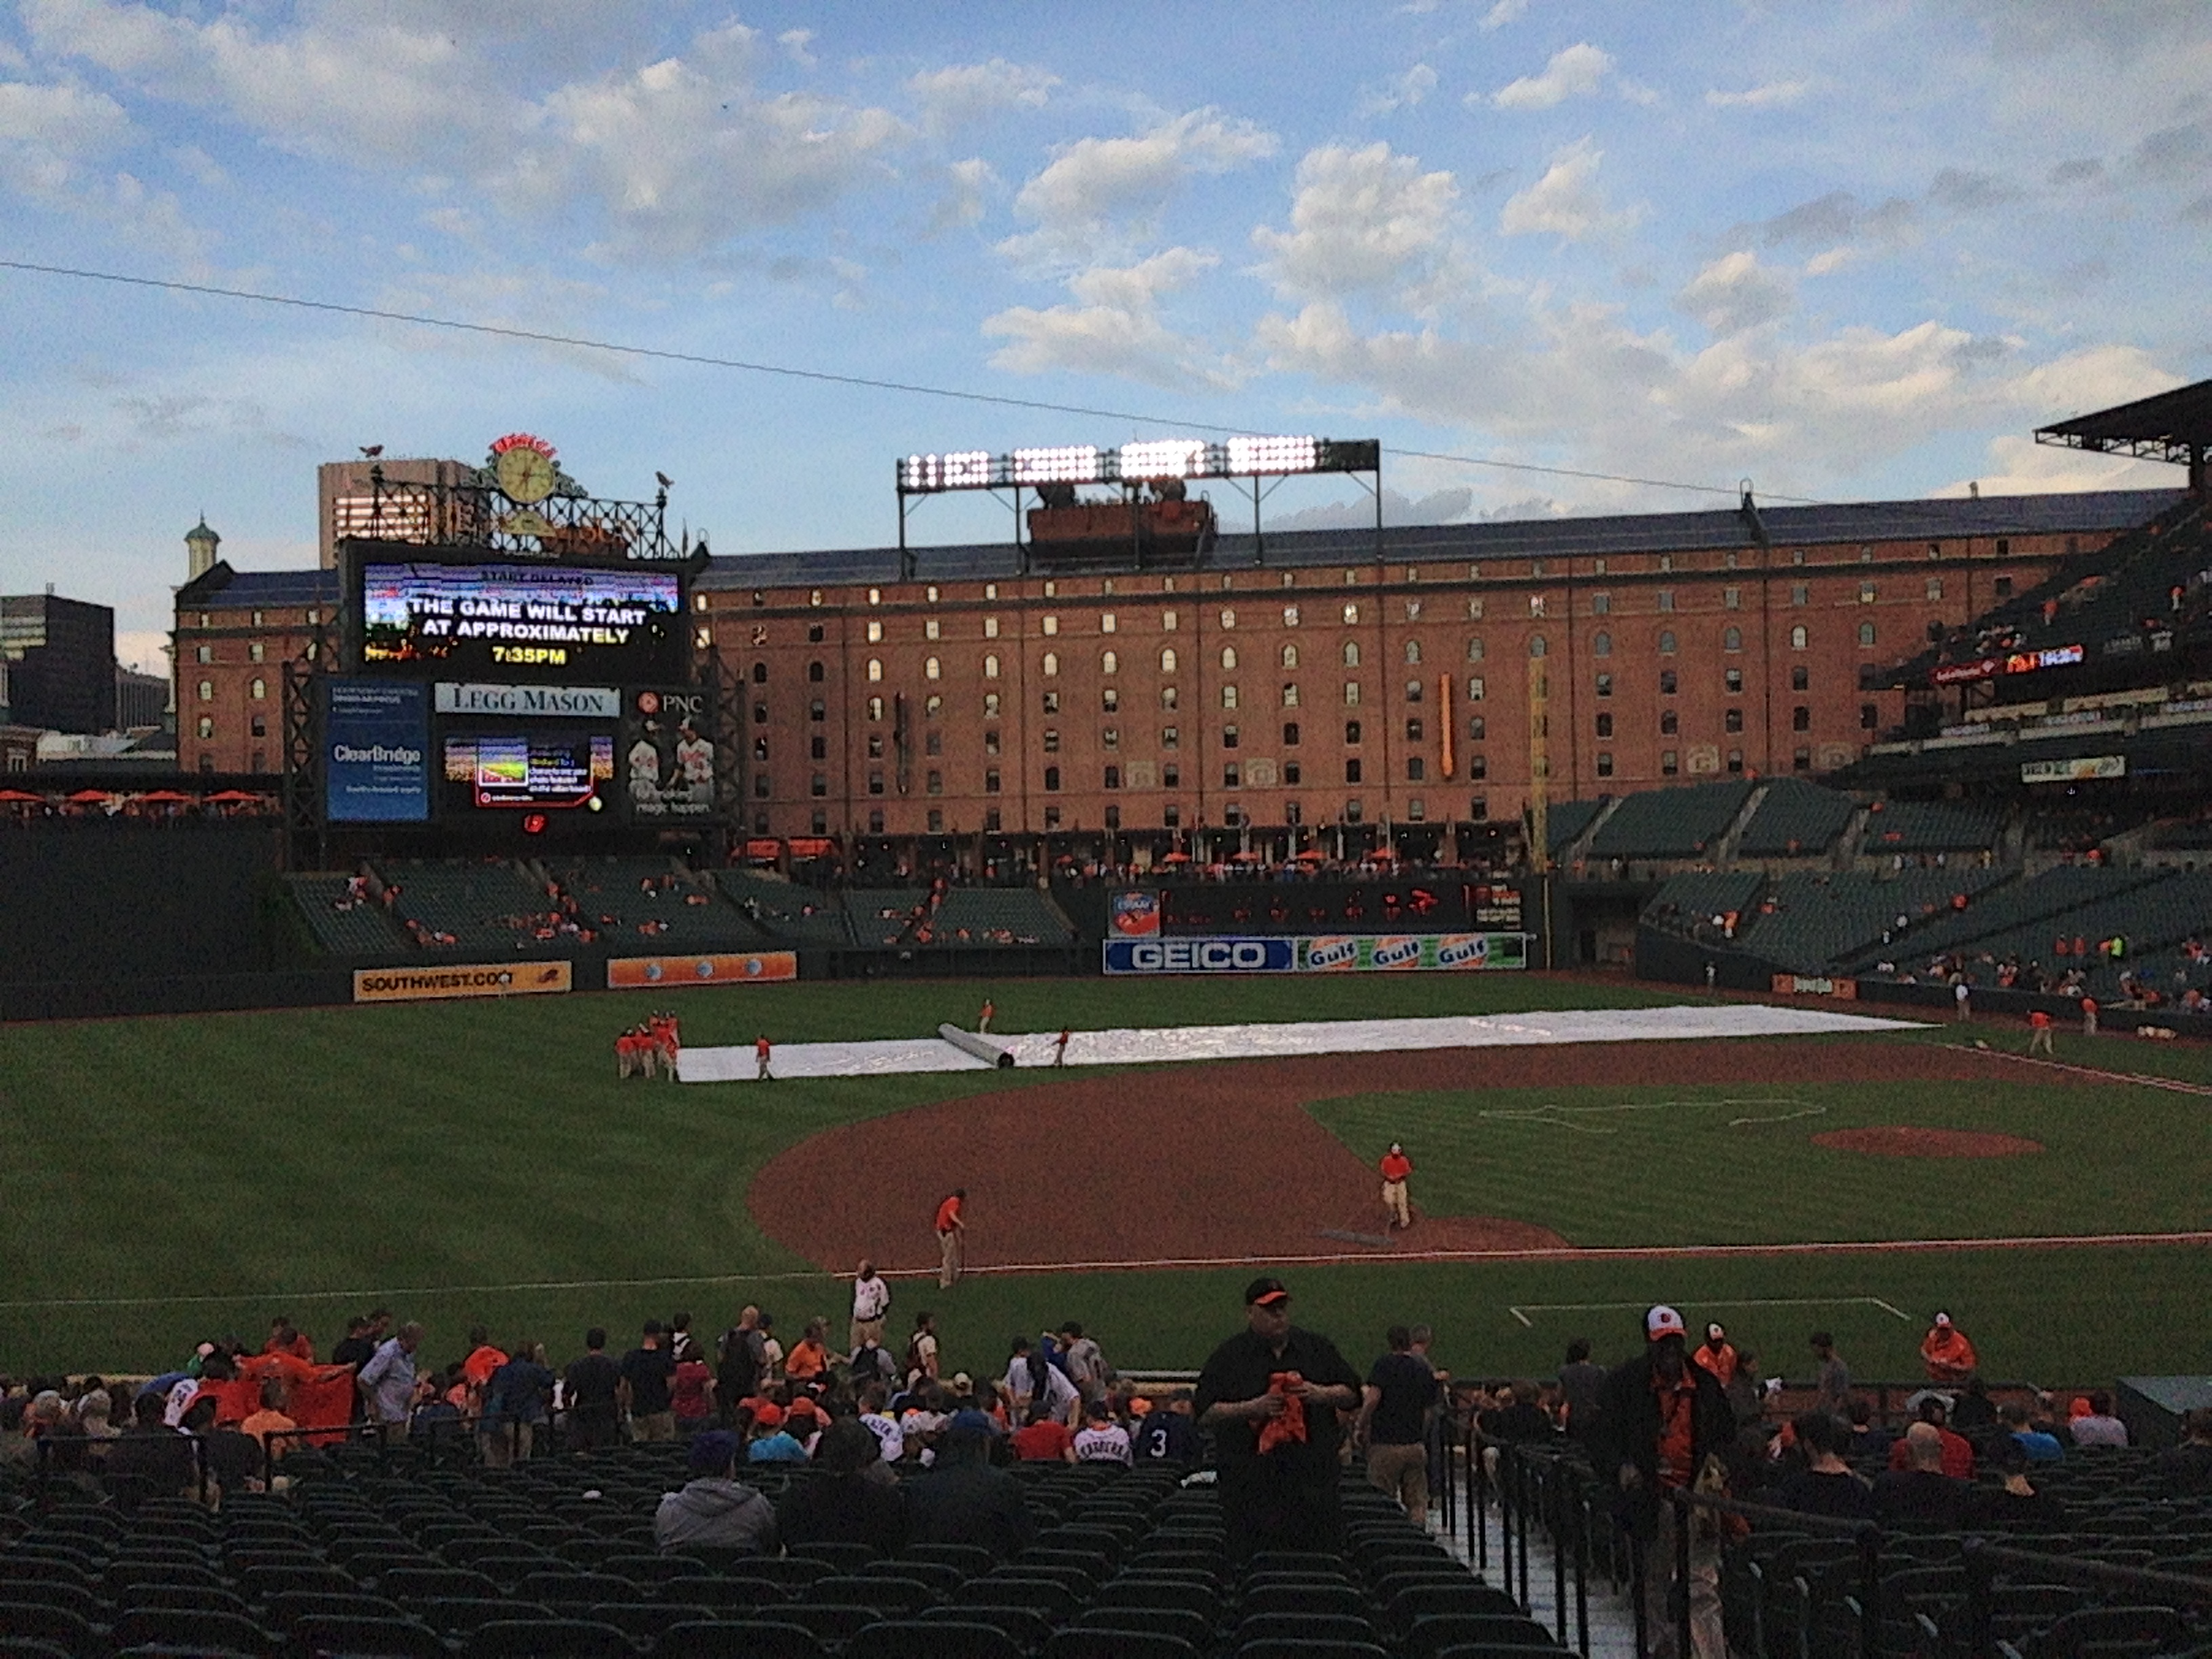
Home of the Baltimore Orioles
Baltimore, MD
It’s been almost a year since I reviewed a ballpark for this series, but there’s a very good reason. I hadn’t been to an MLB stadium in a very long time. Sure, I’ve been to a handful about which I haven’t written, but I didn’t want to write about Progressive Field when I hadn’t been there in five years. Well, problem solved. I just spent three days at Oriole Park at Camden Yards.
Camden Yards is often thought of as the first of the new “old-style” parks that open out into a city and provide the comforts of modern life. U.S Cellular Field this is not. Part of Camden’s charm, in my opinion, is it’s cozy dimensions. While the concourses are spacious and only crowded when busloads of children are dumped into them, the seating is very close to the action. I sat in the last few rows of the lower deck all three games and was never very far from the action. Some parks have lots of foul territory, which Camden does not, but they are also built on a very gentle incline to maximize seating, meaning that you can end up quite a ways from the action. Not so in Baltimore.
The stadium features a three tiered design with the lower deck also divided into two parts. I sat in the rear sections of the lower deck and the only real problem was that the upper deck hangs over pretty significantly, obstructing some of the main scoreboard and high fly balls. You still have a great view of the pitcher, plate, and all of the fielders, but you can lose things from time to time. Pretty much everywhere else in the park avoids this type of issue. Overall, as long as you know what you’re getting, the sight-lines are quite good. It actually reminds me a lot of Great American in Cincinnati as far as the shape of the thing is concerned.
The food is pretty standard with the unique options being crabcake-seafood offerings and the Boog’s sandwich station out in right field. The basic offerings were good, but unspectacular and are priced pretty much in line with the average major league park. Ticket prices were reasonable all the way around, although I picked a Mon-Wed series in May, so I can’t be sure that it’s a typical experience.
The fans were a nice mix of enthusiastic and knowledgeable, and the staff was pretty attentive and welcoming as far as those things go. In a basic sense, Camden Yards is a very standard MLB stadium. There isn’t amazing food or really impressive amenities, but from a strict game-viewing perspective, it’s quite something. It’s cozy without being crammed and looks the part of a charming stadium in the heart of an old city.
I’ve been to 8 active MLB parks (Comerica, Wrigley, US Cellular, GABP, Progressive, PNC, Nationals, Camden) and two defunct ones (Tiger Stadium and Sun Life), and I would say that Camden comes out second behind PNC. I always excluded Comerica because I can’t be objective in that case. OPACY is great place to see a game, and even better when your team sweeps the O’s.
Stadium Rater (scale 1-10): 9
Wins Above Replacement (WAR) Calculator

One of the missions of New English D is to make sabermetrics more easily digestible. To that end, we have an extensive Stat Primer series that explains a lot of important concepts and stats. One of the most controversial, but important stats out there is Wins Above Replacement (WAR). I wrote about WAR over a year ago here, so feel free to read that as a primer for what WAR is trying to measure. I also apologize if it’s not perfectly written, as it was one of the first pieces I put out there and was still working to develop some expert internet-writing skills.
Calculate FIP, xFIP, and wOBA too!
That said, people often complain that WAR is really too complicated and it doesn’t make sense to them. Well, I’m going to give you the tools to calculate WAR right here and right now. I will make two quick points.
- This is an approximation of the FanGraphs version of WAR for position players, not pitchers.
- This is not perfect, mostly in the sense that it does not account for park factors. If your fake player plays in a hitter friendly park, this number will be too high. If they play in a pitcher friendly park, it will be too low. Not a huge amount, but some. This calculator isn’t perfect because in order for it to be perfect, I would have to ask you to input way more information and I would have to learn how to be a much better coder.
- This doesn’t account for league, which makes a small difference and it doesn’t break down by number of games played at different positions if your player plays more than one.
Here is how it works. Fill in the data from Cell B2 to Cell B11 with the basic statistics of your player. In Cell B17, type the number that corresponds with their position in the “H” column. In Cell B18, type the number of runs above or below average you player is on defense. A perfectly average defender at the position in question will be zero. Remember these are run values and generally range from -10 to +10. Do the same thing with baserunning runs in Cell B19. If you want more information on any of these numbers, visit our Stat Primer page for details.
If you’ve done everything correctly, you should have a WAR value in B20. Remember, this doesn’t adjust for park or league, so it won’t be perfect, but it should give you a pretty nice idea if you’re just looking to play around with some numbers. Essentially, this is a “what if WAR machine.”
Right now, these numbers reflect the 2013 regular season. Feel free to play around with the numbers in the blue box if you wish to calculate based on different seasons. All of the numbers can be found on this FG page with the exception of Lg R and Lg PA, which are simply the total number of runs and plate appearances in the league that season.
Enjoy and feel free to post if you catch any mistakes. This one was much harder to write than FIP, xFIP, and wOBA.
SOEFA Sunday: Reliever Rankings Update (September 29, 2013)
You’ll recall earlier this year we introduced our very own reliever rankings called SOEFA, which you can read about in detail here. For a brief refresher, it combines inherited runner strand rate, expected OBP against, ERA-, and FIP- into a deviation from league average. This is a measure of performance, not necessarily ability, and seeks to provide a single number to judge relievers that balances context neutral and context dependent numbers. Certain pitchers, such as Craig Kimbrel, cannot be credited for stranding runners because they are never put into those situations. They are not penalized either, however. Additionally, SOEFA penalizes pitchers like Joe Nathan and Mariano Rivera who have done a very poor job when they have been asked to strand runners this season despite great numbers in other categories.
Zero is average, and will generally range between -2.5 to 2.5 with -1 to 1 being most common. This includes all pitchers who have thrown at least 20 IP in relief as of this morning, so the average score on this list is closer to 0.08 and the inherited runner threshold has been increased from 5 to 8. SOEFA is a rate stat not a counting stat. Should you wish to know the SOEFA for any other reliever, or on a day that isn’t Sunday, hit us on Twitter or in the comments section. Also, as we look to improve SOEFA for next season, let us know if you have any suggestions! Hope you enjoyed this project and look for some analysis of its success this offseason.
| Rank | Name | Team | SOEFA |
| 1 | Sergio Santos | Blue Jays | 1.09 |
| 2 | Koji Uehara | Red Sox | 0.97 |
| 3 | Neal Cotts | Rangers | 0.95 |
| 4 | Greg Holland | Royals | 0.93 |
| 5 | Kenley Jansen | Dodgers | 0.92 |
| 6 | Drew Smyly | Tigers | 0.82 |
| 7 | Louis Coleman | Royals | 0.82 |
| 8 | Kevin Siegrist | Cardinals | 0.80 |
| 9 | Nick Vincent | Padres | 0.80 |
| 10 | Jesse Crain | White Sox | 0.78 |
| 11 | Mark Melancon | Pirates | 0.77 |
| 12 | Craig Kimbrel | Braves | 0.76 |
| 13 | Javier Lopez | Giants | 0.73 |
| 14 | Joaquin Benoit | Tigers | 0.71 |
| 15 | Sean Doolittle | Athletics | 0.68 |
| 16 | Chris Withrow | Dodgers | 0.67 |
| 17 | Luke Hochevar | Royals | 0.67 |
| 18 | Trevor Rosenthal | Cardinals | 0.62 |
| 19 | Jose Veras | – – – | 0.60 |
| 20 | Jason Grilli | Pirates | 0.58 |
| 21 | Alex Torres | Rays | 0.57 |
| 22 | Casey Janssen | Blue Jays | 0.57 |
| 23 | Sam LeCure | Reds | 0.57 |
| 24 | Tanner Roark | Nationals | 0.57 |
| 25 | Carlos Torres | Mets | 0.56 |
| 26 | Glen Perkins | Twins | 0.55 |
| 27 | Jake Diekman | Phillies | 0.55 |
| 28 | Tommy Hunter | Orioles | 0.54 |
| 29 | Will Smith | Royals | 0.53 |
| 30 | Jim Henderson | Brewers | 0.52 |
| 31 | Randy Choate | Cardinals | 0.52 |
| 32 | Dan Otero | Athletics | 0.51 |
| 33 | Carlos Villanueva | Cubs | 0.50 |
| 34 | Casey Fien | Twins | 0.50 |
| 35 | Antonio Bastardo | Phillies | 0.49 |
| 36 | Brian Matusz | Orioles | 0.49 |
| 37 | Juan Perez | Blue Jays | 0.49 |
| 38 | Alex Wood | Braves | 0.48 |
| 39 | Josh Collmenter | Diamondbacks | 0.48 |
| 40 | Seth Maness | Cardinals | 0.48 |
| 41 | Brett Cecil | Blue Jays | 0.47 |
| 42 | Chad Qualls | Marlins | 0.47 |
| 43 | Jordan Walden | Braves | 0.47 |
| 44 | Kevin Gausman | Orioles | 0.47 |
| 45 | Tanner Scheppers | Rangers | 0.47 |
| 46 | Andrew Miller | Red Sox | 0.46 |
| 47 | Brandon Kintzler | Brewers | 0.46 |
| 48 | Paco Rodriguez | Dodgers | 0.46 |
| 49 | Manny Parra | Reds | 0.45 |
| 50 | Mariano Rivera | Yankees | 0.45 |
| 51 | Bobby Parnell | Mets | 0.44 |
| 52 | Edward Mujica | Cardinals | 0.44 |
| 53 | J.P. Howell | Dodgers | 0.43 |
| 54 | Jason Frasor | Rangers | 0.43 |
| 55 | Joe Thatcher | – – – | 0.43 |
| 56 | Steve Cishek | Marlins | 0.43 |
| 57 | David Carpenter | Braves | 0.42 |
| 58 | Matt Reynolds | Diamondbacks | 0.42 |
| 59 | Ernesto Frieri | Angels | 0.40 |
| 60 | Jean Machi | Giants | 0.40 |
| 61 | Tony Watson | Pirates | 0.40 |
| 62 | Sergio Romo | Giants | 0.39 |
| 63 | Shawn Kelley | Yankees | 0.39 |
| 64 | Aroldis Chapman | Reds | 0.38 |
| 65 | Blake Parker | Cubs | 0.38 |
| 66 | Luis Avilan | Braves | 0.38 |
| 67 | Vin Mazzaro | Pirates | 0.38 |
| 68 | Junichi Tazawa | Red Sox | 0.37 |
| 69 | Will Harris | Diamondbacks | 0.36 |
| 70 | Brad Ziegler | Diamondbacks | 0.34 |
| 71 | Jonathan Papelbon | Phillies | 0.34 |
| 72 | Luke Gregerson | Padres | 0.34 |
| 73 | Robbie Ross | Rangers | 0.34 |
| 74 | Joe Smith | Indians | 0.33 |
| 75 | Darren O’Day | Orioles | 0.32 |
| 76 | Joel Peralta | Rays | 0.32 |
| 77 | Ross Ohlendorf | Nationals | 0.32 |
| 78 | Caleb Thielbar | Twins | 0.31 |
| 79 | Francisco Rodriguez | – – – | 0.31 |
| 80 | Jerome Williams | Angels | 0.31 |
| 81 | Tom Gorzelanny | Brewers | 0.31 |
| 82 | Tyler Clippard | Nationals | 0.31 |
| 83 | Kevin Chapman | Astros | 0.30 |
| 84 | Matt Belisle | Rockies | 0.29 |
| 85 | Cody Allen | Indians | 0.28 |
| 86 | Nate Jones | White Sox | 0.28 |
| 87 | Craig Breslow | Red Sox | 0.27 |
| 88 | Craig Stammen | Nationals | 0.27 |
| 89 | David Robertson | Yankees | 0.27 |
| 90 | Josh Outman | Rockies | 0.27 |
| 91 | Santiago Casilla | Giants | 0.27 |
| 92 | Alfredo Simon | Reds | 0.26 |
| 93 | David Huff | – – – | 0.26 |
| 94 | Aaron Loup | Blue Jays | 0.25 |
| 95 | Boone Logan | Yankees | 0.25 |
| 96 | Bryan Shaw | Indians | 0.25 |
| 97 | Grant Balfour | Athletics | 0.25 |
| 98 | Luis Ayala | – – – | 0.25 |
| 99 | Jared Burton | Twins | 0.24 |
| 100 | Luke Putkonen | Tigers | 0.24 |
| 101 | Anthony Varvaro | Braves | 0.23 |
| 102 | Fernando Rodney | Rays | 0.23 |
| 103 | Rex Brothers | Rockies | 0.23 |
| 104 | Chad Gaudin | Giants | 0.22 |
| 105 | Danny Farquhar | Mariners | 0.22 |
| 106 | Joe Nathan | Rangers | 0.22 |
| 107 | Mike Dunn | Marlins | 0.22 |
| 108 | Scott Downs | – – – | 0.22 |
| 109 | Tim Collins | Royals | 0.22 |
| 110 | Addison Reed | White Sox | 0.21 |
| 111 | J.J. Putz | Diamondbacks | 0.21 |
| 112 | Neil Wagner | Blue Jays | 0.20 |
| 113 | Adam Ottavino | Rockies | 0.18 |
| 114 | Dan Jennings | Marlins | 0.18 |
| 115 | Josh Zeid | Astros | 0.18 |
| 116 | Steve Delabar | Blue Jays | 0.18 |
| 117 | Dale Thayer | Padres | 0.17 |
| 118 | Rafael Betancourt | Rockies | 0.17 |
| 119 | Preston Claiborne | Yankees | 0.16 |
| 120 | Donovan Hand | Brewers | 0.15 |
| 121 | Dustin McGowan | Blue Jays | 0.15 |
| 122 | LaTroy Hawkins | Mets | 0.15 |
| 123 | Rafael Soriano | Nationals | 0.15 |
| 124 | Brad Boxberger | Padres | 0.14 |
| 125 | Charlie Furbush | Mariners | 0.14 |
| 126 | Jim Johnson | Orioles | 0.14 |
| 127 | Justin Wilson | Pirates | 0.14 |
| 128 | Bruce Rondon | Tigers | 0.13 |
| 129 | Gonzalez Germen | Mets | 0.13 |
| 130 | Huston Street | Padres | 0.12 |
| 131 | Jamey Wright | Rays | 0.12 |
| 132 | Logan Ondrusek | Reds | 0.12 |
| 133 | Ryan Webb | Marlins | 0.12 |
| 134 | Anthony Swarzak | Twins | 0.11 |
| 135 | Scott Rice | Mets | 0.11 |
| 136 | Tim Stauffer | Padres | 0.11 |
| 137 | Matt Lindstrom | White Sox | 0.10 |
| 138 | Burke Badenhop | Brewers | 0.09 |
| 139 | Darren Oliver | Blue Jays | 0.09 |
| 140 | Oliver Perez | Mariners | 0.09 |
| 141 | Wilton Lopez | Rockies | 0.09 |
| 142 | Rob Scahill | Rockies | 0.08 |
| 143 | Andrew Bailey | Red Sox | 0.07 |
| 144 | Jesse Chavez | Athletics | 0.07 |
| 145 | Kevin Gregg | Cubs | 0.07 |
| 146 | Sandy Rosario | Giants | 0.07 |
| 147 | Brian Duensing | Twins | 0.06 |
| 148 | Heath Bell | Diamondbacks | 0.06 |
| 149 | Jeanmar Gomez | Pirates | 0.06 |
| 150 | Alfredo Figaro | Brewers | 0.05 |
| 151 | Carlos Martinez | Cardinals | 0.05 |
| 152 | Joe Kelly | Cardinals | 0.05 |
| 153 | Matt Thornton | – – – | 0.05 |
| 154 | Ryan Cook | Athletics | 0.05 |
| 155 | Yoervis Medina | Mariners | 0.05 |
| 156 | Kelvin Herrera | Royals | 0.04 |
| 157 | Tyson Ross | Padres | 0.03 |
| 158 | Fernando Abad | Nationals | 0.02 |
| 159 | Jerry Blevins | Athletics | 0.02 |
| 160 | Dane de la Rosa | Angels | 0.01 |
| 161 | David Aardsma | Mets | 0.01 |
| 162 | J.J. Hoover | Reds | 0.01 |
| 163 | Matt Guerrier | – – – | 0.01 |
| 164 | Brett Anderson | Athletics | 0.00 |
| 165 | Donnie Veal | White Sox | 0.00 |
| 166 | Ross Wolf | Rangers | 0.00 |
| 167 | Joe Ortiz | Rangers | -0.01 |
| 168 | Josh Edgin | Mets | -0.01 |
| 169 | Edgmer Escalona | Rockies | -0.02 |
| 170 | J.C. Gutierrez | – – – | -0.02 |
| 171 | Manuel Corpas | Rockies | -0.02 |
| 172 | Marc Rzepczynski | – – – | -0.03 |
| 173 | Pat Neshek | Athletics | -0.03 |
| 174 | Cesar Ramos | Rays | -0.04 |
| 175 | Kevin Jepsen | Angels | -0.04 |
| 176 | James Russell | Cubs | -0.05 |
| 177 | Tyler Thornburg | Brewers | -0.05 |
| 178 | Aaron Crow | Royals | -0.06 |
| 179 | Darin Downs | Tigers | -0.06 |
| 180 | Josh Fields | Astros | -0.06 |
| 181 | Wesley Wright | – – – | -0.06 |
| 182 | Evan Reed | Tigers | -0.07 |
| 183 | Ryan Pressly | Twins | -0.07 |
| 184 | Carter Capps | Mariners | -0.08 |
| 185 | Evan Scribner | Athletics | -0.08 |
| 186 | Brandon Workman | Red Sox | -0.09 |
| 187 | Jake McGee | Rays | -0.09 |
| 188 | Matt Albers | Indians | -0.09 |
| 189 | Fernando Salas | Cardinals | -0.10 |
| 190 | Michael Kohn | Angels | -0.10 |
| 191 | Drew Storen | Nationals | -0.11 |
| 192 | Troy Patton | Orioles | -0.12 |
| 193 | David Hernandez | Diamondbacks | -0.13 |
| 194 | Pedro Strop | – – – | -0.13 |
| 195 | A.J. Ramos | Marlins | -0.14 |
| 196 | Al Alburquerque | Tigers | -0.15 |
| 197 | Bryan Morris | Pirates | -0.15 |
| 198 | David Purcey | White Sox | -0.15 |
| 199 | Ronald Belisario | Dodgers | -0.15 |
| 200 | Adam Warren | Yankees | -0.16 |
| 201 | Joakim Soria | Rangers | -0.16 |
| 202 | Jake Dunning | Giants | -0.17 |
| 203 | Jared Hughes | Pirates | -0.17 |
| 204 | Chaz Roe | Diamondbacks | -0.18 |
| 205 | Drake Britton | Red Sox | -0.18 |
| 206 | Jose Mijares | Giants | -0.18 |
| 207 | Cory Gearrin | Braves | -0.19 |
| 208 | Raul Valdes | Phillies | -0.19 |
| 209 | Zach Duke | – – – | -0.19 |
| 210 | Brad Brach | Padres | -0.20 |
| 211 | Justin De Fratus | Phillies | -0.20 |
| 212 | Ramon Troncoso | White Sox | -0.22 |
| 213 | Rob Wooten | Brewers | -0.23 |
| 214 | Chris Perez | Indians | -0.24 |
| 215 | Jonathan Broxton | Reds | -0.24 |
| 216 | Tom Wilhelmsen | Mariners | -0.24 |
| 217 | Kyle Farnsworth | – – – | -0.25 |
| 218 | Mike Adams | Phillies | -0.26 |
| 219 | Philip Humber | Astros | -0.26 |
| 220 | Scott Atchison | Mets | -0.26 |
| 221 | Blake Beavan | Mariners | -0.27 |
| 222 | Rich Hill | Indians | -0.27 |
| 223 | Vinnie Pestano | Indians | -0.27 |
| 224 | Franklin Morales | Red Sox | -0.28 |
| 225 | George Kontos | Giants | -0.29 |
| 226 | Lucas Luetge | Mariners | -0.30 |
| 227 | Nick Hagadone | Indians | -0.30 |
| 228 | Rhiner Cruz | Astros | -0.30 |
| 229 | Tony Sipp | Diamondbacks | -0.30 |
| 230 | Brad Lincoln | Blue Jays | -0.31 |
| 231 | Carlos Marmol | – – – | -0.31 |
| 232 | Garrett Richards | Angels | -0.31 |
| 233 | Phil Coke | Tigers | -0.31 |
| 234 | John Axford | – – – | -0.32 |
| 235 | Michael Bowden | Cubs | -0.33 |
| 236 | T.J. McFarland | Orioles | -0.35 |
| 237 | Ryan Mattheus | Nationals | -0.36 |
| 238 | Josh Roenicke | Twins | -0.37 |
| 239 | Dylan Axelrod | White Sox | -0.38 |
| 240 | Paul Clemens | Astros | -0.38 |
| 241 | Guillermo Moscoso | Giants | -0.39 |
| 242 | Kameron Loe | – – – | -0.41 |
| 243 | Travis Blackley | – – – | -0.41 |
| 244 | Clayton Mortensen | Red Sox | -0.43 |
| 245 | Esmil Rogers | Blue Jays | -0.43 |
| 246 | Josh Lueke | Rays | -0.44 |
| 247 | Alex Wilson | Red Sox | -0.46 |
| 248 | Brandon Lyon | Mets | -0.49 |
| 249 | Michael Gonzalez | Brewers | -0.50 |
| 250 | Brandon Maurer | Mariners | -0.51 |
| 251 | Greg Burke | Mets | -0.52 |
| 252 | Lucas Harrell | Astros | -0.52 |
| 253 | Luis Garcia | Phillies | -0.53 |
| 254 | Bruce Chen | Royals | -0.54 |
| 255 | Hector Rondon | Cubs | -0.57 |
| 256 | Jeremy Horst | Phillies | -0.59 |
| 257 | Jose Cisnero | Astros | -0.59 |
| 258 | Joba Chamberlain | Yankees | -0.62 |
| 259 | Dallas Keuchel | Astros | -0.64 |
| 260 | Hector Ambriz | Astros | -0.64 |
| 261 | Jeremy Affeldt | Giants | -0.67 |
| 262 | Cory Rasmus | – – – | -0.69 |
| 263 | Ian Krol | Nationals | -0.69 |
| 264 | Henry Rodriguez | – – – | -0.71 |
| 265 | Michael Kirkman | Rangers | -0.75 |
| 266 | Brandon League | Dodgers | -0.76 |
| 267 | J.C. Ramirez | Phillies | -0.90 |
| 268 | Anthony Bass | Padres | -0.94 |
| 269 | Shawn Camp | Cubs | -1.04 |
| 270 | Mitchell Boggs | – – – | -1.37 |
| 271 | Curtis Partch | Reds | -1.43 |
Dynamic Standings Projection (September 26, 2013)
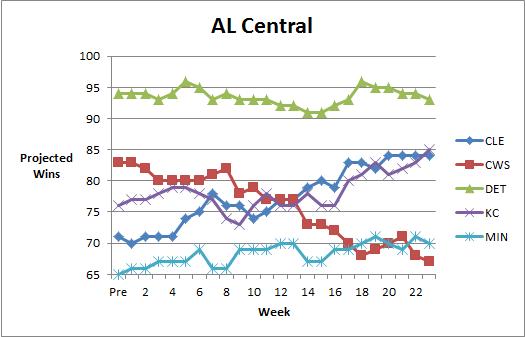
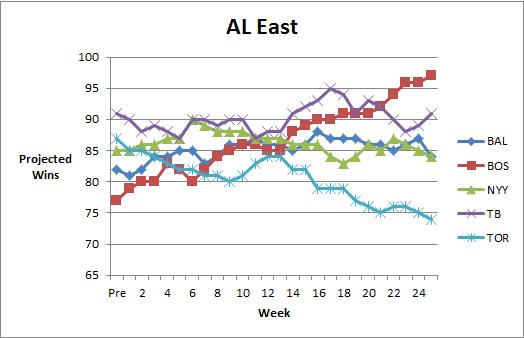
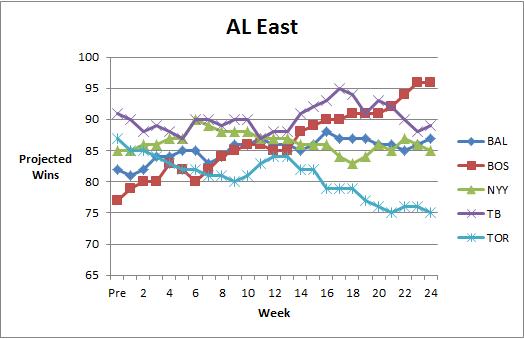
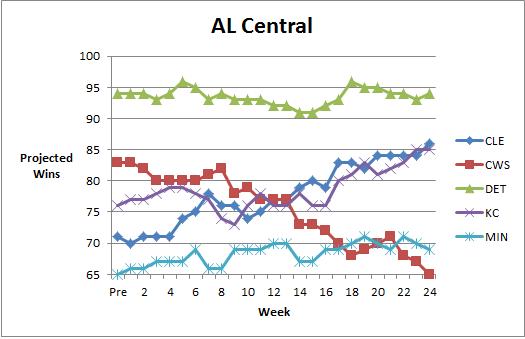
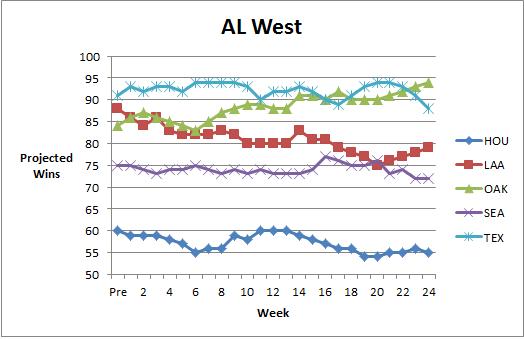
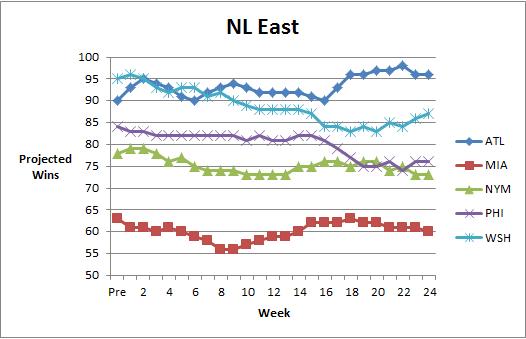
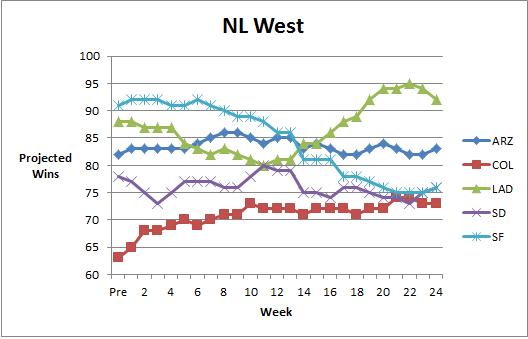
In case you missed it, in April we launched our Dynamic Standings Projection feature on New English D. A full explanation of the methodology can be found here or by clicking the tab at the top of the page. This project seeks to provide a reasoned and cautious approach to updating our beliefs about the baseball future. You can find a summarization of the original projections here. You’ll notice a column on the far right that indicates the difference in projected wins from the preseason prediction. Positive numbers mean teams are now projected to win more games and negative numbers mean a team is now projected to win fewer games. You’ll notice a series of graphs below the standings section that track how the projections have evolved over the course of the year.
This Dynamic Standings Projection is updated through the September 25th games. Note that DSP posts have been moved to Thursday accommodate something that won’t interest you.
| 26-Sep | W | L | PreDiff | |
| BOS | 97 | 65 | 0.599 | 20 |
| TB | 91 | 71 | 0.562 | 0 |
| NYY | 84 | 78 | 0.519 | -1 |
| BAL | 84 | 78 | 0.519 | 2 |
| TOR | 74 | 88 | 0.457 | -13 |
| W | L | PreDiff | ||
| DET | 95 | 67 | 0.586 | 1 |
| CLE | 90 | 72 | 0.556 | 19 |
| KC | 85 | 77 | 0.525 | 9 |
| MIN | 66 | 96 | 0.407 | 1 |
| CWS | 64 | 98 | 0.395 | -19 |
| W | L | PreDiff | ||
| OAK | 96 | 66 | 0.593 | 12 |
| TEX | 89 | 73 | 0.549 | -2 |
| LAA | 80 | 82 | 0.494 | -8 |
| SEA | 71 | 91 | 0.438 | -4 |
| HOU | 52 | 110 | 0.321 | -8 |
| W | L | PreDiff | ||
| ATL | 95 | 67 | 0.586 | 5 |
| WSH | 86 | 76 | 0.531 | -9 |
| NYM | 75 | 87 | 0.463 | -3 |
| PHI | 74 | 88 | 0.457 | -10 |
| MIA | 60 | 102 | 0.370 | -3 |
| W | L | PreDiff | ||
| STL | 96 | 66 | 0.593 | 8 |
| PIT | 93 | 69 | 0.574 | 11 |
| CIN | 92 | 70 | 0.568 | 0 |
| MIL | 73 | 89 | 0.451 | -6 |
| CHC | 67 | 95 | 0.414 | -1 |
| W | L | PreDiff | ||
| LAD | 93 | 69 | 0.574 | 5 |
| ARZ | 82 | 80 | 0.506 | 0 |
| SD | 76 | 86 | 0.469 | -2 |
| SF | 75 | 87 | 0.463 | -16 |
| COL | 73 | 89 | 0.451 | 10 |


SOEFA Sunday: Reliever Rankings Update (September 22, 2013)
You’ll recall earlier this year we introduced our very own reliever rankings called SOEFA, which you can read about in detail here. For a brief refresher, it combines inherited runner strand rate, expected OBP against, ERA-, and FIP- into a deviation from league average. This is a measure of performance, not necessarily ability, and seeks to provide a single number to judge relievers that balances context neutral and context dependent numbers. Certain pitchers, such as Craig Kimbrel, cannot be credited for stranding runners because they are never put into those situations. They are not penalized either, however. Additionally, SOEFA penalizes pitchers like Joe Nathan and Mariano Rivera who have done a very poor job when they have been asked to strand runners this season despite great numbers in other categories.
Zero is average, and will generally range between -2.5 to 2.5 with -1 to 1 being most common. This includes all pitchers who have thrown at least 20 IP in relief as of this morning, so the average score on this list is closer to 0.09 and the inherited runner threshold has been increased from 5 to 8. SOEFA is a rate stat not a counting stat. Should you wish to know the SOEFA for any other reliever, or on a day that isn’t Sunday, hit us on Twitter or in the comments section. Also, as we look to improve SOEFA for next season, let us know if you have any suggestions!
| Rank | Player | Team | SOEFA |
| 1 | Sergio Santos | Blue Jays | 1.03 |
| 2 | Koji Uehara | Red Sox | 0.97 |
| 3 | Greg Holland | Royals | 0.94 |
| 4 | Neal Cotts | Rangers | 0.94 |
| 5 | Kenley Jansen | Dodgers | 0.89 |
| 6 | Louis Coleman | Royals | 0.89 |
| 7 | Kevin Siegrist | Cardinals | 0.80 |
| 8 | Drew Smyly | Tigers | 0.79 |
| 9 | Javier Lopez | Giants | 0.79 |
| 10 | Will Smith | Royals | 0.78 |
| 11 | Jesse Crain | White Sox | 0.78 |
| 12 | Mark Melancon | Pirates | 0.78 |
| 13 | Luke Hochevar | Royals | 0.72 |
| 14 | Joaquin Benoit | Tigers | 0.72 |
| 15 | Craig Kimbrel | Braves | 0.70 |
| 16 | Nick Vincent | Padres | 0.68 |
| 17 | Sean Doolittle | Athletics | 0.67 |
| 18 | Chris Withrow | Dodgers | 0.66 |
| 19 | Jose Veras | – – – | 0.62 |
| 20 | Brian Matusz | Orioles | 0.59 |
| 21 | Jason Grilli | Pirates | 0.59 |
| 22 | Tommy Hunter | Orioles | 0.58 |
| 23 | Tanner Roark | Nationals | 0.57 |
| 24 | Trevor Rosenthal | Cardinals | 0.57 |
| 25 | Jake Diekman | Phillies | 0.57 |
| 26 | David Huff | – – – | 0.57 |
| 27 | Glen Perkins | Twins | 0.56 |
| 28 | Sam LeCure | Reds | 0.56 |
| 29 | Casey Janssen | Blue Jays | 0.56 |
| 30 | Carlos Torres | Mets | 0.56 |
| 31 | Casey Fien | Twins | 0.55 |
| 32 | Josh Collmenter | Diamondbacks | 0.54 |
| 33 | Jim Henderson | Brewers | 0.53 |
| 34 | Alex Torres | Rays | 0.52 |
| 35 | Edward Mujica | Cardinals | 0.51 |
| 36 | Randy Choate | Cardinals | 0.51 |
| 37 | Antonio Bastardo | Phillies | 0.50 |
| 38 | Paco Rodriguez | Dodgers | 0.49 |
| 39 | Dan Otero | Athletics | 0.49 |
| 40 | Juan Perez | Blue Jays | 0.49 |
| 41 | Jordan Walden | Braves | 0.48 |
| 42 | Brett Cecil | Blue Jays | 0.47 |
| 43 | Andrew Miller | Red Sox | 0.47 |
| 44 | Seth Maness | Cardinals | 0.47 |
| 45 | Chad Qualls | Marlins | 0.45 |
| 46 | Bobby Parnell | Mets | 0.44 |
| 47 | Kevin Gausman | Orioles | 0.44 |
| 48 | Shawn Kelley | Yankees | 0.43 |
| 49 | Matt Reynolds | Diamondbacks | 0.42 |
| 50 | Brandon Kintzler | Brewers | 0.41 |
| 51 | Joe Thatcher | – – – | 0.41 |
| 52 | J.P. Howell | Dodgers | 0.40 |
| 53 | Vin Mazzaro | Pirates | 0.40 |
| 54 | Jonathan Papelbon | Phillies | 0.40 |
| 55 | Tanner Scheppers | Rangers | 0.40 |
| 56 | Carlos Villanueva | Cubs | 0.40 |
| 57 | Jason Frasor | Rangers | 0.39 |
| 58 | David Carpenter | Braves | 0.39 |
| 59 | Tony Watson | Pirates | 0.39 |
| 60 | Manny Parra | Reds | 0.39 |
| 61 | Junichi Tazawa | Red Sox | 0.39 |
| 62 | Steve Cishek | Marlins | 0.38 |
| 63 | Brad Ziegler | Diamondbacks | 0.38 |
| 64 | Ernesto Frieri | Angels | 0.38 |
| 65 | Darren O’Day | Orioles | 0.37 |
| 66 | Donovan Hand | Brewers | 0.37 |
| 67 | Luis Avilan | Braves | 0.37 |
| 68 | Sergio Romo | Giants | 0.36 |
| 69 | Aroldis Chapman | Reds | 0.35 |
| 70 | Francisco Rodriguez | – – – | 0.35 |
| 71 | Robbie Ross | Rangers | 0.33 |
| 72 | Blake Parker | Cubs | 0.33 |
| 73 | Ross Ohlendorf | Nationals | 0.32 |
| 74 | Will Harris | Diamondbacks | 0.32 |
| 75 | Josh Outman | Rockies | 0.32 |
| 76 | Jean Machi | Giants | 0.32 |
| 77 | Luke Gregerson | Padres | 0.32 |
| 78 | David Robertson | Yankees | 0.32 |
| 79 | Mariano Rivera | Yankees | 0.31 |
| 80 | Tom Gorzelanny | Brewers | 0.31 |
| 81 | Jerome Williams | Angels | 0.31 |
| 82 | Joel Peralta | Rays | 0.31 |
| 83 | Tim Collins | Royals | 0.30 |
| 84 | Tyler Clippard | Nationals | 0.30 |
| 85 | Aaron Loup | Blue Jays | 0.30 |
| 86 | Joe Smith | Indians | 0.29 |
| 87 | Dan Jennings | Marlins | 0.28 |
| 88 | Craig Stammen | Nationals | 0.28 |
| 89 | Anthony Varvaro | Braves | 0.27 |
| 90 | Scott Downs | – – – | 0.27 |
| 91 | Luis Ayala | – – – | 0.27 |
| 92 | Craig Breslow | Red Sox | 0.26 |
| 93 | Matt Belisle | Rockies | 0.26 |
| 94 | Addison Reed | White Sox | 0.26 |
| 95 | Nate Jones | White Sox | 0.26 |
| 96 | Cody Allen | Indians | 0.26 |
| 97 | Jamey Wright | Rays | 0.25 |
| 98 | Luke Putkonen | Tigers | 0.25 |
| 99 | Fernando Rodney | Rays | 0.24 |
| 100 | Grant Balfour | Athletics | 0.24 |
| 101 | Santiago Casilla | Giants | 0.23 |
| 102 | Alfredo Simon | Reds | 0.23 |
| 103 | Boone Logan | Yankees | 0.23 |
| 104 | Jared Burton | Twins | 0.22 |
| 105 | Chad Gaudin | Giants | 0.22 |
| 106 | Mike Dunn | Marlins | 0.21 |
| 107 | Neil Wagner | Blue Jays | 0.20 |
| 108 | Joakim Soria | Rangers | 0.20 |
| 109 | Charlie Furbush | Mariners | 0.20 |
| 110 | Caleb Thielbar | Twins | 0.20 |
| 111 | Rex Brothers | Rockies | 0.20 |
| 112 | Rob Scahill | Rockies | 0.19 |
| 113 | Danny Farquhar | Mariners | 0.19 |
| 114 | Preston Claiborne | Yankees | 0.19 |
| 115 | Bryan Shaw | Indians | 0.18 |
| 116 | J.C. Gutierrez | – – – | 0.18 |
| 117 | Rafael Betancourt | Rockies | 0.17 |
| 118 | Dale Thayer | Padres | 0.16 |
| 119 | Steve Delabar | Blue Jays | 0.16 |
| 120 | J.J. Putz | Diamondbacks | 0.14 |
| 121 | Rafael Soriano | Nationals | 0.13 |
| 122 | Matt Lindstrom | White Sox | 0.13 |
| 123 | Justin Wilson | Pirates | 0.13 |
| 124 | LaTroy Hawkins | Mets | 0.12 |
| 125 | Brandon Workman | Red Sox | 0.12 |
| 126 | Oliver Perez | Mariners | 0.12 |
| 127 | Tim Stauffer | Padres | 0.12 |
| 128 | Ryan Webb | Marlins | 0.11 |
| 129 | Adam Ottavino | Rockies | 0.11 |
| 130 | Scott Rice | Mets | 0.11 |
| 131 | Anthony Swarzak | Twins | 0.11 |
| 132 | Wilton Lopez | Rockies | 0.11 |
| 133 | Jim Johnson | Orioles | 0.09 |
| 134 | Darren Oliver | Blue Jays | 0.09 |
| 135 | Heath Bell | Diamondbacks | 0.09 |
| 136 | Brian Duensing | Twins | 0.09 |
| 137 | Jesse Chavez | Athletics | 0.08 |
| 138 | Joe Nathan | Rangers | 0.08 |
| 139 | Gonzalez Germen | Mets | 0.08 |
| 140 | Andrew Bailey | Red Sox | 0.08 |
| 141 | Jeanmar Gomez | Pirates | 0.08 |
| 142 | Sandy Rosario | Giants | 0.07 |
| 143 | Bruce Rondon | Tigers | 0.06 |
| 144 | Fernando Abad | Nationals | 0.06 |
| 145 | Burke Badenhop | Brewers | 0.06 |
| 146 | Joe Kelly | Cardinals | 0.06 |
| 147 | Kevin Gregg | Cubs | 0.05 |
| 148 | Yoervis Medina | Mariners | 0.05 |
| 149 | Huston Street | Padres | 0.05 |
| 150 | Tyson Ross | Padres | 0.04 |
| 151 | Logan Ondrusek | Reds | 0.04 |
| 152 | Matt Thornton | – – – | 0.03 |
| 153 | Dustin McGowan | Blue Jays | 0.03 |
| 154 | Kelvin Herrera | Royals | 0.02 |
| 155 | Matt Guerrier | – – – | 0.01 |
| 156 | Alfredo Figaro | Brewers | 0.01 |
| 157 | Ryan Cook | Athletics | 0.01 |
| 158 | Brad Boxberger | Padres | 0.01 |
| 159 | David Aardsma | Mets | 0.01 |
| 160 | Ross Wolf | Rangers | 0.00 |
| 161 | J.J. Hoover | Reds | -0.01 |
| 162 | Josh Edgin | Mets | -0.01 |
| 163 | Dane de la Rosa | Angels | -0.01 |
| 164 | Joe Ortiz | Rangers | -0.01 |
| 165 | Jerry Blevins | Athletics | -0.01 |
| 166 | Edgmer Escalona | Rockies | -0.02 |
| 167 | Josh Zeid | Astros | -0.03 |
| 168 | Marc Rzepczynski | – – – | -0.03 |
| 169 | Kevin Jepsen | Angels | -0.03 |
| 170 | Manuel Corpas | Rockies | -0.03 |
| 171 | Tyler Thornburg | Brewers | -0.05 |
| 172 | Evan Scribner | Athletics | -0.05 |
| 173 | Tom Wilhelmsen | Mariners | -0.05 |
| 174 | Chris Perez | Indians | -0.05 |
| 175 | Donnie Veal | White Sox | -0.05 |
| 176 | Pat Neshek | Athletics | -0.06 |
| 177 | Michael Kohn | Angels | -0.07 |
| 178 | James Russell | Cubs | -0.07 |
| 179 | Carter Capps | Mariners | -0.08 |
| 180 | Carlos Martinez | Cardinals | -0.09 |
| 181 | Jared Hughes | Pirates | -0.10 |
| 182 | Fernando Salas | Cardinals | -0.10 |
| 183 | Darin Downs | Tigers | -0.10 |
| 184 | Aaron Crow | Royals | -0.11 |
| 185 | Jake McGee | Rays | -0.11 |
| 186 | Drake Britton | Red Sox | -0.12 |
| 187 | Wesley Wright | – – – | -0.12 |
| 188 | Cesar Ramos | Rays | -0.13 |
| 189 | Matt Albers | Indians | -0.13 |
| 190 | Troy Patton | Orioles | -0.14 |
| 191 | Ryan Pressly | Twins | -0.14 |
| 192 | Jake Dunning | Giants | -0.14 |
| 193 | Pedro Strop | – – – | -0.15 |
| 194 | Ronald Belisario | Dodgers | -0.15 |
| 195 | A.J. Ramos | Marlins | -0.15 |
| 196 | Brad Brach | Padres | -0.15 |
| 197 | David Purcey | White Sox | -0.15 |
| 198 | Drew Storen | Nationals | -0.17 |
| 199 | Josh Fields | Astros | -0.17 |
| 200 | Bryan Morris | Pirates | -0.17 |
| 201 | David Hernandez | Diamondbacks | -0.17 |
| 202 | Raul Valdes | Phillies | -0.19 |
| 203 | Cory Gearrin | Braves | -0.19 |
| 204 | Adam Warren | Yankees | -0.19 |
| 205 | Scott Atchison | Mets | -0.20 |
| 206 | Jose Mijares | Giants | -0.21 |
| 207 | Lucas Luetge | Mariners | -0.21 |
| 208 | Jonathan Broxton | Reds | -0.24 |
| 209 | Rich Hill | Indians | -0.24 |
| 210 | Justin De Fratus | Phillies | -0.24 |
| 211 | Ramon Troncoso | White Sox | -0.25 |
| 212 | Mike Adams | Phillies | -0.26 |
| 213 | Tony Sipp | Diamondbacks | -0.26 |
| 214 | Kyle Farnsworth | – – – | -0.26 |
| 215 | Blake Beavan | Mariners | -0.27 |
| 216 | Vinnie Pestano | Indians | -0.27 |
| 217 | Al Alburquerque | Tigers | -0.28 |
| 218 | Rob Wooten | Brewers | -0.28 |
| 219 | Josh Roenicke | Twins | -0.30 |
| 220 | Nick Hagadone | Indians | -0.30 |
| 221 | Garrett Richards | Angels | -0.31 |
| 222 | Brad Lincoln | Blue Jays | -0.31 |
| 223 | Phil Coke | Tigers | -0.32 |
| 224 | Michael Bowden | Cubs | -0.33 |
| 225 | T.J. McFarland | Orioles | -0.33 |
| 226 | Ryan Mattheus | Nationals | -0.33 |
| 227 | Carlos Marmol | – – – | -0.34 |
| 228 | George Kontos | Giants | -0.34 |
| 229 | Zach Duke | – – – | -0.35 |
| 230 | John Axford | – – – | -0.36 |
| 231 | Paul Clemens | Astros | -0.37 |
| 232 | Dylan Axelrod | White Sox | -0.38 |
| 233 | Guillermo Moscoso | Giants | -0.38 |
| 234 | Travis Blackley | – – – | -0.41 |
| 235 | Clayton Mortensen | Red Sox | -0.42 |
| 236 | Esmil Rogers | Blue Jays | -0.43 |
| 237 | Alex Wilson | Red Sox | -0.45 |
| 238 | Brandon Lyon | Mets | -0.49 |
| 239 | Greg Burke | Mets | -0.49 |
| 240 | Brandon Maurer | Mariners | -0.51 |
| 241 | Michael Gonzalez | Brewers | -0.51 |
| 242 | Joba Chamberlain | Yankees | -0.52 |
| 243 | Lucas Harrell | Astros | -0.52 |
| 244 | Josh Lueke | Rays | -0.53 |
| 245 | Bruce Chen | Royals | -0.54 |
| 246 | Jose Cisnero | Astros | -0.58 |
| 247 | Jeremy Horst | Phillies | -0.59 |
| 248 | Hector Ambriz | Astros | -0.63 |
| 249 | Hector Rondon | Cubs | -0.63 |
| 250 | Dallas Keuchel | Astros | -0.64 |
| 251 | Luis Garcia | Phillies | -0.66 |
| 252 | Jeremy Affeldt | Giants | -0.67 |
| 253 | Ian Krol | Nationals | -0.69 |
| 254 | Cory Rasmus | – – – | -0.69 |
| 255 | Henry Rodriguez | – – – | -0.70 |
| 256 | Michael Kirkman | Rangers | -0.75 |
| 257 | Brandon League | Dodgers | -0.85 |
| 258 | Anthony Bass | Padres | -0.93 |
| 259 | Shawn Camp | Cubs | -1.03 |
| 260 | Mitchell Boggs | – – – | -1.40 |
| 261 | Curtis Partch | Reds | -1.42 |
The Nine Worst Sacrifice Bunts of 2013
So now that we have sufficiently killed the win, bunting seems to be the topic of the day. Last week there were many examples of managers employing the sacrifice bunt at silly times and it seemed to set off a fervor among those wishing to debate new ideas and old tradition. I got into some debates with followers – and you all know Brian Kenny did the same.
The basic argument against the sacrifice bunt is that giving up and out to gain a base is a bad percentage play. The facts are pretty clear on the matter. You have to consider who is batting and the exact situation of the game, but it’s usually always a bad idea to bunt with a reasonably competent position player. Below I’ve presented The Nine Worst Sacrifice Bunt Attempts of 2013. This requires some definition, but first I want to lay out the basic argument for when bunting might be a good idea because some often taking anti-bunting comments as absolute:
When To Bunt
- When a pitcher is batting OR
- When a very low quality hitter is up AND
- There are zero outs AND
- There are men on first and second AND
- The batter has a high probability of striking out based on his skills or the opposing pitcher AND
- One run is sufficient (i.e., you’re down one run late or tied)
The Odds Against Bunting
Here’s my post from earlier this year that outlines Run Expectancy. If you don’t like the way I explain it, just Google it. Lots of smart people have explained it.
The Rules
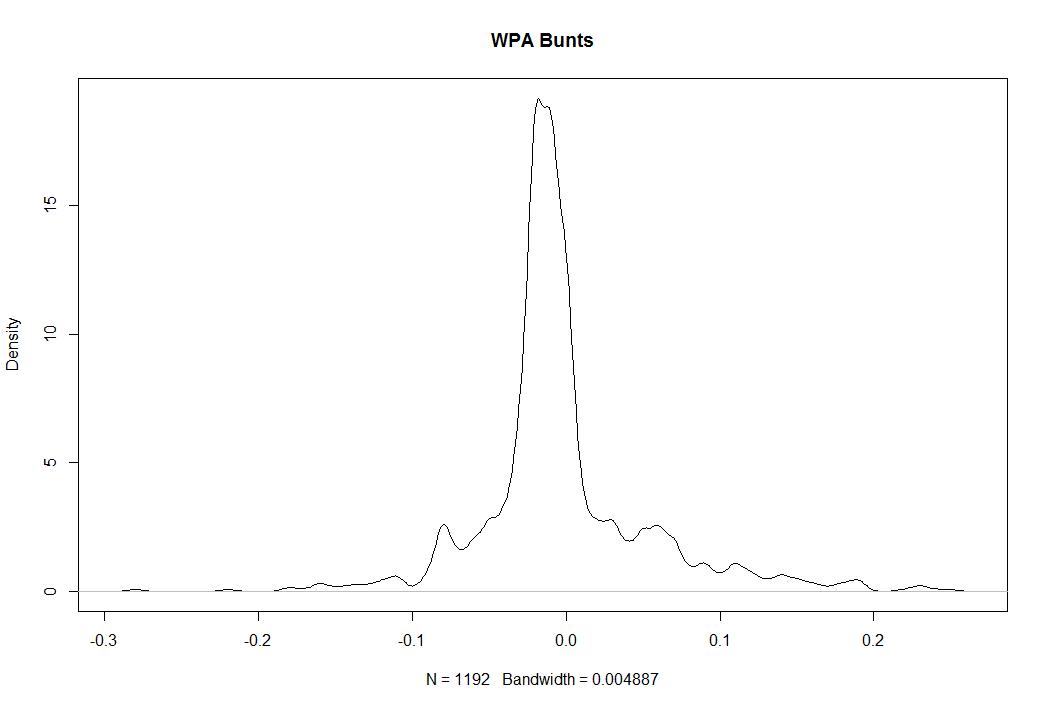
So the following are The Nine Worst Bunt Attempts of the year as defined like this. First, these are all bunts that have been put in play. I can’t examine the times a batter failed to get a bunt down and then the bunt sign was taken off. Second, this does not include bunts that went for hits. Bunting for a hit is great, this is about bunts in which an out was made – which is the goal of a bunt. Get on base and we don’t have a problem. Third, this is judged by Win Probability Added (WPA), which considers the game situation and the result of the play. So, if you call a bunt in a 10-0 game, who cares. If you call for a bunt in a 5-3 game with your two hitter, that’s probably silly. Finally, no pitchers. Pitchers can’t hit, so it’s fine to use them to bunt. Let’s see what happens!
There have been 1,192 sacrifice bunt attempts this season by non-pitchers. 174 have gone for hits and 39 have been turned into errors, so that’s 979 bunt attempts that resulted in at least one out. In sum, they have been worth -2.7 WPA. Here are the worst.
Let’s start with some data that sets the stage.
| Rank | Date | Batter | Tm |
| 9 | 9/16/2013 | Juan Uribe | LAD |
| 8 | 8/14/2013 | Alberto Callaspo | OAK |
| 7 | 8/14/2013 | Martin Prado | ARI |
| 6 | 8/10/2013 | Stephen Vogt | OAK |
| 5 | 9/9/2013 | Jonathan Herrera | COL |
| 4 | 9/18/2013 | Munenori Kawasaki | TOR |
| 3 | 4/25/2013 | Juan Pierre | MIA |
| 2 | 4/11/2013 | Brendan Ryan | SEA |
| 1 | 4/9/2013 | Rob Brantly | MIA |
There we have the date and hitters. Now the opponent and situation:
| Rank | Opp | Pitcher | Score | Inn | RoB | Out |
| 9 | @ARI | Brad Ziegler | down 2-1 | t9 | -12 | 0 |
| 8 | HOU | Josh Fields | down 2-1 | b11 | -2- | 0 |
| 7 | BAL | Jim Johnson | down 4-3 | b9 | -2- | 0 |
| 6 | @TOR | Casey Janssen | down 5-4 | t9 | -12 | 0 |
| 5 | @SFG | Javier Lopez | tied 2-2 | t10 | 1– | 0 |
| 4 | NYY | Mariano Rivera | down 4-3 | b9 | -12 | 0 |
| 3 | CHC | Carlos Marmol | down 4-3 | b9 | -12 | 0 |
| 2 | TEX | Robbie Ross | down 4-3 | b8 | 3 | 1 |
| 1 | ATL | Craig Kimbrel | down 3-2 | b9 | 1– | 0 |
All but one feature no outs and the hitting team has been trailing late or tied in each.
| Rank | Batter | WPA | RE24 | LI | Play Description |
| 9 | Juan Uribe | -0.16 | -0.56 | 5.6 | Bunt Groundout: P-3B/Forceout at 3B (Front of Home); Schumaker to 2B |
| 8 | Alberto Callaspo | -0.16 | -0.42 | 4.38 | Bunt Popfly: P (Front of Home) |
| 7 | Martin Prado | -0.16 | -0.42 | 4.38 | Bunt Groundout: P-1B (Front of Home) |
| 6 | Stephen Vogt | -0.16 | -0.58 | 5.48 | Bunt Groundout: P-3B/Forceout at 3B (Front of Home); Crisp to 2B |
| 5 | Jonathan Herrera | -0.17 | -0.68 | 3.51 | Bunt Ground Ball Double Play: Bunt C-SS-2B (Front of Home) |
| 4 | Munenori Kawasaki | -0.18 | -0.58 | 6.13 | Bunt Groundout: 1B-3B/Forceout at 3B (Front of Home); Rasmus to 2B |
| 3 | Juan Pierre | -0.18 | -0.56 | 6.21 | Bunt Groundout: C-3B/Forceout at 3B (Front of Home); Kearns to 2B |
| 2 | Brendan Ryan | -0.22 | -0.69 | 4.33 | Fielder’s Choice P; Chavez out at Hm/P-C; Ryan to 1B |
| 1 | Rob Brantly | -0.28 | -0.74 | 5.4 | Bunt Pop Fly Double Play: Bunt 3B (Short 3B Line); Solano out at 1B/3B-1B |
Alright, so a few notes. The very worst bunts are almost always the ones that include double plays or a runner getting thrown out at home somehow. Which makes sense, any time a bunt goes horribly wrong, it’s going to be more costly than a normal bunt. Martin Prado’s at #7 is the worst true sac bunt of the lot because the runner didn’t advance and Prado made an out.
So it’s perfectly reasonable to say these are poorly executed bunts. That’s true. But it’s not interesting to show you 9 very similar bunts that are all in the -4% range in the same situations. There are just so many of them. But, let me provide some summary stats to give you a better idea about the whole dataset. Of the 979 bunts that didn’t result in a hit or error, 722 resulted in a decrease in WPA, 160 resulted in no change, and 97 increased the team’s odds of winning. In other words, only 26% of sac bunts in the sample are good for the team.
So 18% of the time a batter attempts to sac bunt, he gets a hit or induces and error. That’s good. And 26% of the remaining 82% helps anyway. All told, about one quarter of position player bunts turn out to be a good idea based on WPA. Let’s go further.
Even including all of the bunts that ended in hits and errors, 276 resulted in more than one run, 339 resulted in one run exactly, and 577 resulted in zero runs. There are good bunts, but bunting is usually a bad idea. There are bunts that mess up the defense and open the door, but they are rare. Usually when you bunt, you don’t score.

You’re welcome to keep bunting, but the odds are not in your favor.
Dynamic Standings Projection (September 19, 2013)
In case you missed it, in April we launched our Dynamic Standings Projection feature on New English D. A full explanation of the methodology can be found here or by clicking the tab at the top of the page. This project seeks to provide a reasoned and cautious approach to updating our beliefs about the baseball future. You can find a summarization of the original projections here. You’ll notice a column on the far right that indicates the difference in projected wins from the preseason prediction. Positive numbers mean teams are now projected to win more games and negative numbers mean a team is now projected to win fewer games. You’ll notice a series of graphs below the standings section that track how the projections have evolved over the course of the year.
This Dynamic Standings Projection is updated through the September 18th games. Note that DSP posts have been moved to Thursday accommodate something that won’t interest you.
| 19-Sep | W | L | PreDiff | |
| BOS | 96 | 66 | 0.593 | 19 |
| TB | 89 | 73 | 0.549 | -2 |
| BAL | 87 | 75 | 0.537 | 5 |
| NYY | 85 | 77 | 0.525 | 0 |
| TOR | 75 | 87 | 0.463 | -12 |
| W | L | PreDiff | ||
| DET | 94 | 68 | 0.580 | 0 |
| CLE | 86 | 76 | 0.531 | 15 |
| KC | 85 | 77 | 0.525 | 9 |
| MIN | 69 | 93 | 0.426 | 4 |
| CWS | 65 | 97 | 0.401 | -18 |
| W | L | PreDiff | ||
| OAK | 94 | 68 | 0.580 | 10 |
| TEX | 88 | 74 | 0.543 | -3 |
| LAA | 79 | 83 | 0.488 | -9 |
| SEA | 72 | 90 | 0.444 | -3 |
| HOU | 55 | 107 | 0.340 | -5 |
| W | L | PreDiff | ||
| ATL | 96 | 66 | 0.593 | 6 |
| WSH | 87 | 75 | 0.537 | -8 |
| PHI | 76 | 86 | 0.469 | -8 |
| NYM | 73 | 89 | 0.451 | -5 |
| MIA | 60 | 102 | 0.370 | -3 |
| W | L | PreDiff | ||
| STL | 94 | 68 | 0.580 | 6 |
| CIN | 92 | 70 | 0.568 | 0 |
| PIT | 92 | 70 | 0.568 | 10 |
| MIL | 73 | 89 | 0.451 | -6 |
| CHC | 67 | 95 | 0.414 | -1 |
| W | L | PreDiff | ||
| LAD | 92 | 70 | 0.568 | 4 |
| ARZ | 83 | 79 | 0.512 | 1 |
| SF | 76 | 86 | 0.469 | -15 |
| SD | 76 | 86 | 0.469 | -2 |
| COL | 73 | 89 | 0.451 | 10 |

SOEFA Sunday: Reliever Rankings Update (September 15, 2013)
You’ll recall earlier this year we introduced our very own reliever rankings called SOEFA, which you can read about in detail here. For a brief refresher, it combines inherited runner strand rate, expected OBP against, ERA-, and FIP- into a deviation from league average. This is a measure of performance, not necessarily ability, and seeks to provide a single number to judge relievers that balances context neutral and context dependent numbers. Certain pitchers, such as Craig Kimbrel, cannot be credited for stranding runners because they are never put into those situations. They are not penalized either, however. Additionally, SOEFA penalizes pitchers like Joe Nathan and Mariano Rivera who have done a very poor job when they have been asked to strand runners this season despite great numbers in other categories.
Zero is average, and will generally range between -2.5 to 2.5 with -1 to 1 being most common. This includes all pitchers who have thrown at least 20 IP in relief as of this morning, so the average score on this list is closer to 0.10 and the inherited runner threshold has been increased from 5 to 8. SOEFA is a rate stat not a counting stat. Should you wish to know the SOEFA for any other reliever, or on a day that isn’t Sunday, hit us on Twitter or in the comments section. Also, as we look to improve SOEFA for next season, let us know if you have any suggestions!
| Rank | Player | Team | SOEFA |
| 1 | Koji Uehara | Red Sox | 0.95 |
| 2 | Greg Holland | Royals | 0.94 |
| 3 | Kenley Jansen | Dodgers | 0.91 |
| 4 | Neal Cotts | Rangers | 0.89 |
| 5 | Kevin Siegrist | Cardinals | 0.80 |
| 6 | Mark Melancon | Pirates | 0.80 |
| 7 | Drew Smyly | Tigers | 0.78 |
| 8 | Jesse Crain | White Sox | 0.78 |
| 9 | Craig Kimbrel | Braves | 0.77 |
| 10 | Javier Lopez | Giants | 0.77 |
| 11 | Will Smith | Royals | 0.76 |
| 12 | Louis Coleman | Royals | 0.73 |
| 13 | Luke Hochevar | Royals | 0.73 |
| 14 | Joaquin Benoit | Tigers | 0.70 |
| 15 | Sergio Romo | Giants | 0.70 |
| 16 | Chris Withrow | Dodgers | 0.66 |
| 17 | Alex Torres | Rays | 0.65 |
| 18 | Nick Vincent | Padres | 0.64 |
| 19 | Sean Doolittle | Athletics | 0.63 |
| 20 | Sam LeCure | Reds | 0.62 |
| 21 | Edward Mujica | Cardinals | 0.61 |
| 22 | Jose Veras | – – – | 0.61 |
| 23 | Jordan Walden | Braves | 0.59 |
| 24 | Trevor Rosenthal | Cardinals | 0.59 |
| 25 | Tanner Roark | Nationals | 0.57 |
| 26 | Jason Grilli | Pirates | 0.56 |
| 27 | David Huff | – – – | 0.54 |
| 28 | Glen Perkins | Twins | 0.54 |
| 29 | Jim Henderson | Brewers | 0.54 |
| 30 | Paco Rodriguez | Dodgers | 0.54 |
| 31 | Brian Matusz | Orioles | 0.53 |
| 32 | Casey Fien | Twins | 0.52 |
| 33 | Carlos Torres | Mets | 0.51 |
| 34 | Jake Diekman | Phillies | 0.51 |
| 35 | Tommy Hunter | Orioles | 0.51 |
| 36 | Antonio Bastardo | Phillies | 0.50 |
| 37 | Dan Otero | Athletics | 0.50 |
| 38 | Juan Perez | Blue Jays | 0.50 |
| 39 | Josh Collmenter | Diamondbacks | 0.48 |
| 40 | Shawn Kelley | Yankees | 0.48 |
| 41 | Andrew Miller | Red Sox | 0.47 |
| 42 | Brett Cecil | Blue Jays | 0.47 |
| 43 | Jason Frasor | Rangers | 0.47 |
| 44 | Manny Parra | Reds | 0.47 |
| 45 | Randy Choate | Cardinals | 0.46 |
| 46 | Brandon Kintzler | Brewers | 0.45 |
| 47 | Bobby Parnell | Mets | 0.44 |
| 48 | Seth Maness | Cardinals | 0.43 |
| 49 | Chad Qualls | Marlins | 0.42 |
| 50 | J.P. Howell | Dodgers | 0.42 |
| 51 | Junichi Tazawa | Red Sox | 0.42 |
| 52 | Matt Reynolds | Diamondbacks | 0.42 |
| 53 | Jonathan Papelbon | Phillies | 0.41 |
| 54 | Luis Avilan | Braves | 0.41 |
| 55 | Francisco Rodriguez | – – – | 0.40 |
| 56 | Joel Peralta | Rays | 0.40 |
| 57 | Brad Ziegler | Diamondbacks | 0.39 |
| 58 | Steve Cishek | Marlins | 0.39 |
| 59 | Tanner Scheppers | Rangers | 0.39 |
| 60 | Aroldis Chapman | Reds | 0.38 |
| 61 | Donovan Hand | Brewers | 0.38 |
| 62 | Joe Thatcher | – – – | 0.38 |
| 63 | Vin Mazzaro | Pirates | 0.38 |
| 64 | David Carpenter | Braves | 0.37 |
| 65 | Rob Scahill | Rockies | 0.37 |
| 66 | Tony Watson | Pirates | 0.37 |
| 67 | Tyler Clippard | Nationals | 0.37 |
| 68 | Darren O’Day | Orioles | 0.36 |
| 69 | Casey Janssen | Blue Jays | 0.35 |
| 70 | Will Harris | Diamondbacks | 0.35 |
| 71 | Ernesto Frieri | Angels | 0.34 |
| 72 | Joe Smith | Indians | 0.34 |
| 73 | Scott Downs | – – – | 0.34 |
| 74 | Addison Reed | White Sox | 0.32 |
| 75 | Carlos Villanueva | Cubs | 0.32 |
| 76 | Jean Machi | Giants | 0.32 |
| 77 | Josh Outman | Rockies | 0.32 |
| 78 | Nate Jones | White Sox | 0.32 |
| 79 | Ross Ohlendorf | Nationals | 0.32 |
| 80 | Jerome Williams | Angels | 0.31 |
| 81 | Tom Gorzelanny | Brewers | 0.31 |
| 82 | Luke Gregerson | Padres | 0.30 |
| 83 | Neil Wagner | Blue Jays | 0.30 |
| 84 | Santiago Casilla | Giants | 0.30 |
| 85 | Aaron Loup | Blue Jays | 0.29 |
| 86 | Robbie Ross | Rangers | 0.29 |
| 87 | Grant Balfour | Athletics | 0.27 |
| 88 | Jamey Wright | Rays | 0.27 |
| 89 | Luke Putkonen | Tigers | 0.27 |
| 90 | Steve Delabar | Blue Jays | 0.27 |
| 91 | Tim Collins | Royals | 0.27 |
| 92 | Anthony Varvaro | Braves | 0.26 |
| 93 | Caleb Thielbar | Twins | 0.26 |
| 94 | Craig Stammen | Nationals | 0.26 |
| 95 | Jared Burton | Twins | 0.25 |
| 96 | David Robertson | Yankees | 0.24 |
| 97 | Luis Ayala | – – – | 0.24 |
| 98 | Mariano Rivera | Yankees | 0.24 |
| 99 | Boone Logan | Yankees | 0.23 |
| 100 | Matt Belisle | Rockies | 0.23 |
| 101 | Chad Gaudin | Giants | 0.22 |
| 102 | Charlie Furbush | Mariners | 0.22 |
| 103 | Craig Breslow | Red Sox | 0.22 |
| 104 | Dan Jennings | Marlins | 0.22 |
| 105 | Alfredo Simon | Reds | 0.20 |
| 106 | Blake Parker | Cubs | 0.20 |
| 107 | Fernando Rodney | Rays | 0.20 |
| 108 | Mike Dunn | Marlins | 0.20 |
| 109 | Cody Allen | Indians | 0.19 |
| 110 | Danny Farquhar | Mariners | 0.19 |
| 111 | David Purcey | White Sox | 0.19 |
| 112 | Preston Claiborne | Yankees | 0.19 |
| 113 | Rafael Betancourt | Rockies | 0.17 |
| 114 | Anthony Swarzak | Twins | 0.16 |
| 115 | Dale Thayer | Padres | 0.16 |
| 116 | J.C. Gutierrez | – – – | 0.16 |
| 117 | Rex Brothers | Rockies | 0.16 |
| 118 | J.J. Putz | Diamondbacks | 0.15 |
| 119 | Tim Stauffer | Padres | 0.15 |
| 120 | Rafael Soriano | Nationals | 0.14 |
| 121 | Carter Capps | Mariners | 0.13 |
| 122 | Kevin Gregg | Cubs | 0.12 |
| 123 | Sandy Rosario | Giants | 0.12 |
| 124 | Alfredo Figaro | Brewers | 0.11 |
| 125 | Matt Lindstrom | White Sox | 0.11 |
| 126 | Scott Rice | Mets | 0.11 |
| 127 | Bryan Shaw | Indians | 0.10 |
| 128 | Justin Wilson | Pirates | 0.10 |
| 129 | LaTroy Hawkins | Mets | 0.10 |
| 130 | Oliver Perez | Mariners | 0.10 |
| 131 | Adam Ottavino | Rockies | 0.09 |
| 132 | Ryan Cook | Athletics | 0.09 |
| 133 | Andrew Bailey | Red Sox | 0.08 |
| 134 | Brian Duensing | Twins | 0.08 |
| 135 | Brandon Workman | Red Sox | 0.07 |
| 136 | Bruce Rondon | Tigers | 0.07 |
| 137 | Joe Nathan | Rangers | 0.07 |
| 138 | Matt Thornton | – – – | 0.07 |
| 139 | Ryan Webb | Marlins | 0.07 |
| 140 | Wilton Lopez | Rockies | 0.07 |
| 141 | Fernando Abad | Nationals | 0.06 |
| 142 | Heath Bell | Diamondbacks | 0.06 |
| 143 | J.J. Hoover | Reds | 0.06 |
| 144 | Jesse Chavez | Athletics | 0.06 |
| 145 | Joe Kelly | Cardinals | 0.06 |
| 146 | Kelvin Herrera | Royals | 0.06 |
| 147 | Burke Badenhop | Brewers | 0.05 |
| 148 | Gonzalez Germen | Mets | 0.05 |
| 149 | Jim Johnson | Orioles | 0.05 |
| 150 | Yoervis Medina | Mariners | 0.05 |
| 151 | Darren Oliver | Blue Jays | 0.04 |
| 152 | Jeanmar Gomez | Pirates | 0.04 |
| 153 | Tyson Ross | Padres | 0.04 |
| 154 | Dane de la Rosa | Angels | 0.02 |
| 155 | Matt Guerrier | – – – | 0.01 |
| 156 | Michael Kohn | Angels | 0.01 |
| 157 | Ross Wolf | Rangers | 0.00 |
| 158 | Josh Edgin | Mets | -0.01 |
| 159 | Ronald Belisario | Dodgers | -0.01 |
| 160 | Edgmer Escalona | Rockies | -0.02 |
| 161 | Huston Street | Padres | -0.02 |
| 162 | Manuel Corpas | Rockies | -0.02 |
| 163 | Kevin Jepsen | Angels | -0.03 |
| 164 | Jerry Blevins | Athletics | -0.04 |
| 165 | Pat Neshek | Athletics | -0.04 |
| 166 | Ryan Pressly | Twins | -0.04 |
| 167 | Jake McGee | Rays | -0.05 |
| 168 | Tyler Thornburg | Brewers | -0.05 |
| 169 | Dustin McGowan | Blue Jays | -0.06 |
| 170 | Logan Ondrusek | Reds | -0.06 |
| 171 | James Russell | Cubs | -0.07 |
| 172 | Chris Perez | Indians | -0.08 |
| 173 | David Aardsma | Mets | -0.08 |
| 174 | Rob Wooten | Brewers | -0.09 |
| 175 | Tom Wilhelmsen | Mariners | -0.10 |
| 176 | Darin Downs | Tigers | -0.12 |
| 177 | Joe Ortiz | Rangers | -0.12 |
| 178 | Marc Rzepczynski | – – – | -0.12 |
| 179 | Matt Albers | Indians | -0.12 |
| 180 | Jared Hughes | Pirates | -0.13 |
| 181 | Josh Fields | Astros | -0.13 |
| 182 | Tony Sipp | Diamondbacks | -0.13 |
| 183 | Troy Patton | Orioles | -0.13 |
| 184 | Aaron Crow | Royals | -0.14 |
| 185 | Cesar Ramos | Rays | -0.14 |
| 186 | Wesley Wright | – – – | -0.14 |
| 187 | Drew Storen | Nationals | -0.15 |
| 188 | Josh Zeid | Astros | -0.15 |
| 189 | Kyle Farnsworth | – – – | -0.15 |
| 190 | Nick Hagadone | Indians | -0.16 |
| 191 | Phil Coke | Tigers | -0.16 |
| 192 | Brad Brach | Padres | -0.18 |
| 193 | Fernando Salas | Cardinals | -0.18 |
| 194 | Zach Duke | – – – | -0.18 |
| 195 | Cory Gearrin | Braves | -0.19 |
| 196 | Donnie Veal | White Sox | -0.19 |
| 197 | Raul Valdes | Phillies | -0.19 |
| 198 | A.J. Ramos | Marlins | -0.20 |
| 199 | Jake Dunning | Giants | -0.20 |
| 200 | Ramon Troncoso | White Sox | -0.20 |
| 201 | Evan Scribner | Athletics | -0.21 |
| 202 | George Kontos | Giants | -0.21 |
| 203 | Jose Mijares | Giants | -0.21 |
| 204 | Bryan Morris | Pirates | -0.22 |
| 205 | David Hernandez | Diamondbacks | -0.22 |
| 206 | Pedro Strop | – – – | -0.23 |
| 207 | Rich Hill | Indians | -0.23 |
| 208 | Jonathan Broxton | Reds | -0.24 |
| 209 | Blake Beavan | Mariners | -0.26 |
| 210 | Mike Adams | Phillies | -0.26 |
| 211 | Josh Roenicke | Twins | -0.27 |
| 212 | Vinnie Pestano | Indians | -0.27 |
| 213 | Brad Lincoln | Blue Jays | -0.30 |
| 214 | Justin De Fratus | Phillies | -0.30 |
| 215 | Lucas Luetge | Mariners | -0.30 |
| 216 | Garrett Richards | Angels | -0.31 |
| 217 | Michael Bowden | Cubs | -0.33 |
| 218 | T.J. McFarland | Orioles | -0.33 |
| 219 | Al Alburquerque | Tigers | -0.35 |
| 220 | John Axford | – – – | -0.35 |
| 221 | Scott Atchison | Mets | -0.36 |
| 222 | Adam Warren | Yankees | -0.37 |
| 223 | Dylan Axelrod | White Sox | -0.37 |
| 224 | Paul Clemens | Astros | -0.37 |
| 225 | Ryan Mattheus | Nationals | -0.39 |
| 226 | Travis Blackley | – – – | -0.40 |
| 227 | Clayton Mortensen | Red Sox | -0.41 |
| 228 | Esmil Rogers | Blue Jays | -0.42 |
| 229 | Alex Wilson | Red Sox | -0.45 |
| 230 | Brandon Lyon | Mets | -0.48 |
| 231 | Carlos Marmol | – – – | -0.49 |
| 232 | Greg Burke | Mets | -0.49 |
| 233 | Joba Chamberlain | Yankees | -0.49 |
| 234 | Michael Gonzalez | Brewers | -0.49 |
| 235 | Brandon Maurer | Mariners | -0.50 |
| 236 | Bruce Chen | Royals | -0.54 |
| 237 | Jose Cisnero | Astros | -0.58 |
| 238 | Jeremy Horst | Phillies | -0.59 |
| 239 | Dallas Keuchel | Astros | -0.63 |
| 240 | Hector Ambriz | Astros | -0.63 |
| 241 | Ian Krol | Nationals | -0.67 |
| 242 | Jeremy Affeldt | Giants | -0.67 |
| 243 | Hector Rondon | Cubs | -0.71 |
| 244 | Henry Rodriguez | – – – | -0.71 |
| 245 | Michael Kirkman | Rangers | -0.74 |
| 246 | Lucas Harrell | Astros | -0.81 |
| 247 | Luis Garcia | Phillies | -0.83 |
| 248 | Anthony Bass | Padres | -0.87 |
| 249 | Brandon League | Dodgers | -0.93 |
| 250 | Shawn Camp | Cubs | -1.03 |
| 251 | Curtis Partch | Reds | -1.42 |
The Nine Worst Wins of 2013
If you’re here, you’ve likely been exposed to our series on pitcher wins and why we want to kill them. It’s become a pretty big topic of conversation around baseball and some people are calling for a cease fire because the win has been repeatedly slaughtered to the point that we’ve probably violated the Geneva Convention. So, I’ll make sure to avoid overdoing it because apparently #KillTheWin is sabr-bullying. If you’re new to the cause, check out the groundwork for why wins are a terrible statistic and then enjoy The Nine Worst Wins from 2013 (as of Sept 13th).
- You Can Have A Great Season and Not Win
- You Can Have A Bad Season and Win A Lot
- Wins Don’t Even Out in Big Samples
- A Case Study in Wins
- 12 Assorted Facts About Wins from 2013
- Dissecting the Case for Wins
- A Replacement for Wins
So the methodology is quite simple. Below are the pitchers in 2013 who have earned a “win” sorted by the lowest Win Probability Added (WPA). What WPA does is measure how much the team’s likelihood of winning changed as a result of every play and assigns that value to the pitcher and batter who took part. It’s not a perfect stat for measuring a player’s performance but it works for our purposes here for a simple reason. If a pitcher’s team scores 10 runs in the first inning, that pitcher can pitch poorly and get a win, but most of the pro-win alliance thinks that’s okay. They believe in something called “pitching to the score” which has been shown to be fiction. So in order to make the point clearly, I’ll use WPA which is entirely dependent on context. If you’re up 10, you’re allowed to give up 5. If you’re up 1, you better not give up two.
There are other ways to do this, but I think this is the most valuable way to do it given the audience still in need of persuasion.
| Rk | Player | Date | Tm | Opp | Rslt | App,Dec |
| 9 | Randall Delgado | 2-Aug | ARI | BOS | W 7-6 | GS-6 ,W |
| 8 | Brandon League | 31-May | LAD | COL | W 7-5 | 9-9 ,BW |
| 7 | CC Sabathia | 18-Aug | NYY | BOS | W 9-6 | GS-6 ,W |
| 6 | Alfredo Simon | 22-Apr | CIN | CHC | W 5-4 | 13-13f,W |
| 5 | Rafael Soriano | 17-May | WSN | SDP | W 6-5 | 9-9 ,BW |
| 4 | Matt Belisle | 28-Jul | COL | MIL | W 6-5 | 8-8 ,BW |
| 3 | Joe Smith | 26-Jun | CLE | BAL | W 4-3 | 8-8 ,BW |
| 2 | Michael Wacha | 19-Aug | STL | MIL | W 8-5 | 7-7 ,BW |
| 1 | Kyuji Fujikawa | 12-Apr | CHC | SFG | W 4-3 | 9-9f ,BW |
| Rk | Player | IP | H | R | ER | BB | SO | HR | Pit |
| 9 | Randall Delgado | 6 | 6 | 6 | 4 | 1 | 7 | 2 | 97 |
| 8 | Brandon League | 1 | 2 | 2 | 2 | 0 | 1 | 1 | 26 |
| 7 | CC Sabathia | 5.1 | 7 | 6 | 6 | 5 | 5 | 1 | 103 |
| 6 | Alfredo Simon | 1 | 1 | 2 | 1 | 0 | 1 | 1 | 15 |
| 5 | Rafael Soriano | 1 | 4 | 2 | 2 | 0 | 0 | 0 | 19 |
| 4 | Matt Belisle | 1 | 2 | 2 | 2 | 0 | 2 | 1 | 23 |
| 3 | Joe Smith | 1 | 3 | 2 | 2 | 1 | 0 | 0 | 21 |
| 2 | Michael Wacha | 1 | 4 | 3 | 3 | 0 | 1 | 1 | 30 |
| 1 | Kyuji Fujikawa | 1 | 3 | 3 | 3 | 0 | 0 | 0 | 30 |
| Rk | Player | ERA | RE24 | WPA |
| 9 | Randall Delgado | 6.00 | -2.939 | -0.392 |
| 8 | Brandon League | 18.00 | -1.479 | -0.404 |
| 7 | CC Sabathia | 10.12 | -3.472 | -0.410 |
| 6 | Alfredo Simon | 9.00 | -1.537 | -0.417 |
| 5 | Rafael Soriano | 18.00 | -1.594 | -0.430 |
| 4 | Matt Belisle | 18.00 | -1.479 | -0.431 |
| 3 | Joe Smith | 18.00 | -1.490 | -0.528 |
| 2 | Michael Wacha | 27.00 | -2.537 | -0.557 |
| 1 | Kyuji Fujikawa | 27.00 | -2.537 | -0.745 |
To date, there have been 282 wins in which the pitcher had a negative WPA in 2013. Above you’ve seen the nine worst including Fujikawa having just about the worst performance I could imagine in a win using this method. In fact, as far back as we have WPA data, it’s the 14th worst such win.
It looked like this! That’s pretty bad.

This is all by way of saying that wins aren’t a useful statistic and that even if we allow for the idea of pitching to the score, we still have a ton of ridiculous wins every season. If every win was handed out perfectly the rest of the season, we would still have seen 11.6% of the wins in 2013 go to pitchers who hurt their team’s chance to win.
#KillTheWinButDoItWithoutBeingSoDramatic
Dynamic Standings Projection (September 12, 2013)
In case you missed it, in April we launched our Dynamic Standings Projection feature on New English D. A full explanation of the methodology can be found here or by clicking the tab at the top of the page. This project seeks to provide a reasoned and cautious approach to updating our beliefs about the baseball future. You can find a summarization of the original projections here. You’ll notice a column on the far right that indicates the difference in projected wins from the preseason prediction. Positive numbers mean teams are now projected to win more games and negative numbers mean a team is now projected to win fewer games. You’ll notice a series of graphs below the standings section that track how the projections have evolved over the course of the year.
This Dynamic Standings Projection is updated through the September 11th games. Note that DSP posts have been moved to Thursday accommodate something that won’t interest you.
| 12-Sep | W | L | PreDiff | |
| BOS | 96 | 66 | 0.593 | 19 |
| TB | 88 | 74 | 0.543 | -3 |
| NYY | 86 | 76 | 0.531 | 1 |
| BAL | 86 | 76 | 0.531 | 4 |
| TOR | 76 | 86 | 0.469 | -11 |
| W | L | PreDiff | ||
| DET | 93 | 69 | 0.574 | -1 |
| KC | 85 | 77 | 0.525 | 9 |
| CLE | 84 | 78 | 0.519 | 13 |
| MIN | 70 | 92 | 0.432 | 5 |
| CWS | 67 | 95 | 0.414 | -16 |
| W | L | PreDiff | ||
| OAK | 93 | 69 | 0.574 | 9 |
| TEX | 91 | 71 | 0.562 | 0 |
| LAA | 78 | 84 | 0.481 | -10 |
| SEA | 72 | 90 | 0.444 | -3 |
| HOU | 56 | 106 | 0.346 | -4 |
| W | L | PreDiff | ||
| ATL | 96 | 66 | 0.593 | 6 |
| WSH | 86 | 76 | 0.531 | -9 |
| PHI | 76 | 86 | 0.469 | -8 |
| NYM | 73 | 89 | 0.451 | -5 |
| MIA | 61 | 101 | 0.377 | -2 |
| W | L | PreDiff | ||
| STL | 94 | 68 | 0.580 | 6 |
| PIT | 93 | 69 | 0.574 | 11 |
| CIN | 92 | 70 | 0.568 | 0 |
| MIL | 71 | 91 | 0.438 | -8 |
| CHC | 69 | 93 | 0.426 | 1 |
| W | L | PreDiff | ||
| LAD | 94 | 68 | 0.580 | 6 |
| ARZ | 82 | 80 | 0.506 | 0 |
| SF | 75 | 87 | 0.463 | -16 |
| SD | 75 | 87 | 0.463 | -3 |
| COL | 73 | 89 | 0.451 | 10 |