Justin Verlander was baseball’s best pitcher over the last four seasons, but this year Verlander has regressed all the way down to being, like, baseball’s 10th best pitcher. We’ve overblown his struggles because we’re used to him never struggling. He’s not 2009-2012 Justin Verlander, but he’s still better than almost anyone else in baseball.
That said, despite a respectable 3.69 ERA, 3.35 FIP (what’s FIP?), and 3.0 WAR (what’s WAR?), there are some signs of trouble. He has the lowest K/9 and highest BB/9 since his 2008 struggles:

The strikeout drop isn’t dramatic, but the walk differential is a bit concerning. He’s allowing a higher batting average against and a higher BABIP (what’s BABIP?) so some of this could be luck, but it could also be because he’s easier to hit. His line drive, fly ball, and ground ball rates are almost identical to his 2012 numbers .
The key for JV is a little bit of batted ball luck, but mostly it’s a strikeout to walk ratio problem. Try this on for size, in 2012, 32% of Verlander’s total batters faced ended in a walk, HBP, or strikeout. In 2013, it’s exactly the same. He’s allowing the same percentage of balls to be put in play as last season and he’s allowed the exact same line drive, fly ball, and ground ball mix. Exactly the same.
The difference for Verlander in 2013, we can say, is that he’s walking batters during at bats in which he used to strike them out. This is evident when you consider opposing hitters are chasing pitches outside the zone against Verlander less often and he’s getting fewer swinging strikes. Basically, batters aren’t chasing Verlander’s pitches and he isn’t inducing as many swings and misses as he did last season. As a result, instead of striking out a batter chasing on 3-2, he’s walking them which extends innings and makes the hits he does allow more costly in terms of run prevention.
He’s not allowing more balls in play as a percentage of batters faced, but he is allowing more overall because walks are extending his innings and giving other teams more chances to cash in. In 2012 he faced 3.7 batters per inning on average. In 2013 it’s 4.3. The problem with Verlander is that he’s doesn’t put hitters away with a strikeout and instead grants a walk. Everything else unravels from there.
What’s behind all of this?
I have two basic answers with one common cause. None of it has anything to do with his velocity. We’ve seen Verlander pitch effectively with lower velocity before and he’s been successful this season when he didn’t have a good fastball and he’s been bad this season when he has had the 95+mph.
This is something different. It’s something fixable. It’s not something we should worry too much about. Let’s break it down.
1. Movement on His Breaking Balls
Last season his curveball averaged 6.3 inches of horizontal movement and 8.5 inches of vertical movement (these are Pitch F/X numbers and are based on where the ball would be expected to finish based on a baseball that wasn’t rotating). This year, he’s at 5.2 and 7.7 inches respectively. It’s easier to see graphically (All graphs from catcher’s perspective. H/T to Brooks and FanGraphs):
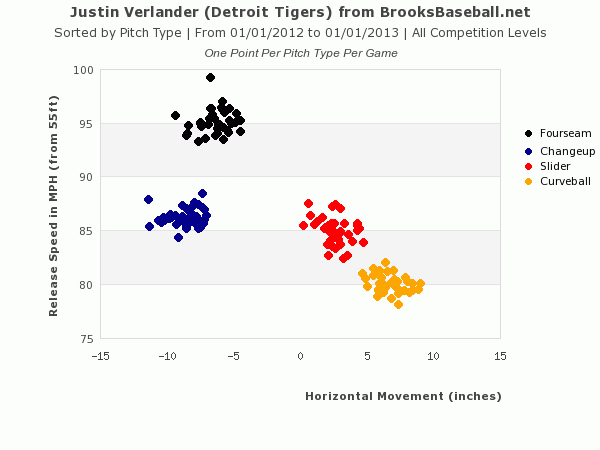

Notice how his curveball has as much horizontal break as his slider this season when it used to have more in the past. Now let’s look at horizontal and vertical movement together.


You can see the problem in his slider too a little bit, actually. The curveball isn’t breaking horizontally enough and the slider doesn’t have enough vertical depth. Both pitches are blending into a hanging breaking ball. The slider is faster, but it lacks the vertical depth needed to get hitters (especially lefties) out. The curveball is essentially just a slower version of the slider with some vertical depth. Neither is what it was in 2012. In order for Verlander to use these pitches effectively, they need to have different properties. The curveball is a slower pitch with more break and the slider is faster with less. They need to be different in all three dimensions – velocity, horizontal, and vertical – and they need to both break more in general than they are this season.
As a result, hitters are laying off the sliders that they used to swing through and more of those sliders are getting called as balls. The curveball has still been an effective weapon at times, but he’s throwing it less often because it isn’t moving the way he wants it to.
This is a bit convoluted so I’lll try to make it clearer. His curveball is getting more swings than it used to and the contact against on it is up because it isn’t moving the way it used to. The slider is less effective because hitters are swinging less and it’s not landing in the zone. The curveball is more hittable and the slider is less enticing. This is problem number one.
2. Fastball…Movement
In the charts above, you could see the breaking ball problems if you looked at overall averages from each game. They are clear as day. But the fastball doesn’t look much different other than a bit of a drop in average velocity. But as I pointed out earlier, two of his rockiest starts have come when he had his best fastball. The success isn’t about velocity. It’s above vertical movement on his fastball and you can’t see the problem if you don’t look at every pitch.
The horizontal problem with the curveball and vertical issue with the slider are evident overall because they are a consistent problem. But the fastball issue is only some of the time, take a look at 2012 and then 2013:

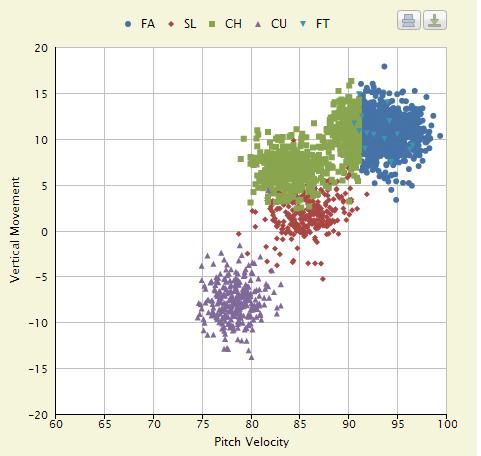
Notice that missing cluster of fastballs in the 0-5 vertical movement section? Those are gone. He’s missing a subset of his fastballs that drop significantly on their way to the plate. You can see it in the horizontal and vertical plots too, 2012 and then 2013:


A cluster of fastballs (and changeups because of some Pitch F/X confusion) is missing that are just down and to the left of center. They are gone. It’s not like there are fewer or they aren’t moving as much, they are totally absent. And this isn’t a classification issue because we’re not talking about these being fastballs OR changeups, there simply are no pitches thrown in that location on the chart.
His fastballs all have the same general horizontal and vertical movement as each other this season when Verlander used to be able to go to a fastball that had more sink on it in 2012. Not having that pitch in his arsenal is likely the cause of a nearly 3% drop in his fastball swing and miss rate from 2012 to 2013. Verlander used to get more whiffs on the fastball and now he isn’t anymore and when they do make contact they do so for more line drives. They’re squaring up his fastball more because there is less variation in its movement.
So now that we’ve established the problem and the connection to the results, we have to ask what is responsible for this? Everyone wants to talk velocity, but two of his worst starts were two of his “best” fastball days. No friends, this is something much more technical.
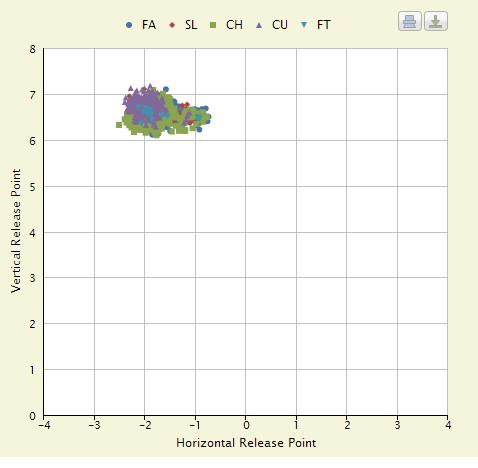
Release Point
Let’s take a look at his release points form 2012 and 2013:
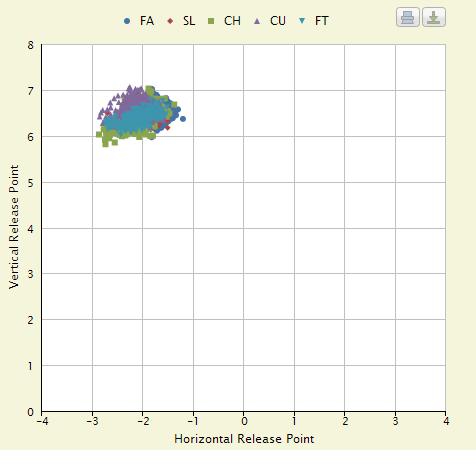
That looks awfully different. Terrifyingly different, one might say if they were prone to hyperbole. Let’s take a look at just curveballs and sliders first:


That’s a big difference. The scale is in feet. We’re talking about release the ball 6-12 inches different from normal in some cases, and at the very least it’s a more inconsistent release point that we saw in 2012. Let’s try fastballs and changeups:

Again, this is a big difference. I don’t even need to describe it to you. He’s releasing the ball closer to first base on his breaking balls and on his fastballs and changeups. This is the difference. It’s a mechanical issue that he needs to correct. I’m not a master of .gifs and screenshots, but I’ve seen the tape from 2012 and 2013 and can tell you he’s falling off to the first base side more in 2013 than he used to. His body is taking him away from the plate and it’s preventing him from getting on top of his pitches – which makes sense that he can’t get the vertical movement on some of his fastballs but the horizontal movement is just fine. It also explains the problem with his breaking balls. Less depth on the slider and less horizontal break on the curveball.
I’m not a pitching coach and I didn’t pitch growing up (I caught, so I can diagnose the problem even if I can’t fix it), but I can clearly see the problem. I don’t know if Verlander is out of whack in his timing or if he’s favoring a lower body injury, but this is what’s going on.
The problem with his pitches lines up with the problems in results and this release point problem explains it all very nicely. Something else could be wrong, but this definitely is. It’s right there in front of you.
This is good news for Tigers fans because it’s really easy to fix compared to an injury. Verlander can just straighten out and get back to being himself. He just signed a huge contract, so it’s good to see this might not be him wearing down but rather him just being out of sync. That’s actually the explanation he’s given the press. It seems to be true.
It also explains why he’s shown flashes of himself. Sometimes he does throw the ball from the right spot and those pitches do their thing. The problem is when he gets out of sync and he loses it, things can turn quickly. Have you noticed how it’s tended to blow up in some innings but rarely across entire games. This is Verlander fighting his delivery, not fighting his body.
And he can fix it. Heck, Scherzer has a way more complicated motion and he’s repeated that like a champ so far this season. It’s going to be okay Tigers fans, the ace isn’t fading, he’s just going through a bit of a rough patch. And he can find a way to fix it. (Here’s a post from August 6th, showing improvement!)

[…] They’ll carry their 3.5 game lead in the Central into Thursday’s matinee looking to sweep the set with the Sox. They’ll call on Justin Verlander (21 GS, 131.2 IP, 3.69 ERA, 3.35 FIP, 3.0 WAR) to get the job done. If you missed it yesterday, New English D broke down exactly what has been troubling Verlander this year. […]
[…] get enough sink on his fastball when he wanted to thanks to a problem with his release point that we chronicled yesterday. The Tigers didn’t go quietly, however, as they got runs on Hunter, Martinez, and Pena […]
It’s really remarkable to see this all laid out in terms I, a fan, can understand. Excellent analysis.
This is tremendous. I knew he was just a bit off from watching him, but I don’t know enough to describe what exactly is off. This makes it perfectly clear (and very reassuring, too).
[…] the real reason for Verlander’s struggles likely exists within a more complex mix of factors, the popular focus on pitch speed provides a good entry point for introducing two other pitching […]
[…] In the day’s marquee matchup, Anibal Sanchez (18 GS, 111 IP, 2.59 ERA, 2.46 FIP, 3.8 WAR) finished with 7 innings of 1 run baseball and got the better of Stephen Strasburg after dueling early. Both teams scored single runs early in the game and were shut down by the two starters until the bottom of the 6th. At that point, the Tigers broke through. Cabrera made the first out before Fielder singled, Martinez doubled, and Peralta walked. With the bases loaded Andy Dirks struck out swinging and left it up to Alex Avila. Avila worked himself into a 2-1 count, before turning on a 96 mph fastball from one of the game’s best and deposited it in the right field seats to give the Tigers a 5-1 lead. That would be all they would need as Leyland called on Veras for the 8th and Benoit for the 9th who shut the door easily. The win is the Tigers’ 60th of the season and their 8th in their last 9. A quick turnout will put the Tigers on the field during Wednesday’s trading deadline with Justin Verlander (22 GS, 137.2 IP, 3.99 ERA, 3.41 FIP, 3.0 WAR) on the mound trying to rediscover his release point. […]
[…] his old self, but he did break off some nice curveballs, which he had been missing thanks to issues with his release point. The win is the Tigers 5th straight and 9th in their last 10 tries pushing them to 16 games over […]
[…] this season can be chalked up to his inconsistent release point. You can read the entire thing here, in which I lay out the problem in the results, the causes of those problems, and the root cause […]
[…] What’s Behind His 2013 Struggles? […]
[…] wrote extensively last season about Verlander’s release point mess during the middle of last year and that issue appears to be resolved. Verlander is Verlander again. […]