
Batting Average on Balls in Play (BABIP) is one of the most easily understood sabermetric statistics because it can be easily calculated at home like many of the basic descriptive stats, but it is also a very powerful tool. Let’s start with the basic idea (or you can read about it at Fangraphs).
BABIP is exactly what it says it is, a player or pitcher’s batting average (or average against) on balls that are put in play, meaning that strikeouts and homeruns are subtracted from at bats in the denominator while sacrifice flies are added and homeruns are subtracted from the numerator of batting average, it looks like this:
BABIP = (H – HR) / (AB – K – HR + SF)
Sac bunts aren’t included because you’re making an out on purpose, so it doesn’t really belong given that it doesn’t reflect a hitter or pitcher’s skill.
BABIP tells you what percentage of balls hit somewhere the defense could make a play go for hits and can tell us a lot about players. For hitters, defense, luck, and skill determine your BABIP. A good defense playing against you will lower your BABIP because they will catch balls that should be hits, luck will lower or raise your BABIP because sometimes hard hit balls go right at someone, and skill will influence your BABIP because line drive hitters and speedy runners are more likely to have higher BABIPs because they hit the ball in a way that is more likely to result in hits or they leg out infield singles.
We generally think of true talent levels for hitters between .250 and .350 with average being right around .300. If you see someone deviate greatly from .300 or so, there may be a legitimate reason, but it is also very likely about luck. Hitters can influence their BABIP, but BABIP is fluky and takes a while to settle down, meaning that in small samples your BABIP can be quite different from your true talent level. This is what we mean when we say someone’s success is BABIP driven. No one can sustain a .450 BABIP for a whole season, but they can do it for two weeks and that can inflate statistics like batting average and slugging percentage in small samples.
The same is true for pitchers, but it’s even more critical. Pitchers have very little control over what happens to the baseball once it is put in play. Strikeouts, walks, and homeruns rest solely on a pitcher, but once a hitter makes contact it’s out of their hands. Most pitchers will have BABIPs close to .300 and any serious deviation from that number means there is some serious luck or defense involved. Even pitchers who are easy to hit will still have BABIPs closer to average because their defense will still get to a high percentage of balls in play.
Using BABIP is very easy. Hitters can have higher or lower BABIPs based on their skills, but they are unlikely to post very high or very low BABIPs. For example, only 14 hitters in MLB history have BABIPs above .360 for their careers and only 26 hitters since WWII have BABIPs lower than .240. What you want to do is compare a hitter’s season BABIP to their previous seasons to see if it is in line. If you’re jump from a .310 career BABIP to a .360 the next season, it’s likely due for some regression to the mean. BABIP can be predictive like this if there is no underlying change in skill.
For pitchers it’s even better. If a pitcher has a BABIP the deviates heavily from average, it’s almost certainly a function of luck or bad defense.
It’s quite straightforward. If someone’s BABIP deviates heavily from .300 and has no history of a high or low BABIP, it means you’re likely looking at something fluky. Here’s a quick demonstration to prove the point. Here is every qualifying hitter season since 1990 by BABIP:
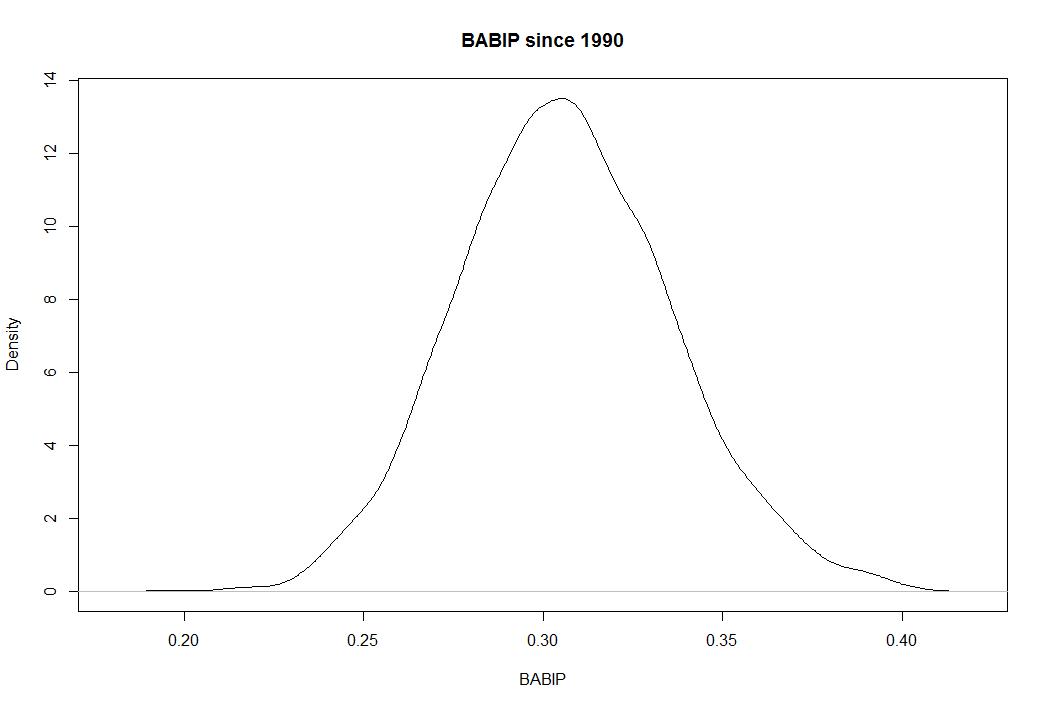
You can see how it centers on .300 and almost never extends beyond .250 and .350. But in small samples, it can be fluky and give you weird results that can inflate your batting average or other numbers. Let’s look at the last 14 days in MLB:

You’ll notice the normalized shape, but also notice the scale across the horizontal axis. Lots of players have BABIPs in the .400 and below .200 over the last two weeks, meaning lots of players are over and underperforming their true talent thanks to luck and random variation.
The takeaway is simple. BABIP is a place to look when deciding if a player’s improved (or worse) results are coming from a real change in skill or good fortune. If the BABIP looks funky, look closer. If the BABIP looks typical, there might be something real going on.

[…] was coming off of a career year in which he posted a rather high Batting Average on Balls In Play (BABIP) which led most to believe he wouldn’t perform as well in 2013 as he did in […]
[…] is a bit concerning. He’s allowing a higher batting average against and a higher BABIP (what’s BABIP?) so some of this could be luck, but it could also be because he’s easier to hit. His line […]
[…] we look at his BABIP (what’s BABIP?) we can see that the years in which he “struggles” are the years in which he has a low […]
[…] average or is he a star? That’s our basic question. He’s been a very high BABIP guy (what’s BABIP?) in his entire career and these overall numbers trend along with […]
[…] luck on hard hit balls is regressing amazingly to the mean in his batting average on balls in play (what’s BABIP?). I drew in his career average to show exactly how amazing it is. Perfect […]