
Prince Fielder isn’t having a bad season, he just isn’t having a great one. He’s been worth just 1.0 wins above replacement (what’s WAR?) in 101 games despite being worth close to 5 WAR in each of the last two seasons. The defensive and baserunning metrics always put Fielder clearly below average, costing his team 1-2 wins per season on average, but they are not currently out of line with his career numbers. Fielder’s missing value is entirely on the offensive side of things.
Again, this is not to say Fielder has been bad, but rather that he hasn’t been a great hitter like he normally is. These kind of seasons have happened before for Fielder. Let’s take a look at his single season wRC+ (what’s wRC+?) over his career. This is simply an offensive rate stat that measures how he compares to league average, which is set to 100.

You can see he has had down seasons in his career. In his first full season he was only at 110. In 2008 it was 125 and in 2010 it was just 136. None of those are bad numbers, but they aren’t like the 4 seasons of better than 50% better than league average that he put up in 2007, 2009, 2011, and 2012. This year he’s all the way down at 122. He’s just 22% better than the league average hitter this season when we expected to see him around 40% better. What’s going on?
Well he’s walking less and striking out more than last season, but he’s still significantly above average in both departments. He’s also been successful when he’s had a higher K%. I’m not saying these aren’t factors, but I don’t think they are the main factors. I think it’s more about the at bats in which he makes contact.
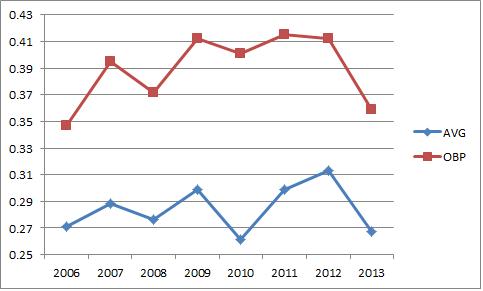
You’ll notice his overall production dips in conjunction with lower batting average and OBP, obviously, but you’ll notice the 2011 and 2012 average spike wasn’t met with an OBP spike. He traded walks for hits. This year he’s essentially walking at the same rate but isn’t getting the hits. It’s as if he changed his approach in the last few years to be more of a contact hitter, and this year the contact isn’t paying off:
You can see the contact spike very clearly in the following graph:

2011 and 2012 look like the anomalies. He saw a huge spike in his contact rate, which helped elevate the batting average. He wasn’t hitting for as much power, but plate appearance that used to be walks were now hits, which helped his offensive value because they occasionally went for extra bases as well. Let’s take a look at BB, 1B, 2B, and HR (PA numbers are all very close):
| Season | 1B | 2B | BB | HR |
| 2006 | 90 | 35 | 59 | 28 |
| 2007 | 78 | 35 | 90 | 50 |
| 2008 | 96 | 30 | 84 | 34 |
| 2009 | 93 | 35 | 110 | 46 |
| 2010 | 94 | 25 | 114 | 32 |
| 2011 | 95 | 36 | 107 | 38 |
| 2012 | 118 | 33 | 85 | 30 |
| 2013 | 66 | 21 | 52 | 17 |
He’s always had a very consistent number of singles until 2012 when that number spiked. In 2010, he walked a lot but it cost him his extra base power. 2011 was essentially the best of everything. Lots of singles, career higher 2B, 107 BB, and 38 HR. He parlayed that into a nice contract, actually. In 2012, he hit fewer homers and doubles and walked less, but had a ton more singles to make up for it. Instead of a high walking slugger, he was a solid walking well balanced hitter.
You can see in 2013 that the HR, BB, and 2B pace is down only slightly from last season. The difference between Fielder in 2012 (when he was great) and Fielder in 2013 (when he is just pretty good) is that what used to be singles are now outs. Some of that is a tick up in K% and a decrease in contact% but some of it is about batted balls.
If we look at his BABIP (what’s BABIP?) we can see that the years in which he “struggles” are the years in which he has a low batting average on balls in play.
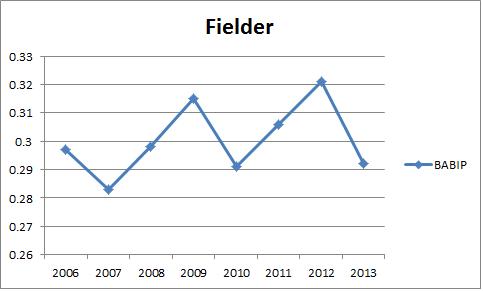
Notice first that 2007 doesn’t seem to fit the patter because he was great but has a low BABIP – but remember that he hit 50 HR that season, which aren’t in play. If we bounce 2007 up and say he had a low BABIP for a positive reason, we can see that the down years of his career are the ones with the lower BABIP.
Low BABIP can be about a hitter’s skill, approach, or quality of contact, but it can also be about luck and the quality of the other defense. Let’s see if their is a Fielder explanation in his batted ball data:

What we can see is that Fielder has been trending toward more line drives lately at the expense of fly balls, which makes perfect sense with our theory that he’s trading big power for more contact and singles. But you’ll also notice that his line drive percentage this year is actually better than his very good 2011 season. He’s also hitting a lot more fly balls this year that he did in the last two seasons, but he has previously been successful hitting that many fly balls. Fielder’s approach is definitely different that in used to be in this respect, but it doesn’t appear to be detrimentally different.
He’s hitting more balls in the air, but they aren’t leaving the park like they should. He is HR/FB%:
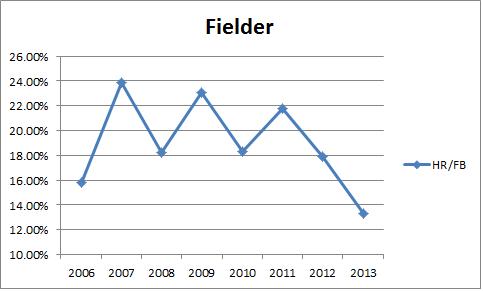
You’ll notice that it has fluctuated in his career, as we would expect given the fluky nature of HR/FB%, but his number in 2013 is noticeably lower than the typical fluctuation. In his best years he’s hitting 22% or better, but in his down years we expect it around 18%. Let’s imagine a scenario in which Fielder’s HR/FB% was 18% this season. That would be 23 HR instead of 17. Five additional homeruns is a meaningful difference.
His current 2013 wOBA (what’s wOBA?) is .352, which is good but not amazing. If we trade 5 outs for HR, what happens? It goes up to .377. That’s not in line with his great seasons, but it’s much better. That calculates out to a wRAA (what’s wRAA?) of 22.5, which is good for about 2.4 WAR offensively. He’s currently offering an offensive WAR of around 1.3. These 5 HR account for an entire win above replacement in value and something like 1.6 WAR extrapolated out over an entire season. He’s a 3.9 WAR offensive player if he hits exactly like this the rest of the season if he bring his HR/FB% in line with his previous lows. That’s much better. His defense and running will still cost him 1-2 wins before he positional and replacement level adjustment.
So we have to ask ourselves if the HR/FB rate is Fielder’s fault or just bad luck? And also, if he’s generally been unlucky on balls in play turning into outs. If it’s just bad luck, we don’t have to worry and we can easily expect him to regress to the mean and play better the rest of the way.
If we take a look at this Hard Hit Average leaderboard, Prince Fielder still ranks extremely well (H/T Mark Simon and ESPN Stats and Info):

If you can’t read it, he’s 14th in baseball with a hard hit average better than guys like Chris Davis, David Wright, and Paul Goldschmidt. It seems like he’s making hard contact at a high rate, but he’s simply not getting those balls to drop. The same thing happened to Victor Martinez earlier this season and everything corrected itself for him. If we believe that hard hit balls are predictive of good performance, and I do, then it looks like Fielder is just getting unlucky and everything should be fine. His hard hit average is down this year, but it’s still way above the MLB average of .170. When you hit the ball hard this often, the results are usually very good.
| Hard Hit Average | |
| 2010 | 0.244 |
| 2011 | 0.290 |
| 2012 | 0.269 |
| 2013 | 0.234 |
He’s getting fewer hits on balls in play, but he’s not hitting the ball weakly, he’s hitting it in the wrong place. Combine that with a fluky low HR/FB% and you can wash away Fielder’s offensive problems. The results matter for the team, but there doesn’t appear to be anything wrong with the process. And process is more predictive than results going forward and going forward is what we care about. Even if he’s lost a touch of power behind his swing, it’s still going to produce results better than this going forward.
Prince Fielder is having a down season in the second season of a huge contract, but it doesn’t look like this is the sign of an early decline. It’s mostly just some bad luck, and luck often turns.

Certainly seems Prince has hit a huge number of flyballs to the warning track in center. There’s relief for this Tiger fan in your analysis that it’s likely bad luck and not skill decline. I never was worried about Victor Martinez because his bad luck was painfully obvious.
[…] Fielder isn’t having a great season compared to the bar he’s set for himself. I covered the issues a couple of months ago and chalked it up to a whole host of things. Primarily he wasn’t […]
[…] What’s Behind His Somewhat Down Offensive Year? […]