We’re all pretty clear on the basic structure of Victor Martinez’s 2013 season. His numbers were bad during the first few months and then he started having excellent numbers and now his season long stats are all pretty solid. I argued earlier this season that Martinez was getting supremely unlucky and those claims were supported when Martinez started crushing it.
I’d like to update you on his pace with a few graphics. I don’t have any crack analysis because I’ve already done that part. His numbers were bad, I told you why. His numbers got better, I told you why. Now I just want to show you a full picture with a few graphics. Enjoy!

First we have his average, on base, and slugging percentage at the end of every game. Since above game 70, he’s been incredible and pulled out of his early season slide:
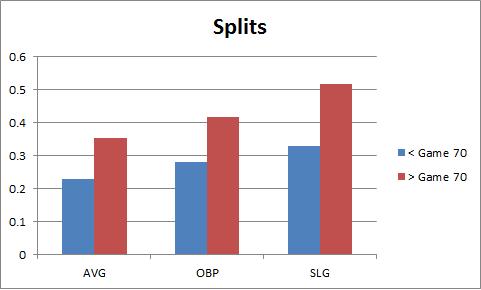
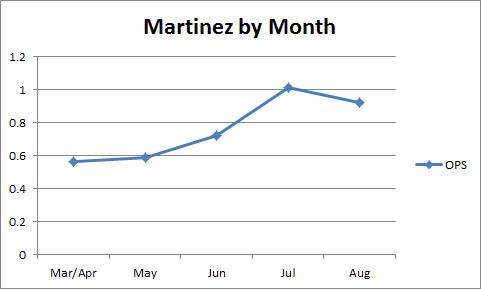
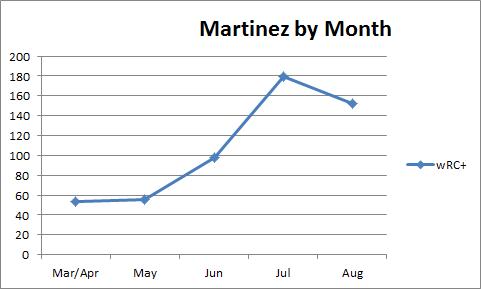
If you drop a line at game 70 and split the numbers, he was not very good beforehand and is a borderline MVP after. The cutoff is arbitrary, but there are more than 200 PA on each side. Let’s check out his monthly splits by OPS, wOBA (what’s wOBA?), and wRC+ (what’s wRC+?).

Like I said in the first citation, his bad luck on hard hit balls is regressing amazingly to the mean in his batting average on balls in play (what’s BABIP?). I drew in his career average to show exactly how amazing it is. Perfect balance:
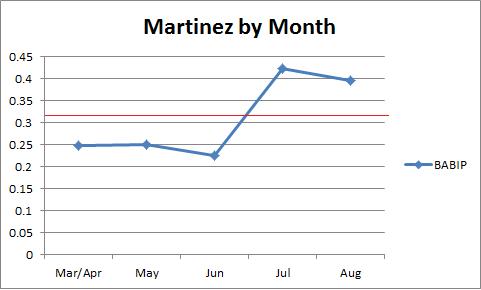
Martinez was having bad luck and now he’s not anymore. The two links at the top of the post break it down and these graphs sum it up. Martinez was having a lousy season as far as results went, but then the hits started to fall and he’s come racing back. We always knew they would because he’s been near the top of the hard hit average leaderboard and stands at 6th in MLB entering the day. He’s now having an above average season overall (102 wRC+) and is still on the rise.

I enjoy reading your articles. Quick question, I’m guessing BABIP is difficult to predict in small sample sizes, but since he’s now “regressed to his mean” in a positive way (or would “progressed to his mean” be a more appropriate way to say that) would you expect his BABIP to return to his career norm the remainder of this year?
Yeah, you would expect him to be closer to average going forward, but any small sample is going to have the potential for random variation. So the next ten games could be anything, but the bigger the same the more likely it is to see it converge on expectation.