
Part of my ethos as an educator is to take nothing for granted. Don’t assume your student knows something just because you know it. I want to bring a little more of that to baseball, especially when discussing modern statistics. One of the most basic sabermetric ideas is that On-Base Percentage (OBP) is a better way to measure players than batting average (AVG). This is something a lot of people understand, but not everyone does. That’s okay, I’d like to explain why you should use OBP instead of AVG when evaluating players and I’ll even teach you a trick to make it easier.
OBP = (H+BB+HBP)/(AB+BB+HBP+SF)
Let’s use 2012 David Wright as our example. Wright had a .306 AVG in 2012 as he got 178 hits in 581 AB. Batting average tells you the rate at which a player gets a hit in trips to the plate in which they don’t walk, get hit, or sacrifice. That’s useful information, but it is incomplete information. If you want to look at batting average to compliment OBP, that’s great, but don’t look at just AVG. Here’s why.
In this is example, you’ve ignore the times Wright reached base via a walk or hit by pitch. You’ve essentially removed that part of his value from the stat at which you’re looking. David Wright got on base 84 more times in 2012 that you wouldn’t know about if you only look at batting average. You’re right that a walk isn’t quite as good as a hit, but it is much, much better than an out. Walking puts you on base for someone else to move you over and in and getting on base correlates much more closely with runs scored than batting average.
To be specific, a walk is about 78% as good as a single. It’s perfectly reasonable to prefer a hit to a walk, but a walk is much better than an out and if you’re going to use a basic rate statistic, use a stat that includes walks. If you’re more ambitious, Weighted On Base Average (wOBA) actually weighs each outcome relative to its value, but let’s keep it simple and use OBP.
The point is simple. David Wright’s AVG is .306, but his OBP was .391. He was 17th in AVG, but 8th in OBP. If you ignore walks, you’re missing out on a big part of a player’s offensive game. You’re underrating him because you’re not considering how often he gets on base. If you want everything to count the same, OBP is the stat for you. If you’re looking for something even better, try wOBA. Don’t use batting average because it simply ignores and important part of baseball.
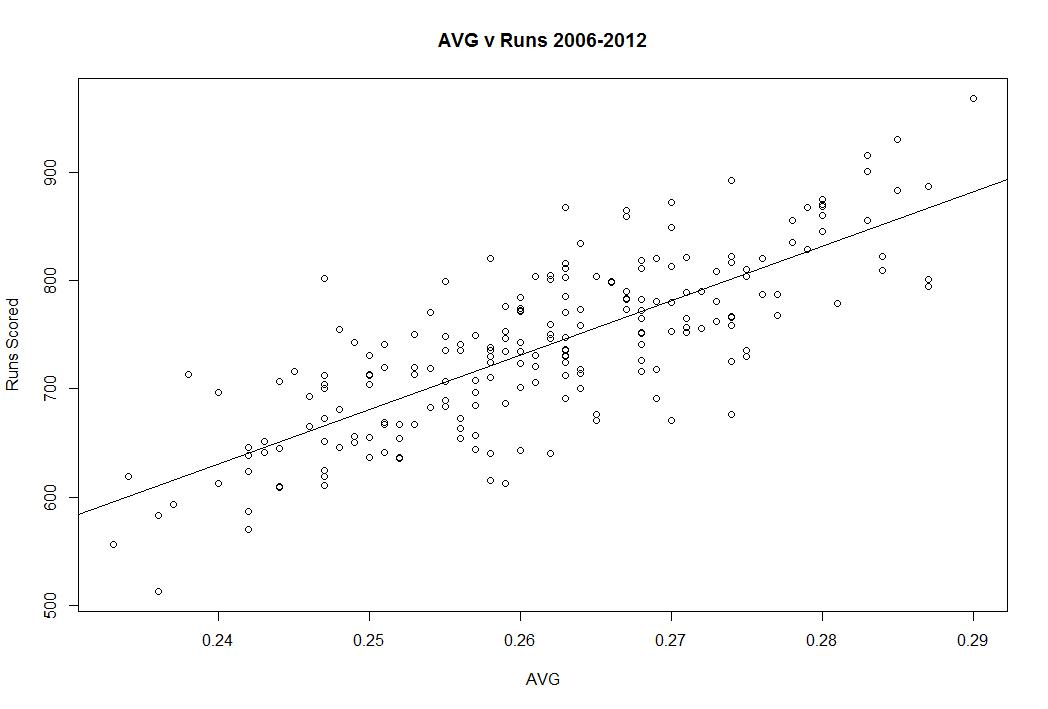
Let’s do something very simple to understand the power of OBP vs AVG. I took each team’s seasons from 2006-2012 and compared their runs scored to AVG and OBP. The correlation is much stronger for OBP than AVG. For batting average the adjusted R squared is .612. For OBP, it’s .7738. In other words, you can explain 61% of the variation in runs scored with batting average and 77% of the variation in runs scored with OBP. OBP is more highly correlated with scoring runs than batting average. Why wouldn’t you want to look at stats that better predict scoring? Here it is in graphical form (the vertical axes are the same):

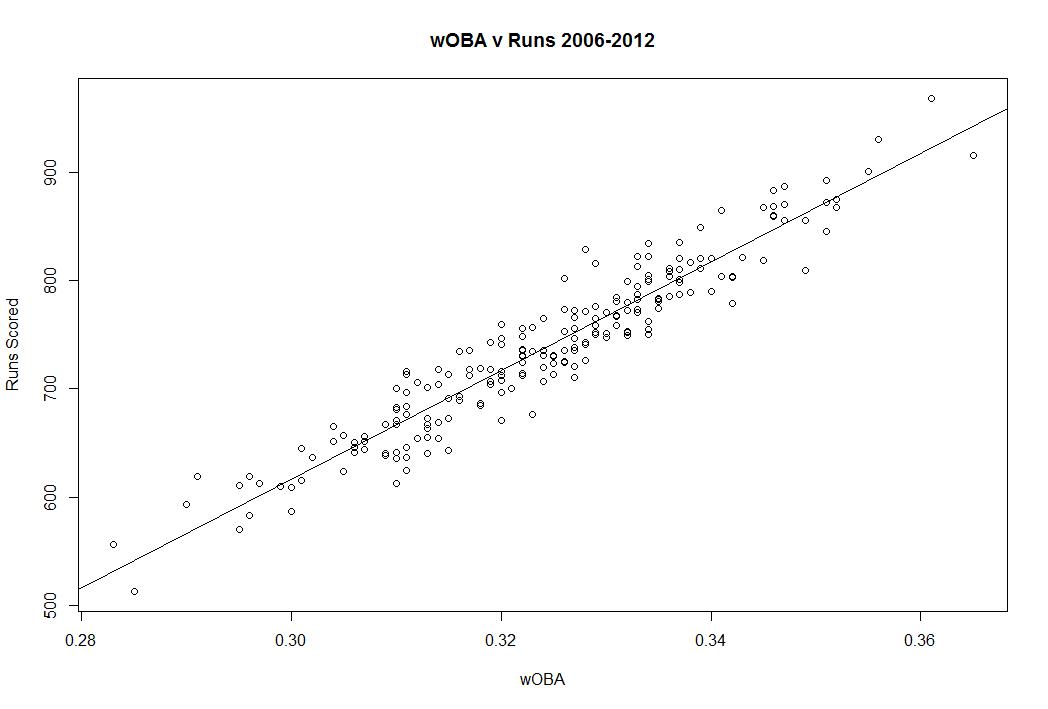
If you’re interested in going further, take a look at wOBA, because wOBA’s adjusted R squared is .9077, which is a lot better. wOBA tells you more about runs scoring than AVG and even more than OBP. Here it is in graphical form:
I think one reason people are resistant to OBP is because batting average is imprinted on the DNA of the game. We know that .300 is a good average and that .400 is iconic. You have a really good idea what each batting average means, but to use OBP you have to learn how to properly adjust your expectations. .300 is a good average, but you don’t really know what the equivalent OBP is. I’m going to help with a simple rule.
The 60 Rule. That’s it. Take a player’s OBP and subtract .060 from it to get it on the batting average scale. The average OBP is about 60 points higher and the standard deviations are similar. This rule won’t be perfect if you’re statistically savvy, but it will allow you to easily interpret OBP.
If a player has a .390 OBP, just drop 60 points and that is essentially as good as a player who hits .330 using batting average. So David Wright’s average last year was .306, but in reality, he was better than that because of his above average walk rate. He’s more like a .330 hitter than a .300 hitter when you factor in the walks if you choose to think in terms of the batting average scale you learned growing up.
If you’re interested in new stats, we have plenty of info in our Stat Primer page, but the key takeaway here is that little steps are important. OBP is telling you exactly what you think batting average should. It’s telling you how often someone gets on base, while batting average tells you how often they get on base when they get a hit in trips to the plate in which they didn’t walk. Which one makes more sense when you put it like that?
Take a look at OBP next time you scan the stats. It’ll help you understand the game a lot better. Ask questions and be curious. If you don’t agree with a statistic, ask yourself why. Think critically. Look at every stat, but OBP is where you should look if you’re interested in the concept batting average is going after.

[…] and why RBI aren’t a good way to measure individual players. We also have a post about why on base percentage is better than batting average and why you should use Weighted On Base Average (wOBA) if you’re really only interested in […]
[…] teams used to focus on batting average. However OBP is well-known to be the more important predictor. Baseball analysts also consider SLG to be […]
i think that OBP alone is also misleading, because often times a batter will get an intentional walk, which is supposed to set up a potential double play – therefore, it would have been better if he would’ve just gotten out himself.
the OBP would then not be an indicator at all of the batter having a “good eye”, unless you only include walks that he actually earned.
similarly, a good indicator would have to take into account which pitchers walked him. If it’s a pitcher with a high walk count, then perhaps the batter’s OBP should only be upped 1/2 a point, for example.
i realize statistics aren’t everything, and obviously there’s the human aspect of the game, but they should be as accurate as possible
thanks