The Nine Pitchers Who Slowed Their Pace The Most in 2013

That’s a long headline but a simple topic. Which pitchers have increased their average time between pitches the most this year? Below I will present the The Nine pitchers with the largest increases from 2012 to 2013 among those who have thrown 100 innings in both seasons. I will also provide some descriptive stats about the entire sample because for whatever reason, I find “Pace” to be very interesting. Pace is housed over at FanGraphs and here is a link to the current rankings. For 2013, the slowest qualifying starter is Jeremy Hellickson who takes 25.7 seconds between pitches. RA Dickey is the quickest at 17.8, with league average at 22.6.
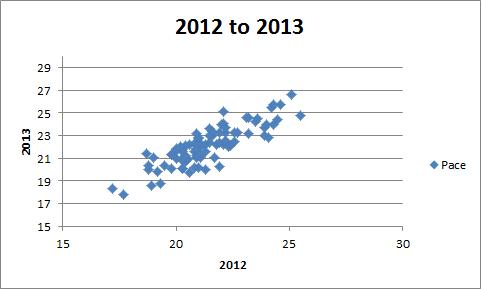
You can see that Pace is pretty consistent and that last year’s pace is a pretty good predictor of this year’s pace with an r squared of .72, meaning that about 72% of the variation in 2013 Pace can be explained by 2012 pace. Below are the players who most buck that trend.
| Rank | Name | Pace Diff | K/9 d | BB/9 d | ERA d | FIP d |
| 9 | Jerome Williams | 1.8 | -0.6 | 0.9 | 0.22 | 0.69 |
| 8 | Dillon Gee | 1.9 | -1.2 | -0.1 | -0.50 | 0.25 |
| 7 | Kyle Kendrick | 2.0 | -1.4 | -0.7 | 0.55 | -0.34 |
| 6 | Madison Bumgarner | 2.0 | 0.3 | 0.7 | -0.53 | -0.26 |
| 5 | Adam Wainwright | 2.1 | -0.1 | -1.2 | -1.36 | -0.77 |
| 4 | Anibal Sanchez | 2.1 | 2.1 | 0.4 | -1.41 | -1.19 |
| 3 | Jarrod Parker | 2.3 | -0.6 | -0.2 | 0.24 | 0.82 |
| 2 | Joe Blanton | 2.7 | -0.5 | 0.5 | 1.41 | 1.21 |
| 1 | David Price | 3.0 | -1.5 | -1.2 | 0.73 | 0.26 |
Positive numbers indicated an increase in 2013 over 2012. For example, Anibal Sanchez’s K/9 is up 2.1 and his FIP is down 1.19. What’s interesting is some pitchers who have slowed down have improved and some have gotten worse. Some have added Ks and BBs, some have cut both, and some have gone in opposite directions. Pretty much, this doesn’t seem very useful in predicting performance.
It’s interesting, though, that on this list we have some elite pitchers and some back end guys. I’m not sure if there is a clear take away from this other than that Pace probably doesn’t correlate that much with anything that has to do with performance on a broad scale and that it matters a lot to each pitcher but it matters in different ways. Let’s just take a quick look at FIP- up against Pace for 2013 qualifiers to illustrate that point:

Oh well, I’m still going to pretend it matters. It matters to fans, at least.
Scouting the Tigers Pitchers…At the Plate
With a three game series beginning tonight against the Mets in New York, the Tigers pitchers will be asked to bat for just the third time all season (they’ll get one more shot in the season’s final series). Through some amazing quirk of scheduling, Fister and Sanchez pitched in the two game stints in Washington and Pittsburgh, so we’ve only see them at the dish this year. We know, through science, that Justin Verlander is likely the worst hitter currently in the major leagues and he won’t get a shot to redeem himself this time around, but we will get a look at Scherzer and Porcello in addition to Fister. The question that you’re likely asking, along with the Mets’ pitchers (especially Harvey) is clear. How in the world can we pitch to these guys?
Let’s start with some basic offensive numbers for these pitchers in their careers. For what it’s worth to you, I’ll include Fister’s 2013 numbers separately as well:
| Player | PA | AVG | OBP | SLG | K% | wRC+ |
| Scherzer | 86 | 0.162 | 0.205 | 0.189 | 25.6 | -3 |
| Porcello | 16 | 0.214 | 0.214 | 0.214 | 37.5 | -3 |
| Fister | 15 | 0.308 | 0.308 | 0.385 | 26.7 | 111 |
| Fister ’13 | 4 | 0.667 | 0.667 | 0.667 | 0 | 286 |
Max Scherzer
Scherzer’s numbers aren’t good, but he’s the only one of the group to take a walk and he limits the strikeouts compared to the group as well. He’s definitely the Tigers pitcher who works counts the best and he does have a BABIP that’s a good deal below average (.231). I’m not saying he’s going to break out, but he hits a lot of ground balls and doesn’t chase bad pitches too often. Some of those hits should start to fall in.
You can see that he works the middle of the field nicely and doesn’t get pull happy:

The real key to getting Scherzer out is to avoid his hot spots up and out over the plate. If you put one there, he’s likely to smack it to right for a hit. You need to come middle in or low and away to get him to roll over one to the SS.

Rick Porcello
Porcello burst onto the scene in his rookie year, but has really gone down hill at the dish since then. He doesn’t take his walks and he strikes out too much to have a ton of value at the plate. Just check out his year to year wOBA so far:
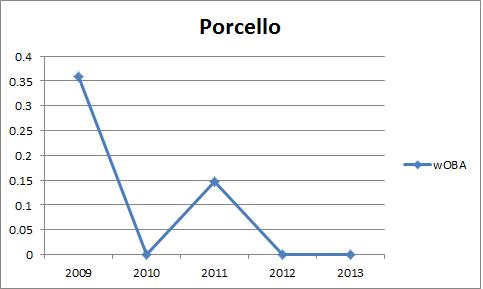
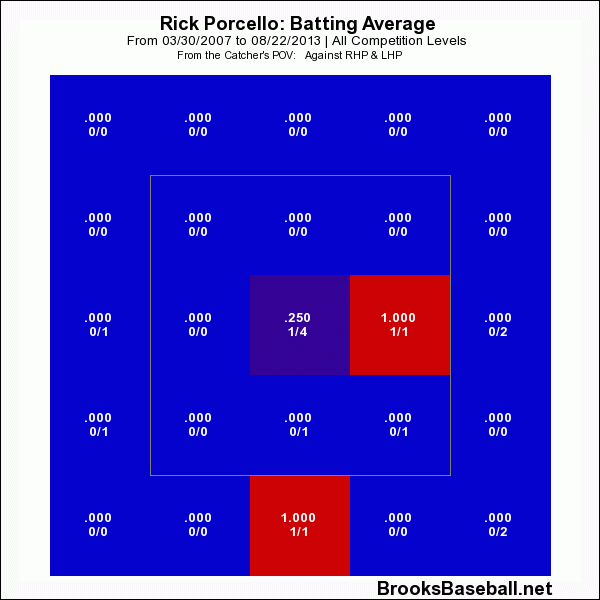
Porcello has shown the ability to use the whole field, but he doesn’t make enough contact for the bat control to play up.

Really the key to Porcello is to pitch him inside. You don’t want to miss away because he will make you pay.
Doug Fister
Fister is a much different story. Fister can really hit, even if he doesn’t have a patient approach, and he seems to be getting better with age. In 2011 he had a wRC+ of 133 and this year it’s 286. He’s made the leap from top 30 hitter to all-time great. He’s Babe Ruth and then some!
To get Fister out, you have to make him put the ball on the ground because if he gets it in the air, he’s going to get on base.
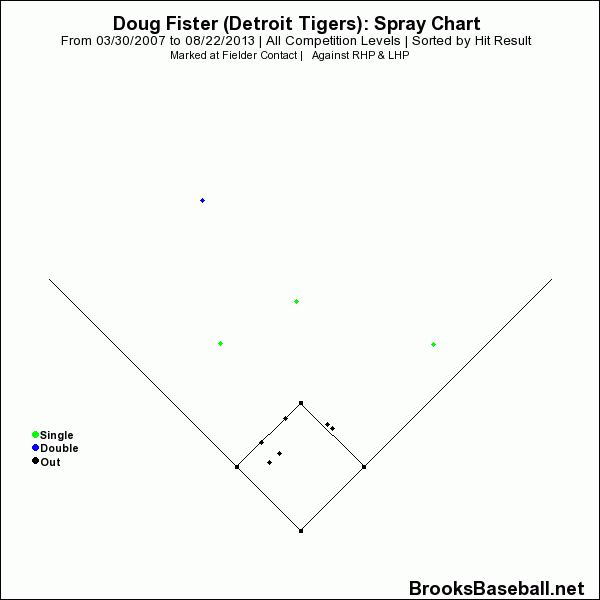
And you really don’t want to miss low and over the plate, because that is where Fister eats.

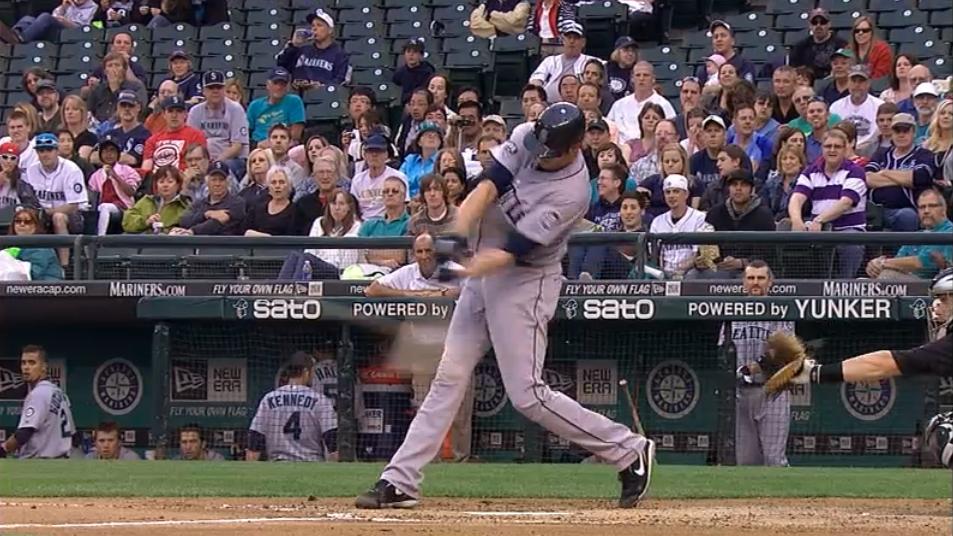
You have to make sure you go up and in or get the ball away from him. Remember, Fister bats left-handed. In fact, Fister seems to have some really nice opposite field gap power based on that spray chart. Take a look at this great swing from 2011. Hey, look who’s pitching!

Fister got an 0-2 fastball down and away from Anibal Sanchez and drove up the gap. Here’s an approximate shot of the ball splitting the fielders.

Fister has become more of a singles hitter as he’s aged, but he’s shown this type of power in the past so you have to be careful.
Scherzer and Porcello are pitchable, but you have to be careful with the big slugging lefty. If you miss to Fister, he’ll make you pay. For a pitcher who is 9 feet tall, this is pretty good form. Notice how he has his head on the ball and isn’t off balance at the point of contact:
Followed by an important discussion:
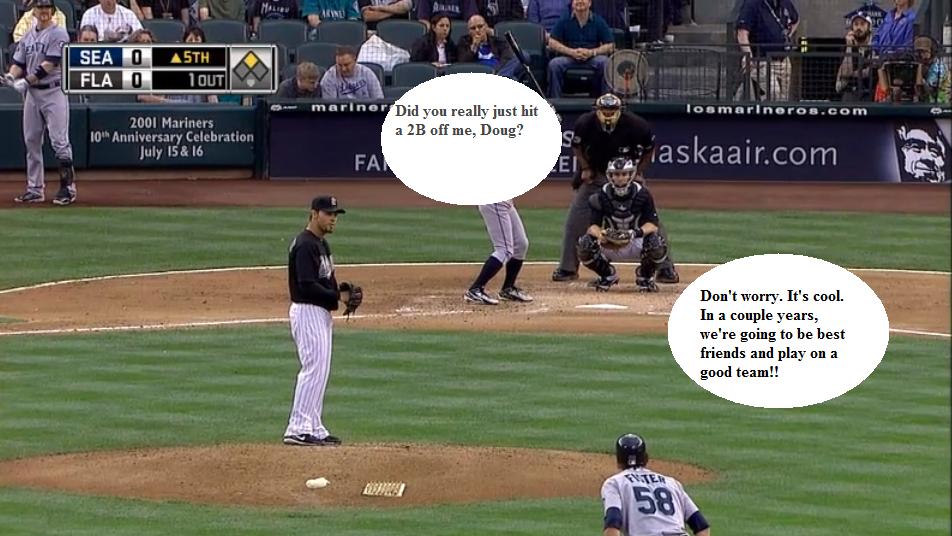
Next came an interview with Fister about why he bats left-handed. “I’m kind of screwed up in a lot of ways,” is the direct quote.

Then Sanchez gave up a hit to Ichiro and Brendan Ryan to score Fister. Fister had a better day than Sanchez, but we’re getting off track. This isn’t a Marlins and Marines game recap.
The key here is that Fister is the Cabrera of the Tigers pitchers and is the one to watch for. Matt Harvey is probably really happy he won’t have to face him on Saturday because Fister has shown the ability to hit the best arms in the game.
The Art of Doubling to the Pitcher

Over at the Community Research section of FanGraphs, I took a look at the only two times this season a player has hit a double to the pitcher. It’s a pretty rare feat and the way in which both doubles happened were very different. It’s a fun read with plenty of screenshots. Hope you enjoy!
The Nine Best Seasons Under 9 Wins
At New English D we’re among the those who wish to see the pitcher win removed from our baseball consciousness. It doesn’t measure an individual pitcher’s skill, but that’s how people use it. A pitcher’s won-loss record is about his performance, but it’s also about his defense, his run support, the other starting pitcher, and the other team’s offense. Also, luck, but I’m fine with luck.
Our most recent podcast covers the topic at length, but evidence and examples can do more to convince you about the flaws of wins than my rambling ever could. The catalyst for this post comes from something I discovered last night when contributing to Brian Kenny’s noble effort to #KillTheWin:
Matt Harvey (Go Heels!) is better in games he doesn’t win than almost every other pitcher in the league is overall. It’s time we get his back.
The rules are simple, these are The Nine best season by Wins Above Replacement (WAR) for qualifying starting pitchers who won fewer than nine games. In MLB history, there are 8286 qualifying seasons from 1901-2012 with 1187 finishing with fewer than 9 wins. These are the best.
9. Cliff Lee, 2012 Phillies
6-9, 211 IP, 3.16 ERA, 3.13 FIP, 4.9 WAR
8. Ken Johnson, 1962 Colt .45s
7-16, 197 IP, 3.84 ERA, 2.80 FIP, 5.0 WAR
7. Dutch Leonard, 1949 Cubs
7-16, 180 IP, 4.15 ERA, 2.71 FIP, 5.0 WAR
6. Bill Gullickson, 1981 Expos
7-9, 157.1 IP, 2.80 ERA, 2.11 FIP, 5.0 WAR
5. Al Benton, 1942 Tigers
7-13, 226.2 IP, 2.90 ERA, 3.07 FIP, 5.0 WAR
4. Steve Rogers, 1976 Expos
7-17, 230 IP, 3.25 ERA, 2.85 FIP, 5.1 WAR
3. Bob Welch, 1986 Dodgers
7-13, 235.2 IP, 3.28 ERA, 2.78 FIP, 5.3 WAR
2. Curt Schilling, 2003 Diamondbacks
8-9, 168 IP, 2.95 ERA, 2.66 FIP, 5.7 WAR
1. Nolan Ryan, 1987 Astros
8-16, 211.2 IP, 2.76 ERA, 2.47 FIP, 6.6 WAR
Wins generally correlate with good performance, but there are many cases in which good performances don’t result in wins and bad performances do. Pitchers can improve their likelihood of victory by pitching well, but they can’t guarantee it. Wins aren’t a completely useless measure of pitcher performance, but when we have so many statistics that are dramatically better, why should be place any importance on wins?
Here’s some evidence writ large. If we use Wins to predict three other statistics, WAR, ERA, and FIP, it doesn’t look good for wins.
| WAR | ERA | FIP | |
| Adjusted R Squared | 0.38 | 0.24 | 0.13 |
What these numbers tell us is that 38, 24, and 13% of the variation in these numbers can be explained by variation in wins. Let’s give Wins the benefit of the doubt and pick WAR for the graph. There is a clear trend, but there is a lot of variation in WAR that wins can’t explain. The sample size here is over 8,000. You can be both terrible and amazing and achieve the same number of wins.

It’s time to #KillTheWin.
