
Anibal Sanchez has not had a good season. It hasn’t been horrible or anything, but he’s been a below average pitcher for the first time since 2008/2009. He has a 4.82 ERA and 4.47 FIP (120 ERA-, 113 FIP-). He’s clearly been better lately than he was earlier on, but it’s not like he’s been the dominant Sanchez we came to know and love. It’s easy to recognize the direct cause of his poor performance: He’s allowing too many home runs. He’s allowed 1.51 HR/9 or 25 total. Both are career highs. Heck, he only allowed 33 HR from 2012-2014. It’s a problem.
But if you look at everything else, it’s not a bad stat line. His strikeouts don’t match the dizzying high of 2013 and the walk rate has come up from his 2014 mark, but it’s not like he’s been susceptible to anything other than dingers. We’ve seen some hard contact, but his double and triple rate hasn’t seen quite the same concerning spike. It’s not 100% about dingers, but it’s mostly about the dingers.
Before we get into it, I want to play with his stats a little bit. Sanchez had an insanely low HR rate in 2013 and 2014 and it’s wrong to predict he’d keep it up. But it’s been low in his career, around 0.8 HR/9 even after the shock of the 2015 season. To give you an idea, the difference between 1.5 HR/9 and 0.8 HR/9 over his 149.1 innings this year would be about 11 HR.
Sanchez’s current RA9 is 4.94. His current ERA is 4.82 and his current FIP is 4.47. On average, a home run is worth about 1.39 runs (i.e. the run for the batter plus the average number of runners on base). If we subtract 11 HR * 1.39 runs per HR from his 82 runs allowed, his RA9 drops to 4.02! If you do the same with his earned runs, you wind up at 3.90. The funny thing here is that Sanchez has allowed a higher proportion of earned runs to runs than is normal for a pitcher (roughly 92% of the league’s runs are earned per season).
I would generally tell you that ERA is pointless and RA9 is better, but just for reference, if you take a 4.02 ERA and translate it to an ERA based on the normal share of ER to R, you get 3.70. In other words, if Sanchez was doing everything the same, except he was allowing a HR/9 typical for his career you might expect 3.70 ERA. If we do the same thing with FIP, we wind up at 3.52.
This isn’t a perfect method, but the unusual number of home runs is basically responsible for about a full run per 9 innings on Sanchez’s stat line. That’s pretty crazy. His ERA- would be 92 and his FIP- would be 90. That’s a huge difference. You don’t even have to regress Sanchez back to his great 2013 and 2014 numbers, you just have to take him back to his career norms. The difference is one home run every other start. Baseball is really that close sometimes.
Now, I am absolutely not trying to argue that Sanchez’s HR trouble is randomness or bad luck. Maybe a portion of it is, but he has definitely served up some bad pitches which got crushed. But let’s ask the important question. Why has he allowed so many more home runs that normal? What’s causing this insane spike?
First, he’s allowing more fly balls, about 4-6% more than he typically has. That translates to about 21 extra fly balls this year. Even if you apply a normal HR/FB% to his fly balls, you’re still only explaining some of it, and like I said, I don’t really want to just throw regression on this and call it a day. More fly balls, and those fly balls are going for home runs more often. In April, I looked at his first six dingers and pointed out they were basically just bad pitches in otherwise fine outings. He happened to get tagged hard when he got tagged rather than occasionally getting away with one.
So I set out to watch all of his 2015 home runs. I won’t include GIFs for them all because that would take forever to load, but I do want to point out a few things.
First things first, they were all pretty much meatballs. I wish we had an easy measure of how often a meatball goes for a home run and then how many total ones he’s thrown. Maybe 50% of meatballs usually go for dingers and he’s just allowing that on 80% this year. Or maybe he’s allowing homers on 50%, but he’s throwing a lot more bad pitches.
One thing we can say with some confidence is that this isn’t a bad pitch selection problem, because he’s getting tagged when he’s throwing the ball much differently than it’s being called. If McCann calls for one low and away and Sanchez hangs one up and in, that’s an execution problem not a game plan problem.
So there are essentially two ways to look at this. Is Sanchez locating pitches poorly, leading to pitches that are easier to hit, or is he throwing with worse stuff, making pitches easier to hit?
Let’s think about some ways to look at this. Thing number one is that Sanchez’s contact rate allowed is virtually identical to 2014 and most of his other seasons (2013 is the awesome outlier). So when batters swing, they are hitting the ball as often as they used to. So it’s not that it is easier to make contact with in the first place. And they are actually swinging a bit less often against him, suggesting that they may even be laying off his most unhittable stuff. Presumably, this is a damage on contact problem.
So let’s run some quick numbers. Here’s is wOBA on contact in each of the last four seasons. I used basic wOBA, which simply rounds the weights, so something like 0.888 for the value of a single is just 0.9, and all it does is save time with the calculations. Anyway:

So when hitters make contact against him, the results were way down for hitters last year and are way up this year compared to his 2012-2013 baselines. We were expecting to see this, of course, because we know about the dingers. So let’s try something. Let’s take those 11 HR we think are weird and let’s turn them into doubles. Let’s see what happens.
His wOBACON for 2015 goes to .361. That’s roughly a six run difference for the season, which gets us about half way to that 3.70 ERA we mentioned earlier. If they all get turned into outs, it’s goes down to .331, or about 17 runs!
Okay, so this is all about what’s happening for those roughly 440 batted balls and why he’s allowing more damage on them this year than we’ve seen in years past. Let’s use 2013 as a test case. Let’s compare his pitch locations on batted balls for 2013 and 2015.
But first, let’s take a peak at his platoon splits for those years.
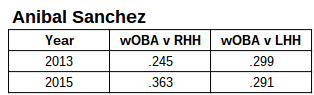
In that case, let’s only look at right-handed opponents.
2013:

2015:
 That doesn’t tell us a whole lot. The distribution is a little different, but we can’t really see a clear pattern. The batted balls generally seem to be thrown to the same spots against righties. How about the movement or velocity? Here are the average velocity and vertical and horizontal break. Let’s look only at the fly balls, however, because we care about how these balls are being hit. Remember this is on pitches to righties that were put in play.
There are some small samples, so trust me when I dismiss any real changes here. The average pitches that righties made contact with in 2013 are similar in shape and velo to the ones they hit in 2015:

So I have one last idea. Let’s compare his 2015 HR to the average marks for 2015 fly balls. Again, just righties. I’m not going to bother showing it because the sample is small and there’s nothing to see. And I’ve already probably carved these into samples that are too small, so digging into granularities any more will only confuse us.
I hate to do this to you, but we’ve come at this from every angle and I can’t explain it. Anibal Sanchez’s bad season is based entirely on a home run problem that I cannot explain. His pitches aren’t worse overall. He’s not throwing them to different spots. He’s not throwing them very differently. There is no good reason why this should be happening.
That seems like a terrible answer to our question because we have all watched him give up a ton of home runs, but we’ve also watched him do this thing where he totally cruises for 12 batters after allowing a big dinger. He’s himself, and then he’s terrible for a pitch, and then he’s back to normal. This is the weirdest home run problem I’ve ever seen. I really wanted to find something because I want to be able to point to something as a place he needs to improve to get back on track, but this looks like some cosmic intervention where his ability just leaves him for a moment at a time.
I wish I had something better than this, but I don’t. Anibal Sanchez is giving up a lot of home runs. Sometimes that just happens to a guy who is pitching fine otherwise. I won’t try to say they aren’t his fault, but I do think the best explanation we have for what’s happening is that these are just isolated moments of failure rather than a pattern. He’s not doing something systemically that’s leading to this adverse outcome. It’s just happening. Baseball is often wonderfully mysterious, but in this instance, it’s mysteriously cruel.

[…] By Neil Weinberg […]
[…] Weinberg took a look at every one of the home runs Sanchez has allowed this season, did a deep dive into the issue, and could not pinpoint a reason […]
[…] what the problem is either. I found this article by Craig Edwards (FanGraphs), and this article, by Neil Weinberg (New English D), who both took a deep look at Sanchez’s 2015 […]