
During the middle part of the season, much was made over the Tigers inability to score runs late in games. I don’t have the exact numbers, but they scored many fewer runs in the 7-9th innings than they did during the earlier ones. A lot of people were concerned that the Tigers weren’t clutch, or for some reason gave away innings at the end of the game. At the time, my view was pretty much in line with most of my views on statistics. The overall number was more important than the split. At the time, the Tigers were a top five offense in terms of run scoring and in terms of other stats like wOBA and wRC+. Or even basic numbers like OBP and OPS.
The Tigers were a good offensive and the inning to inning variation didn’t seem meaningful to me. Now that we have some more data, let’s take a look. Below are the Tigers runs per inning compared to the league average AL club.
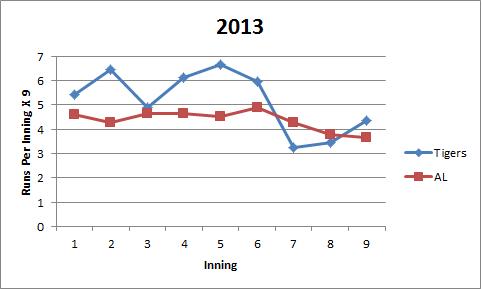
You’ll notice I’ve multiplied the runs per innings times nine so that you can more easily interpret the numbers. Entering August 30th, the Tigers have scored 5.2 runs per game and have five innings above that pace and four innings below. The entire AL scores 4.4 runs per game and has a four/five split above and below.
Several things jump out. First, it appears to be very common for teams to score fewer runs in the final three innings. Relievers allow fewer runs per inning because they don’t have to pace themselves like starters – this is well established. Second, you’ll notice that the Tigers outperform league average in 7 of 9 innings. Third, you’ll notice the 7th inning is the only inning in which they seriously under-perform.
But I’d like to call your attention to the 3rd inning. The Tigers have a drop off in production between innings 2 and 4 that otherwise goes unexplained. What is it about the 3rd inning that causes this? Nothing. That’s silly. Let’s now look at the percentage of innings in which the team scores – in other words controlling for the big innings. How often do they score?

This graphic tells the same story. The Tigers score frequently and they score a lot, with both a little lighter on the back end.
What does it all mean? First of all, they’ve improved in the late innings lately and limited some of the early season damage. In big enough samples, things tend to balance out. Second, runs scored are runs scored. They count the same in the first and the eighth, so what does it really matter?
They are outscoring their opponents by quite a bit. Does scoring less often in a certain inning reflect a real difference in ability? I can’t see how it would. What accounts for the difference between the 3rd and 4th innings? What about the the 6th and 7th? Their performance goes up and down, so it’s not attrition. They score better than average in the 9th, so it’s not like they wilt under pressure, because the 9th should have the most pressure because you’re running out of outs.
I don’t really have a good explanation, but I’m not sure we need one. The Tigers score a ton of runs and the distribution is balancing out to some degree. I really just wanted to put the numbers out there and let you make up your own mind. I don’t think the distribution is meaningful, but you might. Throw out some ideas in the comments section if you’re so inclined. They’re comfortably baseball’s best offense, must they also be the most even keeled one?
