
If you happen to have just emerged from a year-long slumber, you might not be aware that Nick Castellanos now hits baseballs pretty well. So far this season he has a 162 wRC+, and while that’s propped up by a sure-to-regress .398 BABIP, there is a very real power spike driving the improved offense that dates back to late June 2015.
It’s not clear if Castellanos will be a 115 wRC+ or a 140 wRC+ guy when things settle, but he’s definitely done enough to convince me (and most people) that he’s taken a big step forward with the stick after two seasons of a 94 wRC+.
But while Nick was unimpressive with the stick during his freshman and sophomore campaigns, the big problem was his glove. If you can run a 95 wRC+ as a 22-23 year old third baseman while playing solid defense, you’re a pretty promising and useful player. But Nick didn’t play solid defense, he played somewhere between awful and not good defense over his first two seasons, and unfortunately defense typically doesn’t improve as players age. You often grow into your offensive potential, but if you can’t field when you debut, chances are you won’t be able to field throughout your career.
That being said, Castellanos’ early struggles were unusually pronounced and with hard work and good coaching, we figured some of it could improve. After all, his arm is fine and he doesn’t have hands made of stone. Any scout worth their salt would put a below average grade on his glove, but you had to watch him a decent amount to really see the magnitude of the flaws.
Yet there has been talk this year that Castellanos looks like an improved defender. I’ve heard it from announcers, beat writers, and fans throughout the year as he’s made a number of good plays at the hot corner. Personally, I’m not sure I would have taken this position – I think he looks about the same as last year – but it’s not like I’m inventing a strawman just to tear it down. This is an opinion that’s out there in the world.
The metrics disagree (caveats in a moment). In 281 innings, he has a -4 DRS, -3.1 UZR, and a .650 revised zone rating. That RZR looks a lot like his 2015 mark and the DRS/UZR look like his 2014 numbers. So either he’s as bad as last year or he’s been as bad as he was in his disastrous rookie year. If you look at the Inside Edge numbers, he’s doing poorly on balls in the 40-60% bucket, and no better on balls marked 60-90% or 90-100%. In other words, statistically he’s been as bad or worse than his previous defensive seasons.
Now, some caveats apply to the data. First, 280 innings is not a sufficient sample size for a couple of reasons. For one, there is measurement error in these statistics that requires a large sample to even out. We haven’t yet built metrics around Statcast, so the numbers still rely on humans to input data into an algorithm and humans sometimes get the coding wrong. Those errors shouldn’t be biased in one way or another, but you need more than 300 innings before you can discount it.
Second, most defensive plays are very easy which means that fielders separate themselves based on a small number of difficult plays. Even a great defender might have bad numbers over a couple of months simply because of when their misplays occurred. This is even more pronounced in an era of shifting, in which a number of plays get thrown out of the sample. Third, defensive metrics lag a bit so if you think he’s made a zillion great plays in the last two days, it won’t necessarily show up right away.
To be clear, I am not saying this early season data indicates Castellanos is definitely still bad at defense. I am saying the numbers so far aren’t showing anything different than his first 2,300 innings. Basically, while there is statistical evidence of an offensive breakout, there is no early indication that his defense has improved.
One thing I like to do with defense is to take a step back and work through the question in a rudimentary way. Yes, Castellanos’ runs saved numbers aren’t good, but it can be instructive to look at a deconstructed version that looks only at hits/outs rather than hits/outs and run values. Let’s dive in.
Let’s carve the infield up into zones based. Let’s say the third baseman is responsive for covering 45% of the left side of the infield (we’ll also do 35%) and let’s look only at ground balls. Line drives might matter, but some are going to be totally uncatchable too. This is meant to be basic, remember. The following is for all Tigers third basemen, of which Nick covers most of the innings. The first table shows 45% of the left side and the second shows 35% of the left side, starting from the line, and reports on ground balls only. There are no controls for anything else (i.e. were the hits singles/doubles, how hard was the ball hit, which balls didn’t get fielded, batter handedness, pitcher quality, etc). Errors aren’t included, but they have been basically constant.

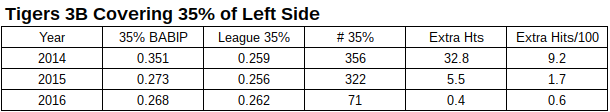
If you look at these tables, the numbers are striking for 2014 and 2015. The Tigers allowed many, many more hits on balls in play than the average (the league includes the Tigers, FYI). This was especially true in the 45% category. This year, the numbers are much better in the 45% category and a little better in the 35% category from last year and much better from 2014.
Let’s unpack this. Now keep in mind, the shortstop and pitcher are involved here. If Igleisas makes a play way into Castellanos’ territory, this method won’t know the difference. The metrics are smart enough not to count that in Nick’s favor (it also won’t penalize him for it). Realistically, what we’re seeing here is the Tigers getting better at pinching off the 5.5 hole between the two fielders from 2015 to 2016.
During 2014, 33 of the 45 extra hits occurred in the 35% zone and 12 occurred in the 35-45% zone (give or take). That’s 74/26 split. In 2015, it was a 29/71 split. This year, it’s a 24/76 split. What does that mean? It means that 2014 was a disaster across the board and that the problem area in 2015 was mostly to Castellanos’ left/Iglesias’ right. Given that we know this is where Iglesias struggles, it makes perfect sense.
Let’s carve out that middle zone by itself:

In 2015, the Tigers got much better at turning batted balls into outs in the 35% zone than they were in 2014. This year, they maintained they’ve gotten a little better in that zone but they have gotten a lot better in the 35-45% zone between the third baseman and the shortstop after being really bad in 2014 and worse in 2015.
I don’t know if this is Iglesias getting better to his right or Castellanos getting better to his left, but there’s definitely something good happening here.
Does this mean the metrics are wrong and Castellanos is actually getting better? No, not yet. For one, this could all be Iglesias/Romine. Two, this doesn’t include line drives. Three, and most importantly, we didn’t control for the actual difficulty or run values of the plays. In other words, the raw number of hits and outs look really positive, but if Nick’s misplays have been particularly bad and his good plays haven’t been particularly good, it’s perfectly reasonable and correct for his metrics to look the way they do. After all, the Tigers haven’t cracked league average in any of these zones in terms of out rate, so if the they’re screwing up easy balls this would make a lot of sense.
What I think this exercise shows is that there is an inherent logic in thinking Castellanos has been getting better. There are fewer balls going for hits near him. From 2014 to 2015, his metrics improved a lot, which is pretty consistent with the data shown here. From 2015 to 2016 (sample size warning) the metrics haven’t gotten better but this data has. You can read this to say that 1) his metrics will improve with a bigger sample, 2) Iglesias is getting better, 3) the added complexity of the metrics is seeing something this doesn’t. It’s probably some from each.
All told, I do think there are positive signs in the data for Castellanos’ defense, but I trust the metrics (even in small samples) which say it hasn’t shown up in the totality of his performance just yet. He can simultaneously improve and not yet show the fruits of that improvement in his numbers. It’s the same as a player dramatically improving the quality of his contact but still not getting hits for a few weeks. It’s possible that Nick is better and he just hasn’t translated it into results, or it could simply be that the metrics are smart enough to see beyond BABIP, or that it’s Iglesias who is truly improving.

[…] By Neil Weinberg […]
[…] By Neil Weinberg […]