One thing that’s really important to understand if you want to properly manage a bullpen is the concept of leverage. That is, the game is on the line more in certain moments than in others. Tie game, bottom of the 8th, runners on second and third? That’s high leverage. The difference between a hit and an out is significant. Five run lead in the 6th with the bases empty? That’s low leverage. A hit or an out won’t make much difference in the outcome of the game.
Ideally, you want to put your best relievers into high leverage situations because that gives you the best chance to escape without much damage. Of course you want to consider workload and matchups, but in general Good Relievers = High Leverage, Bad Relievers = Low Leverage is what you want to see.
So I thought in might be interesting to see how Ausmus has been doing in terms of using his relievers based on leverage. So I grabbed the average leverage index of each reliever’s appearances (min. 20 IP) and made a couple of graphs.
Two quick notes. First, I removed Greene’s starts for obvious reasons. Second, this is the average leverage index of the total appearance because I wasn’t able to easily grab the leverage index at the entry point for each reliever. As a result, if you come into a game with the bases loaded in the 8th, get out of the jam, the team scores a bunch, and then you get three more outs, you are going to get a little bit screwed over. It’s a proxy, but I think it works fine.
Also keep in mind that the relievers have made a different number of appearances, but for your sake I’m putting them all on one graph. So that means Rondon’s line ends earlier than K-Rod’s. This is not by date, it’s by appearance number.
First, let’s look at full season averages. In other words, take the leverage index of each appearance and create an average for all of the appearances up to that point:
This is a good demonstration that K-Rod is clearly the guy Ausmus turns to in high leverage moments, but the reality is that his average is buoyed by the fact that he almost never gets mop up duty. Most save situations are reasonably high leverage, but it certainly helps that he doesn’t get many six run games. You can also pinpoint the moment when Greene became a higher leverage option and Lowe, Rondon, and Ryan stopped getting big chances.
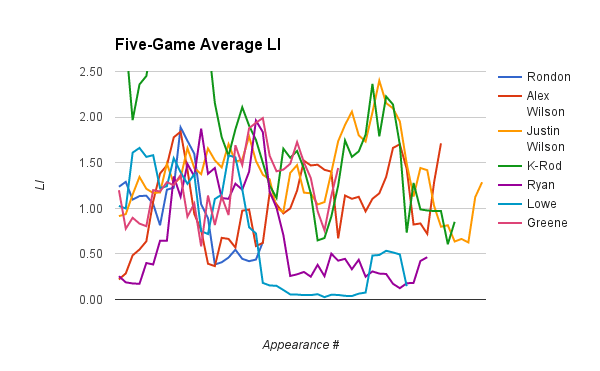
But this graph is a little less helpful than you want it to be, so let’s try something else. Here are the rolling five-game averages starting at appearance five.
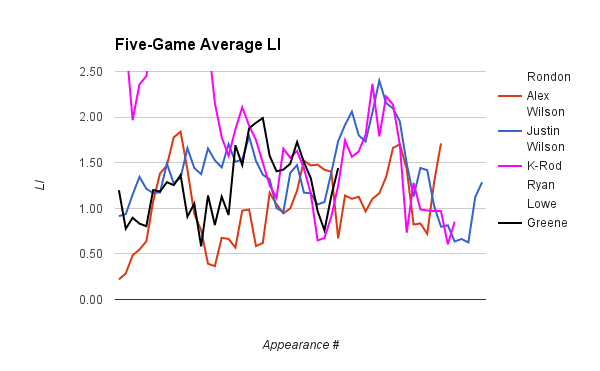
This gives you a better sense of Ausmus’ mood. He’s obviously hasn’t had much faith in Lowe and Ryan lately, but this gives you a better sense than Alex Wilson and Greene are getting high leverage chances just as much as K-Rod and Justin Wilson lately. I know it’s a bit chaotic, so let’s just look at the current top four guys. I changed the colors to make it easier.
We judge managers on individual decisions, but in the aggregate it’s pretty clear that Ausmus has figured out who his best four relievers are. He might still pick the wrong one at any given moment or inexplicably decide trailing by one run is much different than being tied, but at the very least he knows which of his guys are good.
It’s a low bar, but it’s the one that’s been set.


[…] By Neil Weinberg […]
[…] By Neil Weinberg […]
It seems to me that Rondon has turned a corner recently, and has actually been entrusted with higher leverage assignments of late, such as his last appearance in Chicago. With Greene struggling and now A Wison apparently running out of gas, I wouldn’t mind seeing what Bruce could do in the 7th or 8th inning of a one run game.