How Was The Game? (May 28, 2013)

Baseball as it should be, with an unfortunate ending.
Pirates 1, Tigers 0
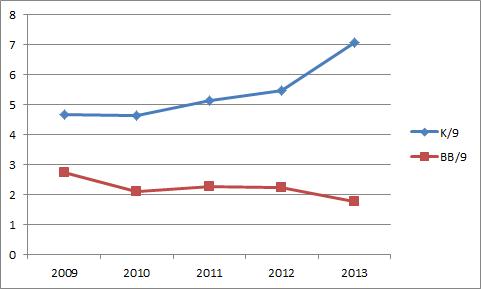
I’ve been banging the Rick Porcello (2-2, 51 IP, 5.29 ERA, 3.93 FIP, 0.7 WAR) drum pretty hard for a long time, and as recently as two weeks ago, and it was so much fun to watch him walk out onto the mound after a rain delay tonight and deliver the best performance of his career. He was brilliant from the start and finished with 8 innings, 3 hits, 0 runs, 1 BB, and 11 K. Only two balls were hit in the air against him all night, both of which were caught. The three hits were groundball singles up the middle. Nothing else of any substance came off the bats of the Pirates hitters and Porcello (as you can see below) continued his march toward his breakout year.

For their part, the Tigers offense made him sweat and didn’t deliver anything, even into the 11th inning, when Neil Walker’s solo HR gave the Pirates a 1-0 lead that would hold.The loss gives the Tigers a 4-2 homestand and a 29-21 record so far on the year as they pack up and head to Pittsburgh to play the second half of the home and home series. Anibal Sanchez (5-4, 64.1 IP, 2.38 ERA, 1.78 FIP, 2.8 WAR) will start game one Wednesday looking to continue his great season and keep his near no-hitter stuff going.
The Moment: Porcello strikes out his 11th batter to set a new career best.
Jhonny Peralta Turns 31 During a Great Season

Today is Jhonny Peralta’s 31st birthday. Most major league baseball players have their best seasons at or before they turn 30, but Peralta might be making an attempt to buck that trend. His best MLB season to date was 2011 in which he accumulated 5.0 WAR, while his best offensive season was 2005 in which he he provided 136 wRC+. I separate the two because this post is about Peralta at the plate, so his considerable improvement according to the defensive metrics over the last few years is worth separating out. Let’s take a quick peak at Peralta in 2005 and 2011:
2005: .292/.366/.520, 136 wRC+, 4.4 WAR (570 PA)
2011: .299/.345/.478, 122 wRC+, 5.0 WAR (576 PA)
His best offensive season was 2005, when he was 23, and his second best was in 2011 when he was 29. At 31, he is making a run at his best season yet. So far, he’s hitting .341/.392/.500, 139 wRC+, 2.1 WAR (195 PA). If we assume he will play 150 games based on career norms, he is set to accumulate career best 7.0 WAR.
But he likely won’t keep up this pace because this is a borderline MVP pace and he’s never done that before and players generally don’t get significantly better after age 30. A player’s performance is also not uniform over an entire season and it would be wrong to assume he will play at this pace for the rest of the year simply because that would be unlikely even if he did get tangibly better.
One of the reasons Peralta isn’t going to keep this up is because he has a very high, unsustainable Batting Average on Balls in Play (BABIP), which is a statistic we associate with luck. The standard BABIP rule of thumb is that .300 is where you expect most players to converge toward, with better hitters maintaining numbers in the middle .300s. The idea here is that when you put the ball in play, you only have control over how hard you hit it and the precise location is outside of your control. Sometimes you’ll smoke a baseball and it will be caught and sometimes a bloop hit will fall. In general, these take a a couple thousand plate appearances to balance out.
This is not to say that hitters can’t influence their BABIPs with their approach and talent level, but rather that BABIP will regress toward a player’s career norm and that small sample BABIPs can lead you to make mistaken predictions.
Jhonny Peralta’s BABIP in 2013 is .414. That’s very high. His career BABIP entering 2013 was .310, meaning it is unlikely that Peralta will be able to maintain his high BABIP, and with it, his current level of production. It’s possible that he got better, but it is not possible his true talent level is now a .414 BABIP.
The highest BABIP among active players is .367, with a number of the games’ best hitters in the .330 to .360 range. The highest modern day BABIP is Ty Cobb, coming in at .378. League average BABIP for non-pitchers over the last 10 years hovers between .294 and .305.
This is all by way of saying that Peralta’s early season success isn’t around to stay. He’s still very capable of having a great year, but it isn’t going to look like this, don’t fool yourself.
But as I gathered my thoughts last week and discovered his high BABIP, I thought, “Meh, a high BABIP post isn’t interesting. He’ll regress back toward career norms and will have a solid, 2011 type season. Nothing wrong with that, but not super interesting to write about.”
Well, then I thought to myself, perhaps I’m missing something. Perhaps Peralta’s good BABIP luck is hiding an actual improvement in his skills. Maybe he’s gotten better and luckier in his 31st year on Earth.
Peralta is walking and striking out at rates almost identical to his career rates and his Isolated Slugging Percentage (ISO) is even more identical to his career line. His triple slash line is equally buoyed this year by about 70 points all the way around (74/62/75):
Career: .267/.330/.425
2013: .341/.392/.500
If you erase the BABIP increase, he’s pretty much the Jhonny Peralta you knew. So how much, if at all, is the BABIP increase a change in skill?
Wait a second! Peralta is doing something different if you look at the results:

Peralta is hitting more line drives and more groundballs at the expense of hitting the ball in the air. This is important because line drives and groundballs are more likely to go for hits than flyballs, which could actually make his BABIP shift reasonable in direction if not in magnitude. In other words, the balls are coming off Peralta’s bat this season on a different trajectory that they did in the past. This could be something.
If we look at his spray charts from April and May from 2012 and 2013 we notice he’s using the lines more effectively this year, but the comparison I want to show you is the one between 2010 and 2013 because it shows the difference between a flyball heavy approach and a groundball heavy approach as you can divine from the graph above:
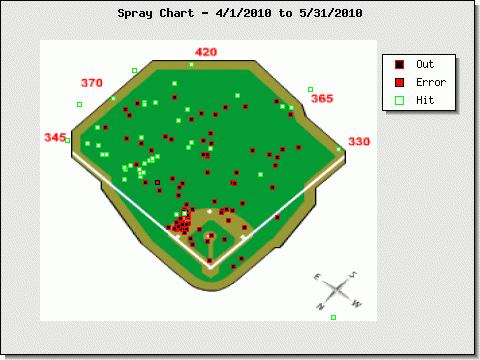
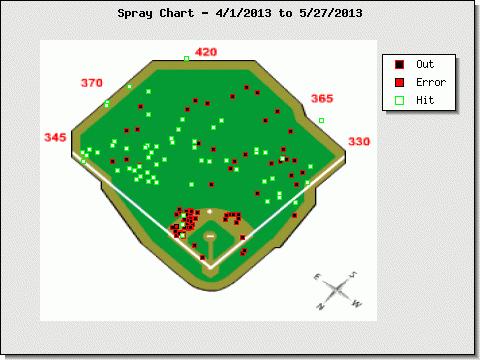
What we see here is that as Peralta has changed as a hitter, he has started to get hits to right field. Everyone knows that. He’s definitely learned to go the other way, but what is also striking to me is that he is also making fewer outs in the air to left field. He’s making fewer outs in the outfield period. He’s getting a band of hits in front of the outfielders in a way that didn’t happen in 2010.
So while Peralta’s numbers this year are great, his high BABIP means he’s not going to keep up this pace. But if you look at the batted ball data, you can see that he changing the way he makes contact to some degree and is inducing different trajectories off the bat. He’s not a 7.0 WAR player like the pace indicates, but there is reason to believe that if he continues to impress the defensive metrics, he may hit well enough to approach another 5.0 win season.
How Was The Game? (May 27, 2013)
A much more typical affair.
Tigers 6, Pirates 5
After three shaky starts in a row, Justin Verlander (6-4, 66 IP, 3.68 ERA, 2.26 FIP, 2.5 WAR) set out to silence the doubters and did a fine job, delivering 7 innings of 3 run baseball that featured 13, yes 13, strikeouts and just 2 walks. The final stat line actually belies Verlander’s dominance as the Pirates grabbed two of their runs at the very end of the game. For most of the contest they were absolutely overmatched, until the fourth trip through the lineup. You can also see here that his fastball velocity matched the typical Verlander style that we came to love with the early ones in the low 90s and the late ones ratcheting up toward 100 (via Pitch F/X classification and velo):

On the other side, the Tigers got runs off three Jhonny Peralta (.341/.392/.500, 138 wRC+, 2.1 WAR) RBI hits, a Brayan Pena bases loaded walk, and a big Victor Martinez double. Benoit allowed two runs in the 8th inning, but also registered his first career pickoff in 805.2 career innings and turned it over to Valverde in the 9th who put the tying run on before getting out of the inning. The Tigers added their 6th win in their last 7 and now stand at 29-20 with Rick Porcello (2-2, 43 IP, 6.28 ERA, 4.53 FIP, 0.3 WAR) on the hill tomorrow looking to sweep the home half of this four game set with the Pirates.
The Moment: Verlander Ks 13 Pirates.
Two Reasons Max Scherzer Got Tougher

Last week, I spent some time breaking down Max Scherzer’s great start against the Indians and pointed out some factors that led to his success: 1) command of his fastball 2) better velocity 3) and increasing velocity in the late innings. But Scherzer was strong again yesterday and I took a quick peak as to why. Here are two things I found:
1) Excellent Command
First, let’s look at his strikezone plot from the Indians start
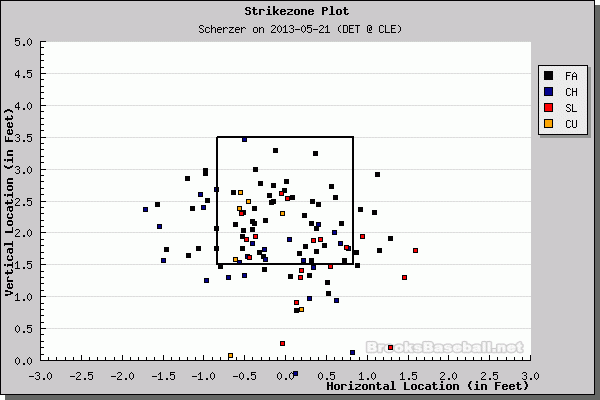
He stayed away from the high 1/4 of the zone, only pitching there four times. But let’s look at yesterday:

Scherzer threw one pitch that was in the zone and in the top 1/4 of the zone. One. There are also fewer pitches in the dirt and a few more at hitting height but outside the reach of the hitters.
2) Fastball Movement
Here’s a plot of Scherzer’s velocity and horizontal movement from the Cleveland start and then the Twins start.
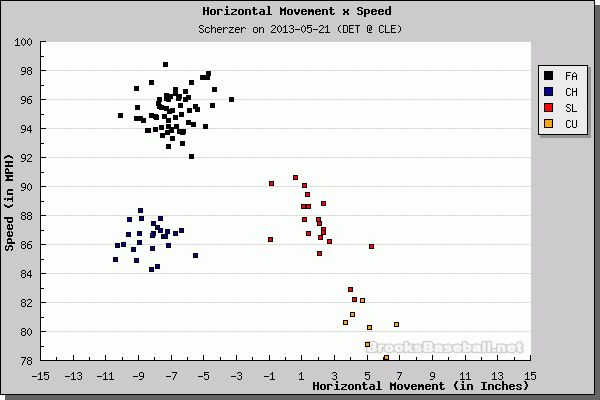

These graphs are on identical horizontal scales. Look at how much more movement he got on his fastball and changeup.
Velocity is great, Scherzer has it. Command is great, Scherzer has it. Movement is great, Scherzer has it. He’s having his best season so far and should probably start thinking about making reservations in New York for the Midsummer Classic.
How Was The Game? (May 26, 2013)
A nice clean win.
Tigers 6, Twins 1
On Memorial Day Sunday, the Tigers gave the ball to Max Scherzer (7-0, 68.1 IP, 3.42 ERA, 2.38 FIP, 2.5 WAR) to deliver the series victory against the Twins and he did just that. Scherzer gave the Tigers 6 innings of 1 run baseball mixed with 6 Ks, 3 BB, and just 3 hits to keep the Twins from mounting any offense. Torii Hunter put the Tigers on the board with a first inning opposite field homer and Fielder extended the lead with a 4th inning RBI double. With the score 2-1 in the bottom of the 6th, the Tigers bats came alive as struggling catcher Alex Avila got a bloop RBI single to set up a bases clearing triple from Avi Garcia to put the game out of reach. The win improves the Tigers to 28-20 on the season and gives them 5 wins in their last 6 tries ahead of a 4 game home and home series with the Pittsburgh Pirates starting on Monday. Justin Verlander (5-4, 59 IP, 3.66 ERA, 2.49 FIP, 2.1 WAR) will get the ball in game one, looking to straighten himself out and get back to his early season dominance.
The Moment: Garcia slams a bases loaded triple to left center.
How Was The Game? (May 25, 2013)
A tight one.
Twins 3, Tigers 2
After Sanchez rolled by the Twins last night, it was time for a close game at Comerica Park and the Twins got to Doug Fister (5-2, 61.2 IP, 3.65 ERA, 2.87 FIP, 1.9 WAR) for 3 first inning runs before he shut them down the rest of the way to finish with 7 innings, 8 hits, 3 R, 1 BB, 1 HBP, and 8 Ks thanks to better use of his curveball. Hunter doubled in a run in the 5th and Peralta homered in the 6th to close the gap to 3-2 entering the late innings, but the Tigers would get no closer. The loss drops the Tigers to 27-20 on the season, but they will try to take the series tomorrow with Max Scherzer (6-0, 62.1 IP, 3.61 ERA, 2.36 FIP, 2.3 WAR) on the mound.
The Moment: Fister gets a big double play to escape trouble in the 3rd.
The Nine Best Tigers Teams Ever
Today, the Detroit Tigers are paying tribute to the 1968 team during the 45th anniversary year of that team’s World Series win, the 3rd in Tigers history. Today, I though I’d give you a ranking of the best Tigers teams ever by Wins Above Replacement (WAR), which will allow for a comparison between eras.
As you may know, one of the primary benefits of WAR is that it compares players to their own contemporaries, meaning that it controls for the overall quality of the league at the time. Obviously, Babe Ruth played in a low HR era, so his totals look more impressive than someone like Sammy Sosa who played at the height of offense in MLB. WAR allows us to make direct comparisons between teams that played decades apart, which is why I’m using it. Obviously, you can look at win totals and how far each team went in the postseason, but this is another approach to the same question.
9. 1909 Tigers (47 WAR, 98 Wins, lost World Series)
8. 1946 Tigers (48.6 WAR, 92 Wins)
7. 1968 Tigers (48.8 WAR, 103 Wins, won World Series)
6. 1940 Tigers (49.4 WAR, 90 Wins, lost World Series)
5. 1935 Tigers (50.1 WAR, 93 Wins, won World Series)
4. 1961 Tigers (50.7 WAR, 101 Wins)
3. 1915 Tigers (50.8 WAR, 100 Wins)
2. 1984 Tigers (51.6 WAR, 104 Wins, won World Series)
1. 1934 Tigers (52.1 WAR, 101 Wins, lost World Series)
Should you be interested, the 2012 Tigers ranked 16th on this list with 43.9 WAR and 88 Wins, while the 2006 Tigers were 23rd with 42.2 WAR and 95 wins. Surprisingly (and perhaps due to WWII), the World Champion 1945 Tigers are 56th on the list with 34.5 WAR and 88 wins. The 2013 Tigers are already better than 13 other Tigers teams!
It’s also of note, perhaps, the strong relationship that Wins Above Replacement has with actual team Wins in large samples; nearly a perfect 1 to 1 ratio.

So while we tend to consider the four World Series teams the best ones, if you’re looking for regular season greatness the list looks slightly different. Let’s celebrate all of the great Tigers teams, and even the bad ones. Even that one at the far bottom left portion of the graph. I still love you, 2003 Tigers.
How Was The Game? (May 24, 2013)

So close.
Tigers 6, Twins 0
There are two types of no-hitters, the kind you see coming a mile away and the kind that sneak up on you. Verlander is a master of the first, but Anibal Sanchez (5-4, 64.1 IP, 2.38 ERA, 1.75 FIP, 2.9 WAR) nearly delivered the second tonight as he fell two outs short against the Minnesota Twins. He struck out 12 and walked only 3?enroute to his eight career CG. Early on, he seemed ordinary but the stuff slowly started showing up and once he walked off the mound after the fifth inning, I looked up and thought, “Hmmm. No hits?” That doesn’t typically happen for someone like me who is completely engrossed in the game from start to finish, but somehow it snuck up on me. And then there is was. Sanchez was marching toward history. Six innings. Seven. Eight. Cabrera, Infante, and Kelly each backed him with two runs driven in and it was never in doubt. As crowd buzzed more with every pitch, #19 rose to the occasion, willing him to throw the first Tigers no-hitter by someone other than Justin Verlander since Jack Morris in 1984. With the top of the order up in the 9th, Sanchez went to work. Carroll down on strikes. And then Joe Mauer, JOE MAUER, singled back up the box to ruin everyone’s day. He got Willingham on strikes and then Morneau with the same. The win, their fourth straight, improves the Tigers to 27-19 on the year and they will look to win the series tomorrow afternoon behind Doug Fister (5-1, 54.2 IP, 3.62 ERA, 2.75 FIP, 1.7 WAR).
The Moment: Sanchez gets the final out (see above) after loosing the no-no two batters earlier.
There’s Miguel Cabrera and Then There’s Everyone Else

Earlier today, Fangraphs’ resident GIF expert posted this beauty that demonstrates Cabrera’s ability to hit for power no matter where a pitch is located. And a large number of other people whose job it is to say things about baseball have flooded the internet with statistics and observations about Cabrera’s torrid start.
I’m not going to rehash everything because most of you can read and it’s pretty easy to call up numbers with a quick Google search. But I would like to point a few things out about Miguel Cabrera with respect to his peers at this moment.
First, Cabrera leads MLB in WAR (3.2) by 0.3 over Evan Longoria (2.9), but Miguel Cabrera is currently rated as the 8th worst defensive player who qualifies by Fangraphs. In other words, Cabrera is hitting so much better than everyone else that he is still the most valuable player even though he is among the worst glovemen going. Let’s look at it:

And now, just for reference:

Miguel Cabrera has been baesball’s most valuable player so far despite being one of it’s worst defenders. That’s how much better he is than everyone else at the plate. You can see from the first graph that the quality of your offense and the quality of your defense aren’t that strongly related (on average a 1 unit increase in wRC+ decreases your defensive score by .007, but the results aren’t statistically significant and the R squared hardly registers.). But on the other hand, Fld and WAR are related (on average, a one unit increase in Fld will increase your WAR by .08 with the results being statistically significant and the R squared at least somewhat reasonable).
In other words, defense and hitting aren’t really related, but defense and WAR are (obviously). That rule just doesn’t apply to Cabrera because he’s outhitting everyone by so much.

He’s out there by himself. If you’d rather break it down by AVG, OBP, and SLG it’s just as impressive.


Miguel Cabrera, through 45 games, is simply outhitting everyone. This is the peak of one of the best hitters we’ve seen in our lifetimes, so enjoy it.
How Was The Game? (May 23, 2013)
A team effort.
Tigers 7, Twins 6
You might take a look at Rick Porcello’s (2-2, 43 IP, 6.28 ERA, 4.50 FIP, 0.3 WAR) 4 run 3rd inning and dismiss his performance as poor, but his defense botched a couple of plays and made the whole thing look worse than it was. The gopherball to Willingham is the only pitch he’ll lose sleep over, but he shouldn’t lose too much as his offense came to his rescue in spades. Cabrera homered in the 1st and drove in a third run with an infield hit in the 5th, while the whole team got involved in a 3 run 7th that erased Porcello’s 5 runs and Downs’ 1. In the 8th, Infante reached, Hunter bunted him to second, and Cabrera was IBB’d to set up a Prince Fielder RBI single to give the Tigers a 7-6 lead which would hold up to the scrutiny of the 9th inning. With the win the Tigers move to 26-19 and will turn to Anibal Sanchez (4-4, 55.1 IP, 2.77 ERA, 1.80 FIP, 2.4 WAR) tomorrow night looking for their 4th straight win.
The Moment: Peralta drives in Fielder with a double to left to tie the game.
