Stat(s) of the Week: Defensive Runs Saved and Ultimate Zone Rating

Since I’ve twice written above defense in the last week, it’s high time I actually explain these defensive stats. Luckily, this is quite easy to explain and understand. There are two primary defensive metrics that people use. Defensive Runs Saved (DRS) and Ultimate Zone Rating (UZR), which are based on people watching video of every play and computer algorithms.
You can learn exactly how each is calculate here, DRS and UZR. But you don’t need to know how to calculate them in order to understand what they mean. It’s important to learn about these because Fielding % is problematic stat because it doesn’t factor in a player’s range, so you can have a good fielding percentage if you don’t make errors because you never get to difficult balls. We need numbers that measure how good players are at preventing runs and avoiding errors isn’t the only way to do that.
The numbers are scaled to position, so league average at every position is zero and positive numbers are good and negative numbers are bad.
For example a player with a +5 DRS or +5 UZR is five runs better than league average at their position. 10 runs is equal to 1 Win Above Replacement (WAR). These are counting stats, so you accumulate them as the season goes on, although I believe they are only updated weekly on the more popular statistics websites.
You can use either DRS or UZR depending on your preference, but Baseball Reference uses DRS in their WAR and Fangraphs uses UZR in theirs. It’s a preference thing. I always use Fangraphs WAR on this site, but I interchange the defensive stats on occasion because I don’t really have a favorite. If there is no label on this site, it is UZR.
Additionally, you might see UZR/150, which is simply UZR scaled into a full season of games as if you played at your current pace for a whole season.
As a rule of thumb, 0 is average, -5/+5 is above or below average, -10/+10 is poor or great, -15/+15 is awful or elite. It is also important to know that these statistics take a while to become predictive, so small samples can cause problems with defensive numbers but they generally all a good description of what has happened, even if it doesn’t predict what will happen next.
Evaluating Defense: Web Gems or Advanced Metrics
I’m a huge believer in the value of defense in baseball and I’m also someone who believes in advanced statistics in baseball. You might already know that if you’re a regular reader. Some of the typical advanced stats regarding defense are Defensive Runs Saved (DRS), Ultimate Zone Rating (UZR), and UZR’s close cousin UZR/150 which scales that number based on a full season of games.
Critics and proponents alike will tell you these numbers aren’t perfect and do not always predict true skill in small samples, but they are reasonably good compared to any other defensive statistic we have and they are created by people watching baseball, not a computer algorithm. So they’re the best measure of defense we have even if there are flaws.
But another measure of defense is the number of spectacular, eye-popping plays. This measure is called the Web Gem and is brought to you by the people at Baseball Tonight.
Mark Simon, an ESPN Stats and Info researcher, often posts Web Gem data on Twitter and I’ve been wondering about Web Gems and advanced stats for a while. Today I stopped wondering and started doing. Here’s Simon’s most recent tweet regarding team level Web Gems:
Now if you’re a real scientist who knows about probability and stuff, you know there are a couple flaws in what I am about to do. Let me get them out of the way quickly:
- Web Gems are conditional what happens on a given day, the 6th best play (not a gem) on Monday might have been 1st on Tuesday (a gem) but due to the random distribution of gems, it doesn’t qualify even though it should.
- Terrible defensive plays don’t count against you in Gems, but do in DRS/UZR
- Team numbers aren’t best, but it’s all I have. A team’s defensive quality can vary, so if one play accumulates all of your gems they can still only account for a fraction of your DRS/UZR
So recognize that these are issues, but also ignore them for now because this is supposed to be fun and merely to satisfy my curiosity.
How well do Web Gems predict defense? Does a small number of great plays predict overall defensive value? The short answer, no. Not at all. Here is Web Gems plotted against DRS, UZR, and UZR/150.

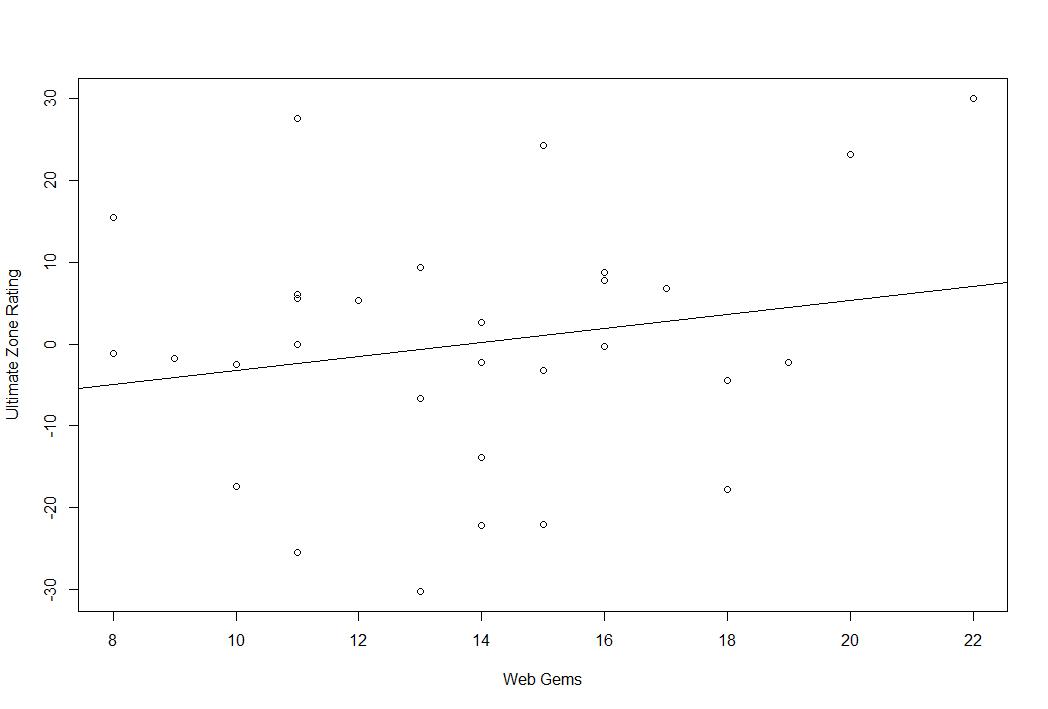
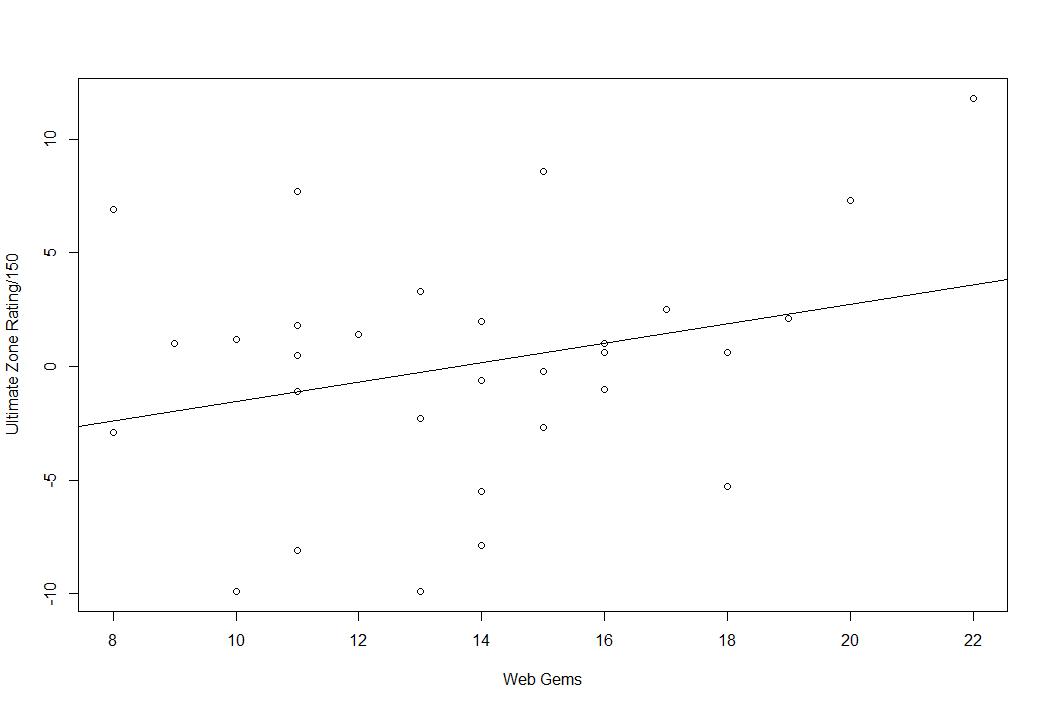
You may notice the line slops upward in each graph, meaning that as Web Gems increase, so too do the various metrics, but a positive slop doesn’t mean it’s a real effect. That’s just the line of best fit. In reality, these lines are not statistically significant. In fact, they are almost as insignificant as something can be (I know that’s bad statistical theory, it’s poetic license).
Here are the slope coefficients, standard errors, and adjusted r squares:
| WEB GEMS | DRS | UZR | UZR/150 |
| Parameter Estimate | 1.70 | 0.86 | 0.43 |
| Standard Error | 1.30 | 0.80 | 0.27 |
| Adjusted R squared | 0.03 | 0.00 | 0.05 |
As you can see, the adjusted r squares for each of these are remarkable tiny. In layman’s terms, what you are seeing here is this. More Web Gems, on average, mean higher DRS/UZR, but this is almost surely due to random chance. Web Gems also explain less than 10% of the overall variation in the defensive stats.
Basically, the takeaway here is that overall team defense is not related to a team’s overall number of Web Gems. That might not interest you, but I was curious. I’d like to do it with every player in the league, but I don’t have complete individual Web Gem data and I think the very high number of zeroes would probably make it a giant mess. I’m not sure.
But my curiosity has been satisfied and I feel better knowing that the ability to make ridiculous plays is not strongly related to the overall ability prevent runs.
A Brief Note of Warning to Cleveland Outfielders
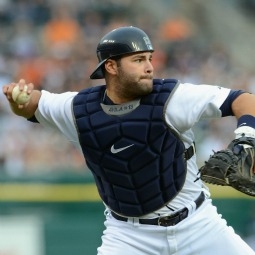
Anthony Castrovince of MLB.com wrote a piece recently wondering if any AL Central team could challenge the Tigers for the division title and specifically referenced the Indians acquisition of Michael Bourn and Drew Stubbs this offseason, which provides them with a great deal of speed. But the Tigers’ returning DH and former catcher has a word of warning for the base swiping inclined Indians outfielders.
“They gotta do better than Michael Bourn,” said a smiling Victor Martinez, before gesturing toward catcher Alex Avila. “We’ve got some policemen who give tickets to people who go from first to second!”
It’s a wonderful note of support from V-Mart about Avila, but is it accurate? We know catcher defense is the most difficult defense to measure and clunky things like fielding percentage and caught stealing percentage just don’t do it.
The best we have so far is Defensive Runs Saved (DRS). If we accept DRS as the best we can do without detailed scouting reports, how does Avila stack up?
In 2012, he was tied for fourth best in baseball with 6 DRS at catcher trailing Ryan Hanigan (7), Salvador Perez (9 in 653 innings), and Yadier Molina (16).
So, don’t trying anything Indians or you’ll have to deal with this.