How Was The Game? (August 18, 2013)

As comfortable as the weather.
Tigers 6, Royals 3
After splitting the first four games in the long, five game set with the Royals, the Tigers took the final game to ensure that they sent the Royals packing without gaining any ground on the division leaders. Max Scherzer (25 GS, 172,1 IP, 2.82 ERA, 2.66 FIP, 5.3 WAR) gave the Tigers 8 strong innings of 2 run ball featuring 4 strikeouts and no walks while Miguel Cabrera provided all the offense he would need including a no doubt, first pitch bomb in the first to go along with an RBI single that came later. The Tigers added runs in the 5th and 6th innings as well to pad the lead and likely would have been looking at more if not for some excellent defensive play by Alex Gordon and Eric Hosmer. The Tigers continue to put distance between themselves and the rest of the division as the summer winds down and will look to fatten up on the Twins for three games starting Tuesday at Comerica Park with Rick Porcello (22 IP, 131 IP, 4.33 ERA, 3.42 FIP, 2.5 WAR) on the mound to start it off.
The Moment: Cabrera hits a no doubt blast on the first pitch he saw.
SOEFA Sunday: Reliever Rankings Update (August 18, 2013)
You’ll recall earlier this year we introduced our very own reliever rankings called SOEFA, which you can read about in detail here. For a brief refresher, it combines inherited runner strand rate, expected OBP against, ERA-, and FIP- into a deviation from league average. This is a measure of performance, not necessarily ability, and seeks to provide a single number to judge relievers that balances context neutral and context dependent numbers. Certain pitchers, such as Craig Kimbrel, cannot be credited for stranding runners because they are never put into those situations. They are not penalized either, however. Zero is average, and will generally range between -2.5 to 2.5 with -1 to 1 being most common. This includes all pitchers who have thrown at least 20 IP in relief as of this morning, so the average score on this list is closer to 0.11. Should you wish to know the SOEFA for any other reliever, or on a day that isn’t Sunday, hit us on Twitter or in the comments section.
| Rank | Player | Team | SOEFA |
| 1 | Kenley Jansen | Dodgers | 0.94 |
| 2 | Neal Cotts | Rangers | 0.93 |
| 3 | Greg Holland | Royals | 0.92 |
| 4 | Drew Smyly | Tigers | 0.92 |
| 5 | Chris Withrow | Dodgers | 0.90 |
| 6 | Carlos Torres | Mets | 0.87 |
| 7 | Nick Vincent | Padres | 0.86 |
| 8 | Joaquin Benoit | Tigers | 0.81 |
| 9 | Mark Melancon | Pirates | 0.80 |
| 10 | Jesse Crain | White Sox | 0.78 |
| 11 | Koji Uehara | Red Sox | 0.77 |
| 12 | Alex Torres | Rays | 0.74 |
| 13 | Craig Kimbrel | Braves | 0.72 |
| 14 | Kevin Siegrist | Cardinals | 0.72 |
| 15 | Jason Grilli | Pirates | 0.71 |
| 16 | Jim Henderson | Brewers | 0.70 |
| 17 | Edward Mujica | Cardinals | 0.68 |
| 18 | Javier Lopez | Giants | 0.68 |
| 19 | Shawn Kelley | Yankees | 0.67 |
| 20 | Sergio Romo | Giants | 0.66 |
| 21 | Sam LeCure | Reds | 0.65 |
| 22 | Sean Doolittle | Athletics | 0.63 |
| 23 | Jordan Walden | Braves | 0.63 |
| 24 | Manny Parra | Reds | 0.62 |
| 25 | Brandon Kintzler | Brewers | 0.62 |
| 26 | Jose Veras | – – – | 0.59 |
| 27 | Matt Belisle | Rockies | 0.58 |
| 28 | Paco Rodriguez | Dodgers | 0.57 |
| 29 | Glen Perkins | Twins | 0.57 |
| 30 | Casey Fien | Twins | 0.55 |
| 31 | Randy Choate | Cardinals | 0.54 |
| 32 | Casey Janssen | Blue Jays | 0.54 |
| 33 | Andrew Bailey | Red Sox | 0.52 |
| 34 | Preston Claiborne | Yankees | 0.52 |
| 35 | Luke Hochevar | Royals | 0.51 |
| 36 | Joe Thatcher | – – – | 0.51 |
| 37 | Dan Otero | Athletics | 0.51 |
| 38 | Brian Matusz | Orioles | 0.51 |
| 39 | Trevor Rosenthal | Cardinals | 0.50 |
| 40 | Caleb Thielbar | Twins | 0.50 |
| 41 | Juan Perez | Blue Jays | 0.50 |
| 42 | Antonio Bastardo | Phillies | 0.49 |
| 43 | Seth Maness | Cardinals | 0.49 |
| 44 | J.P. Howell | Dodgers | 0.47 |
| 45 | Andrew Miller | Red Sox | 0.47 |
| 46 | David Carpenter | Braves | 0.46 |
| 47 | Ryan Cook | Athletics | 0.46 |
| 48 | David Robertson | Yankees | 0.45 |
| 49 | Junichi Tazawa | Red Sox | 0.45 |
| 50 | Tommy Hunter | Orioles | 0.45 |
| 51 | Scott Downs | – – – | 0.45 |
| 52 | Bobby Parnell | Mets | 0.44 |
| 53 | Brad Ziegler | Diamondbacks | 0.44 |
| 54 | Joel Peralta | Rays | 0.44 |
| 55 | Josh Collmenter | Diamondbacks | 0.43 |
| 56 | Neil Wagner | Blue Jays | 0.43 |
| 57 | Robbie Ross | Rangers | 0.42 |
| 58 | Matt Reynolds | Diamondbacks | 0.42 |
| 59 | Darren O’Day | Orioles | 0.42 |
| 60 | Brett Cecil | Blue Jays | 0.40 |
| 61 | Luis Avilan | Braves | 0.40 |
| 62 | Chad Gaudin | Giants | 0.40 |
| 63 | Aroldis Chapman | Reds | 0.39 |
| 64 | Will Harris | Diamondbacks | 0.39 |
| 65 | Addison Reed | White Sox | 0.39 |
| 66 | Dale Thayer | Padres | 0.39 |
| 67 | Jason Frasor | Rangers | 0.39 |
| 68 | Jared Burton | Twins | 0.37 |
| 69 | Vin Mazzaro | Pirates | 0.37 |
| 70 | Josh Outman | Rockies | 0.36 |
| 71 | J.J. Hoover | Reds | 0.35 |
| 72 | Boone Logan | Yankees | 0.34 |
| 73 | Jonathan Papelbon | Phillies | 0.34 |
| 74 | Tom Gorzelanny | Brewers | 0.34 |
| 75 | Tanner Scheppers | Rangers | 0.32 |
| 76 | Chad Qualls | Marlins | 0.32 |
| 77 | Francisco Rodriguez | – – – | 0.31 |
| 78 | Craig Breslow | Red Sox | 0.31 |
| 79 | Rafael Betancourt | Rockies | 0.31 |
| 80 | Tyler Clippard | Nationals | 0.30 |
| 81 | Alfredo Figaro | Brewers | 0.30 |
| 82 | Steve Cishek | Marlins | 0.30 |
| 83 | Cody Allen | Indians | 0.30 |
| 84 | Heath Bell | Diamondbacks | 0.29 |
| 85 | Steve Delabar | Blue Jays | 0.28 |
| 86 | Alfredo Simon | Reds | 0.28 |
| 87 | Kevin Gregg | Cubs | 0.27 |
| 88 | Tony Watson | Pirates | 0.27 |
| 89 | James Russell | Cubs | 0.25 |
| 90 | Jerome Williams | Angels | 0.24 |
| 91 | Nate Jones | White Sox | 0.22 |
| 92 | Tim Collins | Royals | 0.22 |
| 93 | Anthony Varvaro | Braves | 0.21 |
| 94 | Jamey Wright | Rays | 0.20 |
| 95 | Joe Smith | Indians | 0.17 |
| 96 | Santiago Casilla | Giants | 0.17 |
| 97 | Ernesto Frieri | Angels | 0.16 |
| 98 | Aaron Loup | Blue Jays | 0.16 |
| 99 | Fernando Abad | Nationals | 0.16 |
| 100 | J.C. Gutierrez | – – – | 0.16 |
| 101 | Jake Diekman | Phillies | 0.15 |
| 102 | Matt Thornton | – – – | 0.15 |
| 103 | Danny Farquhar | Mariners | 0.14 |
| 104 | Jim Johnson | Orioles | 0.14 |
| 105 | Jean Machi | Giants | 0.13 |
| 106 | Craig Stammen | Nationals | 0.12 |
| 107 | Charlie Furbush | Mariners | 0.12 |
| 108 | Justin Wilson | Pirates | 0.12 |
| 109 | Ross Wolf | Rangers | 0.11 |
| 110 | Rex Brothers | Rockies | 0.11 |
| 111 | Jeanmar Gomez | Pirates | 0.11 |
| 112 | Luke Gregerson | Padres | 0.10 |
| 113 | Mike Dunn | Marlins | 0.10 |
| 114 | Sandy Rosario | Giants | 0.10 |
| 115 | Pat Neshek | Athletics | 0.09 |
| 116 | Anthony Swarzak | Twins | 0.09 |
| 117 | Wilton Lopez | Rockies | 0.09 |
| 118 | Yoervis Medina | Mariners | 0.08 |
| 119 | Brad Lincoln | Blue Jays | 0.08 |
| 120 | Jesse Chavez | Athletics | 0.08 |
| 121 | Bruce Rondon | Tigers | 0.07 |
| 122 | Aaron Crow | Royals | 0.07 |
| 123 | Kevin Jepsen | Angels | 0.07 |
| 124 | Bryan Shaw | Indians | 0.06 |
| 125 | LaTroy Hawkins | Mets | 0.06 |
| 126 | Fernando Rodney | Rays | 0.06 |
| 127 | Luis Ayala | – – – | 0.06 |
| 128 | Joe Kelly | Cardinals | 0.06 |
| 129 | Dan Jennings | Marlins | 0.05 |
| 130 | Scott Rice | Mets | 0.05 |
| 131 | Oliver Perez | Mariners | 0.05 |
| 132 | Cesar Ramos | Rays | 0.05 |
| 133 | Burke Badenhop | Brewers | 0.04 |
| 134 | Tyson Ross | Padres | 0.04 |
| 135 | Darren Oliver | Blue Jays | 0.04 |
| 136 | Rafael Soriano | Nationals | 0.04 |
| 137 | Joe Nathan | Rangers | 0.04 |
| 138 | Jared Hughes | Pirates | 0.03 |
| 139 | Edgmer Escalona | Rockies | 0.03 |
| 140 | Brian Duensing | Twins | 0.02 |
| 141 | Ryan Webb | Marlins | 0.02 |
| 142 | Jose Mijares | Giants | 0.01 |
| 143 | Troy Patton | Orioles | 0.01 |
| 144 | Matt Guerrier | – – – | 0.00 |
| 145 | Carter Capps | Mariners | 0.00 |
| 146 | Dane de la Rosa | Angels | 0.00 |
| 147 | Josh Edgin | Mets | -0.01 |
| 148 | Kelvin Herrera | Royals | -0.01 |
| 149 | Ryan Pressly | Twins | -0.02 |
| 150 | Jerry Blevins | Athletics | -0.02 |
| 151 | Adam Ottavino | Rockies | -0.02 |
| 152 | Chris Perez | Indians | -0.03 |
| 153 | Blake Parker | Cubs | -0.04 |
| 154 | Michael Kohn | Angels | -0.04 |
| 155 | Joe Ortiz | Rangers | -0.04 |
| 156 | J.J. Putz | Diamondbacks | -0.05 |
| 157 | Mariano Rivera | Yankees | -0.05 |
| 158 | Josh Roenicke | Twins | -0.05 |
| 159 | Matt Lindstrom | White Sox | -0.05 |
| 160 | Ronald Belisario | Dodgers | -0.06 |
| 161 | David Aardsma | Mets | -0.07 |
| 162 | Phil Coke | Tigers | -0.08 |
| 163 | Bryan Morris | Pirates | -0.09 |
| 164 | Greg Burke | Mets | -0.09 |
| 165 | Brad Brach | Padres | -0.10 |
| 166 | Tony Sipp | Diamondbacks | -0.10 |
| 167 | Darin Downs | Tigers | -0.12 |
| 168 | Logan Ondrusek | Reds | -0.12 |
| 169 | Jake McGee | Rays | -0.13 |
| 170 | Rich Hill | Indians | -0.14 |
| 171 | Ross Ohlendorf | Nationals | -0.14 |
| 172 | Wesley Wright | – – – | -0.16 |
| 173 | Luke Putkonen | Tigers | -0.17 |
| 174 | Huston Street | Padres | -0.18 |
| 175 | Tim Stauffer | Padres | -0.18 |
| 176 | Ramon Troncoso | White Sox | -0.19 |
| 177 | Cory Gearrin | Braves | -0.19 |
| 178 | Nick Hagadone | Indians | -0.21 |
| 179 | A.J. Ramos | Marlins | -0.23 |
| 180 | Raul Valdes | Phillies | -0.23 |
| 181 | Manuel Corpas | Rockies | -0.25 |
| 182 | Jonathan Broxton | Reds | -0.25 |
| 183 | Drew Storen | Nationals | -0.26 |
| 184 | Matt Albers | Indians | -0.27 |
| 185 | Vinnie Pestano | Indians | -0.27 |
| 186 | Blake Beavan | Mariners | -0.28 |
| 187 | Joba Chamberlain | Yankees | -0.29 |
| 188 | Al Alburquerque | Tigers | -0.29 |
| 189 | Tom Wilhelmsen | Mariners | -0.30 |
| 190 | Garrett Richards | Angels | -0.30 |
| 191 | Justin De Fratus | Phillies | -0.31 |
| 192 | Scott Atchison | Mets | -0.31 |
| 193 | John Axford | Brewers | -0.32 |
| 194 | Fernando Salas | Cardinals | -0.33 |
| 195 | Pedro Strop | – – – | -0.34 |
| 196 | Grant Balfour | Athletics | -0.34 |
| 197 | David Hernandez | Diamondbacks | -0.35 |
| 198 | Paul Clemens | Astros | -0.36 |
| 199 | George Kontos | Giants | -0.36 |
| 200 | Michael Gonzalez | Brewers | -0.37 |
| 201 | Michael Bowden | Cubs | -0.37 |
| 202 | Kyle Farnsworth | Rays | -0.39 |
| 203 | Mike Adams | Phillies | -0.40 |
| 204 | T.J. McFarland | Orioles | -0.41 |
| 205 | Clayton Mortensen | Red Sox | -0.41 |
| 206 | Travis Blackley | Astros | -0.44 |
| 207 | Ian Krol | Nationals | -0.44 |
| 208 | Alex Wilson | Red Sox | -0.45 |
| 209 | Josh Fields | Astros | -0.46 |
| 210 | Dallas Keuchel | Astros | -0.48 |
| 211 | Brandon Lyon | Mets | -0.49 |
| 212 | Esmil Rogers | Blue Jays | -0.50 |
| 213 | Ryan Mattheus | Nationals | -0.51 |
| 214 | Bruce Chen | Royals | -0.54 |
| 215 | Adam Warren | Yankees | -0.55 |
| 216 | Jose Cisnero | Astros | -0.57 |
| 217 | Jeremy Horst | Phillies | -0.60 |
| 218 | Hector Ambriz | Astros | -0.62 |
| 219 | Jeremy Affeldt | Giants | -0.65 |
| 220 | Carlos Marmol | – – – | -0.66 |
| 221 | Lucas Luetge | Mariners | -0.71 |
| 222 | Henry Rodriguez | – – – | -0.71 |
| 223 | Michael Kirkman | Rangers | -0.73 |
| 224 | Hector Rondon | Cubs | -0.78 |
| 225 | Brandon League | Dodgers | -0.84 |
| 226 | Anthony Bass | Padres | -0.91 |
| 227 | Shawn Camp | Cubs | -1.05 |
How Was The Game? (August 17, 2013)
Just another feather in his cap.
Tigers 6, Royals 5
Doug Fister (25 GS, 161.1 IP, 3.63 ERA, 3.28 FIP, 3.5 WAR) didn’t dominate during his 6.1 innings, but he held the Royals to 3 runs with 6 strikeouts and 2 walks and pitched around one of the worst calls you’ll see this year by the entire umpiring crew. With Getz on first, Escobar clearly fouled a pitch off – so clearly that Pena made no effort to go pick it up – but the umpire made no such call and allowed Getz to advance to third before Fister retrieved the baseball. Needless to say, Jim Leyland got himself kicked out, but less needless to say, so did the mild mannered Pena. Fister turned the game over to Smyly who allowed an equalizer to Perez, but was quickly bailed out by a Fielder bomb that punctuated his big night. Calling on Veras for the 8th proved problematic, as he allowed the tying run to score before escaping a big jam thanks to Fielder putting a delicate part of his body in the path of the baseball. In the 9th, Aaron Crow had to face Miguel Cabrera. I’m pretty sure you can imagine how that went for Crow, as he hung his head as he strolled into the dugout after giving up the walkoff bomb. The win takes the Tigers 21 games over the .500 mark and sets them up to take the series on Sunday behind Max Scherzer (24 GS, 164.1 IP, 2.85 ERA, 2.69 FIP, 4.9 WAR).
The Moment: Miguel Cabrera sends everybody home.
The Nine Most Underrated Baserunners of 2013
Here are New English D we like to dig below surface stats and discover the complete value of players. This post will illustrate that using a player’s value on the bases. Earlier this year we published a piece on the Tigers’ value on the bases that explained a number of baserunning statistics, most notably for our purposes here, UBR and wSB. wSB is a very simple stat that calculates the run value of stealing a base and getting caught. To calculate it you multiple a player’s SB by .2 and their CS by about -.38 and then scale that number based on league average so that a wSB of 0 is set to league average. Here’s the full formula from FanGraphs. UBR is a little more complicated but carries the same principles of turning advancing on the bases into run values that deviate from a league average of 0. Here’s how FanGraphs explains it.
The basic premise of both stats is that taking an extra base is almost always less valuable than getting thrown out is costly. You want to advance on the bases, but you REALLY don’t want to be thrown out. Below are The Nine Best Baserunners from 2013 who have negative value when it comes to stealing bases and positive value when it comes to running the bases when the ball is in play. For me, these are the most underrated baserunners because their stolen bases numbers aren’t good, but the rest of their numbers are great. Stats are for qualifying players entering games on August 17th.
| Rank | Name | Team | PA | UBR | wSB | SB | CS |
| 9 | Gregor Blanco | Giants | 388 | 2.4 | -0.1 | 11 | 5 |
| 8 | Yoenis Cespedes | Athletics | 434 | 2.4 | -1.8 | 6 | 7 |
| 7 | Marlon Byrd | Mets | 426 | 2.6 | -1.5 | 2 | 4 |
| 6 | Matt Carpenter | Cardinals | 534 | 2.8 | -1.5 | 1 | 3 |
| 5 | Brandon Crawford | Giants | 433 | 2.9 | -0.9 | 1 | 2 |
| 4 | Michael Bourn | Indians | 415 | 3.0 | -0.5 | 17 | 9 |
| 3 | Joey Votto | Reds | 547 | 3.2 | -0.4 | 5 | 2 |
| 2 | Brian Dozier | Twins | 443 | 3.2 | -0.9 | 9 | 6 |
| 1 | Austin Jackson | Tigers | 433 | 5.3 | -0.7 | 6 | 4 |
This list has a variety of different players on it. First, we have a couple of players who steal a decent number of bases but get caught too often for it to be worth it (Blance, Bourn, Dozier). We also have players who have decent speed but don’t run very often for a number of reasons (Cespedes, Crawford, Jackson). But we also have guys who aren’t know for their wheels but do a great job taking extra bases (Byrd, Carpenter, and Votto).
Votto and Carpenter really stand out to be because you would never think of them as good baserunners, in fact, some might call them “base-cloggers” because they get on base a lot and aren’t fleet of foot. It turns out they are very good baserunners who simply don’t get any credit because they don’t steal bases. Carpenter and Votto are actually above average baserunners overall despite their inability to steal. They also happen to be great hitters and fielders, so that’s a nice combination.
What this list tells you is that baserunning is not as simple as speed and stolen bases. Slow guys who don’t steal can add a lot of value if they have good instincts and read the ball well off the bat. Additionally, this is a good example of why advanced stats can be helpful. The basic baserunning stat (SB) would completely ignore most of these players and we would have no idea that they are so valuable.
If nothing else, this should cement how fantastic Joey Votto is at baseball.
How Was The Game? (August 16, 2013 – Game Two)
Nothing you’d worry about if it hadn’t happened twice today.
Royals 3, Tigers 0
The Tigers got another solid outing from their starter in the nightcap, but the offense failed to deliver again, this time for Jose Alvarez (5 GS, 25.1 IP, 4.62 ERA, 5.91 FIP, -0.1 WAR) who gave the Tigers 5.2 innings of 2 run baseball and kept pressure off the bullpen. He won’t win a Cy Young for the performance but he did a nice job keeping the Royals off balance and gave his team a shot to win. Unfortunately, the Tigers could get very little going against James Shields and they fell for the second time in just a few hours thanks to some tremendous defense by the Royals. The Tigers will have a chance to repair the damage as they’ll get the Royals two more times before the weekend is out starting with Doug Fister (24 GS, 155 IP, 3.60 ERA, 3.33 FIP, 3.3 WAR) on the hill on Saturday night.
The Moment: Iglesias charges and flips a ball backhanded to Cabrera to escape a jam.
How Was The Game? (August 16, 2013 – Game One)
A nice duel we didn’t win.
Royals 2, Tigers 1
In the early game, the Tigers came up short but their is no blame to be laid at the feet of Justin Verlander (26 GS, 166.2 IP, 3.51 ERA, 3.43 FIP, 3.7 WAR) who continued to show his midseason struggles are behind him as he went 8 innings and allowed just 2 runs to go along with 6 strikeouts. The fastball velocity was solid (averaging 94.8 MPH, up to 98.2), the breaking balls were good, and the changeup worked. The release point was also where it should be, as it has been for several starts (check out previous work on the matter):

The only blemishes were a solo homerun by Hosmer and a couple of hits in the 7th inning. The bats couldn’t do much against Danny Duff and the Royals as they got on base via the walk nicely, but hit into a ton of outs when they put the ball in play even when the contact was good. Santiago jumped Aaron Crow for a pinch hit homerun in the 8th, but the Tigers couldn’t complete the rally. Additionally, Jose Iglesias made two fine defensive plays – one chasing down a pop fly and one getting to a ground ball up the middle – in addition to taking one for the team in the worst possible spot to reach via the HBP. The Tigers won’t have long to think about this one as they’ll grab some dinner and come back out for the nightcap with Jose Alvarez (4 GS, 19.2 IP, 5.03 ERA, 5.99 FIP, -0.2 WAR) toeing the rubber.
The Moment: Iglesias makes two excellent plays in the span of three batters.
Updated Tigers Starters WATCH Scores
Last month, I invented WATCH, New English D’s meaningless rankings of which starters on the team are most fun to watch. Below is the original description, followed by updated rankings:
Among the things we love at New English D are the Detroit Tigers, starting pitching, math, and nonsensical rankings. This post will combine all three in glorious fashion. I’ve often thought about doing something like this because I’ve always had my own rankings of which starters I enjoyed watching the most. If you’re familiar with this site, I’m not just a fan of great pitching, I’m a fan of certain kinds of pitching. The rankings below reflect that. This is meant to be fun.
Among the factors considered here are how deep a pitcher pitches into games, strikeouts, walks, ground balls, first pitch strikes, and how quickly they work. Each number is compared to the team average (not league average) and added together with all six categories weighted equally. Hat tip to Carson Cistulli of Fangraphs for inspiring the idea with his NERD scores.
As August 15, the 2013 Tigers WATCH List looks like this:
5. Justin Verlander
4. Rick Porcello
3. Anibal Sanchez
2. Max Scherzer
1. Doug Fister
Enjoy the double-header and check back for two editions of How Was The Game?!
How Was The Game? (August 15, 2013)
One that felt like the stretch run.
Tigers 4, Royals 1
There’s something about playing the Royals on a later summer night that seems to make everything official. This is what it feels like to close in on a title. It’s entirely subjective, but this homestand is the de facto beginning of the end and the Tigers started it out nicely with 7.1, 1 run innings from Anibal Sanchez (21 GS, 133 IP, 2.50 ERA, 2.39 FIP, 4.5 WAR) who continued to roll past AL offenses with five strikeouts and one walk. Fielder gave the Tigers the lead with a much needed 2 run homer in the first and the Tigers added two more in the 5th to put it out of reach. The Tigers had some trouble running the bases, but Dirks highlighted the offensive attack with 4 hits while filling in at the top for Jackson. The Royals entered the series trailing the Tigers by 7.5 games and after the first of five are already watching that number rise. The Tigers will play two tomorrow with Justin Verlander (25 GS, 158.2 IP, 3.57 ERA, 3.40 FIP, 3.5 WAR) taking the ball in the day game and Jose Alvarez (4 GS, 19.2 IP, 5.03 ERA, 5.99 FIP, -0.2 WAR) getting the call for the nightcap.
The Moment: Fielder leaves the yard for the first time in a long while.
Miguel Cabrera Does Not Respect Inside Pitches

I’m not the first person to point this out, so don’t give me all the credit, but Miguel Cabrera is a really good hitter who destroys the baseball pretty much anywhere it’s pitched. But this year, he’s crushing the inside pitch. He’s always been good, but this year we’re seeing a ton of homeruns on pitches that most hitters literally couldn’t even foul off. Let’s take a look.
Here are his 38 HR so far with an approximate strikezone from the catcher’s perspective measured in feet:
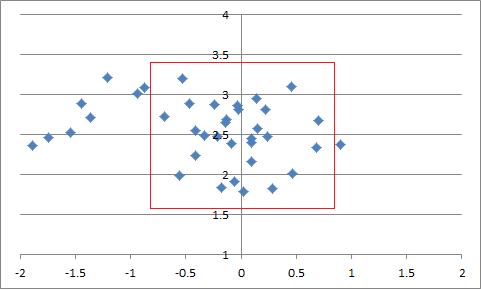
Most of them have been in the zone, but there have been a handful that were way off the plate. Six to be precise. You’ll notice two that were just off the plate, but those seem human. The other six don’t. What do we know about those homeruns?
They were all fastballs.
None of them had more than 7.5 inches of horizontal movement.
They all came when the count was even or Cabrera was behind.
The slowest was 91 MPH, the fastest was 96 MPH.
Five went to left field, one went to center field.
What have we learned from this demonstration? Probably something we already should have known. You can’t get Cabrera out inside and you especially can’t do with with run of the mill fastballs even when you’re ahead in the count. I looked at how you might try to get him out earlier this season and my advice was hard stuff up and away and breaking balls down and away. You have to make him chase, you can’t jam him inside because he can apparently hit homeruns on pitches two feet from the center of the plate.
But I was also curious if this was new for Cabrera. I don’t remember him hitting this many homeruns on inside pitches, which poses the question, “is he getting better?” Let’s take a look at all of his homeruns from 2008-2012:
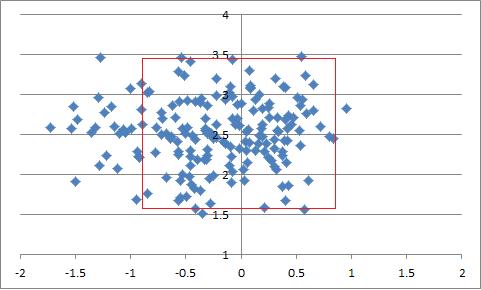
Apparently, this isn’t terribly new for Cabrera. We might be noticing it more, but he’s been doing it forever even if he is a few ahead of his pace in 2013. Of the 16 pitches that he hit out from 2008-2012 on inside pitches, all of them were fastballs. None of them above 96 and only four came with Cabrera ahead in the count. I’m starting to see a pattern here.
If we do a quick search of every homerun that was off the plate inside to righties (not just the really far inside ones), Cabrera leads baseball by a ton. He has 53 homeruns on pitches off the plate inside since 2008, the next closest RHH is Ryan Zimmerman with 31.
In fact, his homerun against Phil Hughes last Saturday was the furthest inside pitch to be hit out by a righty since Pitch F/X started recording the data. In fact of the 11 most inside pitches hit out by righties since 2008, 6 of them are Miguel Cabrera. Now some of that is selection bias because he’s hit the most homeruns, but 6 of 11 is way of out proportion. He’s a monster.

And he also does this. (Click to play if it doesn’t run automatically on your browser).
Editor’s Note: For more on this subject, the great Jeff Sullivan at FanGraphs published a piece with the same premise less than a minute after this post went live. A lot of cool images and GIFs, go read it.
How Was The Game? (August 14, 2013)
A nice recovery.
Tigers 6, White Sox 4
After a few days of coming up short and a bad start to this one, the Tigers recovered nicely to win the final game of the series against the Sox. Rick Porcello (22 GS, 131 IP, 4.33 ERA, 3.42 FIP, 2.5 WAR) didn’t have a great first inning and had to pitch around 2 infield hits, but settled down nicely after the 3 run first and allowed no additional runs. He gave the Tigers 6 and allowed 3, while striking out 4 and walking 1. The Tigers scored in bunches today as Cabrera knocked a 3 run HR in the 3rd and the Tigers scored 3 in the 6th on an RBI single and then a horrible defensive play by the White Sox cornermen. Porcello gave way to the pen for the final three, who managed to keep the Sox from rallying back and sent the Tigers to win #70 on the season and a 6-4 road trip. In fact, Leyland called on Benoit for a five out save in a stunning turn from his refusal to use him in a tie game 3 times in the previous 5 days. The Tigers will return home for a five game series against the Royals in which they will have a shot to put some series distance between them in the Central. They will send Anibal Sanchez (24 GS, 164.1 IP, 2.58 ERA, 2.40 FIP, 4.2 WAR) to the mound for the first game on Thursday evening.
The Moment: Cabrera ties it with a no doubter to left.
