The Greg Maddux Way: A Simple Statistic

The great Greg Maddux (355-227, 3.16 ERA, 3.26 FIP, 114.3 WAR) once said the key to pitching is throwing a ball when the batter is swinging and throwing a strike when the batter is taking. That’s a pretty good general rule, but an astute observer would certainly recognize that a pitcher isn’t really equipped to predict such a thing terribly well.
But this did get me thinking, is there something to this idea despite other intervening reasons that confound it? Certainly, if you have a crazy slider that no one can hit, it doesn’t really matter where you throw it. Or a fastball that the hitter can’t handle. It’s also not like where you choose to throw the pitch and if the hitter swings are independent of each other.
So this is an exercise, plain and simple. The Maddux idea is a good one in principle, but it’s not that simple. We know that, he knows that, let’s just look into it for fun.
I drew from the 2012 season and looked at qualified pitchers (n = 88). I developed a simple statistics to quantify how Maddux-y they pitched.
mPercentage = (O-Swing% – League Average O-Swing%) + (-1)*(Z-Swing%-League Average Z-Swing%)
O-Swing% is the percent of the time a pitcher induced the opposing hitter to swing at a pitch he threw outside the zone and Z-Swing% is the same statistic for pitches inside the zone. The -1 is included so that both Maddux attributes are positive and can be added together without converging toward zero.
The results were pretty surprising because some pitchers at the top of the list are awesome and some are average and some are terrible. There isn’t a ton of correlation between this statistic and actual production. The two league leaders in 2012 mPercentage are Joe Blanton and Chris Sale. Cliff Lee is 4th, which sounds right, but Verlander is 42nd.

If you take a wider angle and regress ERA or FIP on mPercentage, you find that on average a 1% increase (i.e. 5% to 6%) decreases your ERA or FIP by 0.06 runs, which is not very much at all. mPercentage is statistically significant in both models, but not substantively significant at all. (The R squared is less than .11 in both.)
So what this tells us is that the Maddux Method doesn’t really exist in practice. Pitchers who induce swings on balls and takes on strikes are no more successful than those who do not. However, there is a obviously a two-way street at play here like I mentioned earlier. The Maddux Method works perfectly in theory, but we have an observation issue given that Justin Verlander’s strikes are much harder to hit than Joe Blanton’s, so he can throw more of them.
I like the Maddux philosophy of pitching, but it isn’t enough. You also need to have good stuff.
Plate Discipline and the Case Against Simplification
I’m not alone in viewing plate discipline as one of the most important skills a major league hitter can have. Picking the right pitches to swing at and the right pitches to take is extremely critical in providing offensive value, so it’s not surprising that plate discipline is a skill we like to chase when building a team. We also find that plate discipline is a skill that tends to be predictive and sustainable, which is another way of saying plate discipline isn’t as noisy as some other stats.
But how do we measure plate discipline? Walk rate (BB%) or OBP in relation to AVG are the standard ways of looking at discipline. If guys walk, they’re likely pretty good at deciding which pitches at which they shouldn’t swing. But that doesn’t really tell the whole story. There is still a lot of noise in walk rates and strikeout rates.
Consider some of the factors included in those stats. You can’t walk if pitchers don’t throw you pitches outside of the zone. You shouldn’t walk if you get good pitches to hit. Context matters too because you might be trying to hit for extra bases in some cases and singles in others, which would tend to change how you swing and what pitches you select. Power hitters will walk more because the risk of pitching to them is higher, even if their actual ability to recognize pitches is worse than that of a speedster.
A good number to look at is O-Swing% which tells us how often someone swings at pitches outside of the strike zone. Z-Swing% tells us how often someone swings at a pitch in the zone. But these numbers vary some by what pitches you’re getting. If you swing at 25% of the pitches outside the strike zone, but see a lot of pitches outside the zone, how does that compare to someone pitches outside the strike zone, but see a lot of pitches outside teh someone swings at awho swings at 40% of pitches outside the zone, but doesn’t see all that many out there?
There’s a lot of variation in all of these stats based on the context in which we observe them. Generally speaking, we want players to not swing at pitches outside the strike zone, so we want that O-Swing% to be low. But do we want hitters swinging at all of the pitches in the zone? Probably not. Not all strikes are created equally.
We also want the count and the situation to matter. A 3-0 pitch just outside and you should take. A 1-2 pitch just outside and you better swing. With all of the new Pitch F/X data, we probably aren’t that far away from being able to call up a players discipline graph so we can see which pitches each guy swings at in which counts against which pitchers and which type of pitch, but that information isn’t quite out there yet.
The lesson here is that while we usually try to boil things down to single numbers and easy to process information, the best strategy is almost always to look at lots of data. Batting average, for example, in a vacuum is a useless stat. Almost anything in a vacuum is useless.
I spent some time this afternoon working on crafting a formula that would best reflect plate discipline in one single number. I couldn’t do it. I kept trying to isolate the signal in the midst of noise, but couldn’t find a way to do it that was less complex that than status quo: Look at more than one piece of information.
We have a tendency to look for models or numbers that give us everything we need to know. We look for things that tell us how to interpret information instead of giving us the information that we interpret ourselves.
When we talk about Wins Above Replacement (WAR), we tend to do this. WAR sums it all together and tells us who the most valuable player is. This is good in broad strokes. I can easily see that Mike Trout outperformed Curtis Granderson with this protocol, but when we need to handle finer distinctions, we should be unpacking the data and looking at all of it.
Trout’s WAR exceeded Miguel Cabrera’s, but we’re better off if we take a look at each individual piece of information that goes into WAR because it gives you a richer picture of who is better. OBP, SLG, defense, speed, etc are all hidden inside WAR. WAR is shorthand. Which particular skills are does Trout beat Cabrera at and visa versa? We ask lots of question about who is the best player, but shouldn’t we ask who is the best at this particular thing? And the particular components of each of those things.
I tend to believe that more information is always better than less. When I want to think about who the most disciplined hitters are, I want to think about a lot of factors and weigh how much each matters in my head. I want to look at unfiltered information.
Let’s try this with the 2012 Tigers (min. 300 ABs):
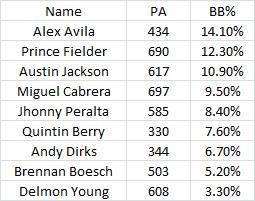
By walk rate (BB%), this is how the Tigers look.
By O-Swing% (swing percentage on pitches outside the zone):

By Z-Swing% (swing percentage on pitches in the strike zone):
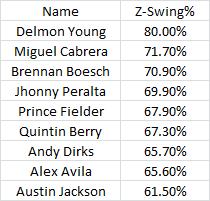
The information varies in each of these lists. There’s some correlation, but it’s not perfect. Taking pitches outside the zone makes it more likely that you walk, but lots of other things go into it. Cabrera swings at lots of pitches inside the zone, close to Delmon Young’s number, but walks a lot more than he does.
There’s so much that goes into each outcome that it’s easy to misinterpret the information. I’m pretty confident after looking at this information that Alex Avila is the more disciplined Tigers hitter, but there’s a case to be made for a couple guys for second place. And we haven’t even talked about what our eyes tell us.
When asking tough questions, instead of looking for the best number, let’s look for all the numbers. We’ll be better off.
