What The Tigers Bullpen Needs

The topic of conversation around the proverbial water cooler this week has been the Tigers fledgling bullpen. After all, over the last seven days the relief corps has allowed 26 runs in 24 innings while striking out just 19 of 125 batters. They have allowed more runs during the last week than they have recorded strikeouts. Not good!
Over the entire season, they’ve collected a 116 ERA-. That’s one of the worst marks in the league and it’s backed up by an RE24 of about -25 and a DRA of around 4.50. Whether you like the basic ERA (you shouldn’t) or the more advanced RE24 or DRA, the Tigers bullpen is allowing too many runs.
However, the fielding independent numbers paint a less bleak image. They have a 90 FIP- this year, which ranks in the top half of bullpen units. Their walk rate is reasonable and they don’t allow many dingers. Their strikeout rate is lower than you would like, but it’s not so low as to wash away their above average BB% and HR/9. Of course, FIP assumes that the outcomes on balls in play is mostly random and it’s easy to suggest the Tigers pen is giving up hard contact. They have an MLB worst .333 BABIP. Using the BIS quality of contact stats at FanGraphs, we can see that the Tigers have a very high rate of medium hit balls. Their soft hit rate allowed is low, but their hard it rate also doesn’t crack the top half of the league. Maybe it’s not a great profile, but it’s not like they’re getting toasted. They also have an MLB high 51.7 GB%, further indicating that they aren’t giving up tons and tons of gap shots.
Add this to a horrible LOB% and you basically have the issue. They have given up hits and they’ve done so in bunches. A good bit of that is luck. I know that’s not an explanation that makes people happy, but giving up single, singles, double, ground ball is the same as single, ground ball, single double even though the results are different. However, there is the matter of strikeouts. Strikeouts stop the bleeding and prevent runners from advancing, and the Tigers don’t get enough. They need more high K arms.
While Justin Wilson, K-Rod, and Shane Greene have done nice work in the pen, the rest of the crew has been middling or worse. Bruce Rondon looked great on Sunday, but it was his first outing of the year.
Bullpens are tricky to analyze because you get such a limited look at each reliever. Mark Lowe and his missing velocity are obviously a problem, but it’s hard to say it Wilson, Hardy, Ryan, Farmer, etc are bad or have just had some bad outings. No one expected a Yankees-Royals style bullpen, but the group looks better on paper than it has in a few years.
It’s easy to say the bullpen is another unmitigated disaster and the club has to go back to the drawing board, but I think that’s a short sighted approach.
Here’s what I would do. K-Rod, Wilson (J), and Greene are obviously not going anywhere for the moment. They need four other arms out there. I think Sanchez and Rondon make sense for different reasons. Sanchez because he needs to stay there until he’s ready to come back to the rotation (no home runs in 8 innings!) and Rondon because he’s a strikeout guy who looked great over his last several minor league outings. After that, they need a lefty and a righty. Alex Wilson is an option, but Joe Jimenez is probably ready to get his feet wet. And for the lefty – Matt Boyd. He’ll need a week to circle back to the active roster but the while he’s stubbed his toe a little in the rotation this year, he still has shown the stuff to get big league hitters out. If he’s put in a spot where he doesn’t have to face the best power hitting righties, he can easy back up Wilson as LHP2. Hopefully Lowe can find his way to the DL so the Tigers don’t lose him and any chance he has at earning that $13M deal.
This still isn’t the best pen in the league, and I’m only selling minor tweaks, but the club needs more guys who can get strikeouts and calling on Rondon, Jimenez, and Boyd should beef that up. Having Boyd and Sanchez around also gives the team better long options so they can stop carrying eight relievers (which should be against the Geneva Convention) and actually play with a full bench. And furthermore, Ausmus should be willing to stretch his good relievers out to face six batters when the situation calls for it. If your middle relief makes you nervous, pitch your better options more. Sure, they might burn out for October, but you have to make it that far in the first place.
The bullpen has allowed a bunch of runs recently but it’s not beyond repair. The Tigers are built to be in the mix for the AL Central and despite some really rough stretches this year they remain very much in that race. The team is going to win and lose based on the back end of the rotation, JD Martinez’ right elbow, and Jusim Upton’s bat. The bullpen isn’t going to carry them to the postseason but I also don’t think it will be the thing that keeps them from getting there.
Dissecting Jose Iglesias’ Offense
I don’t want to alarm you, but Jose Iglesias is not hitting well this year. After a good opening week or so, Iglesias’ bat has cratered. Observe:

While he’s never been a power threat, he’s no longer getting singles at the rate he has during his last two full seasons. Jose Iglesias with no power and a below average BABIP is essentially a replacement level player.
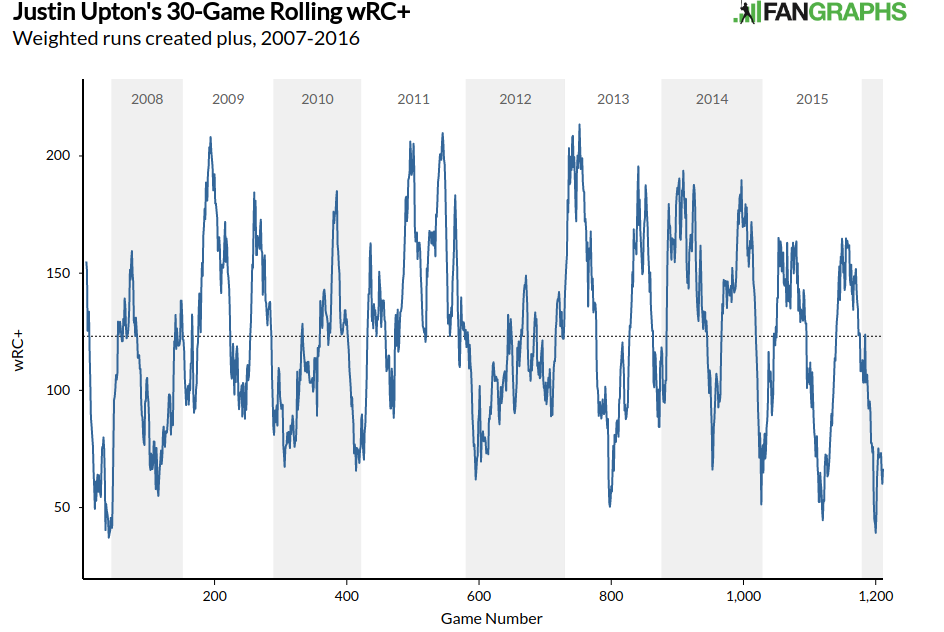
Now of course, it’s still only June and players are entitled to slumps. It’s not like Iglesias was expected to be a major offensive force. He’s a guy you’d be happy to see in the 90 wRC+ neighborhood and anything more is gravy. So while Justin Upton’s wRC+ in the 60s is very bad, Iglesias’ time down there is just kinda bad. All hope is not lost.
But I have noticed something about the way Iglesias is being pitched and felt it worthy of exploration. As you may know, Iglesias is one of the league’s best contact hitters. That is, he’s one of the hardest batters to face if you want a swinging strike. He may not bomb the ball around the park, but he makes contact. This year, pitchers are coming inside against him much more, potentially to generate weaker contact (which I’ll get to in a moment).

Those categories are based on two imaginary vertical lines that split the plate in third. Inside and outside extend for forever and middle covers the ~6 inches in the middle of the plate. Pitchers are definitely pitching inside more this year.
Here are those categories carved up into balls, called strikes, swinging strikes, foul balls, and balls in play. For 2015, 2016, and then a comparison.


As you may notice, inside pitches are resulting in more balls, similar strike numbers, and slightly fewer balls in play. Middle has lots fewer balls, lots more strikes, and fewer balls in play. Outside has more balls, fewer strikes, and about the same number of balls in play.
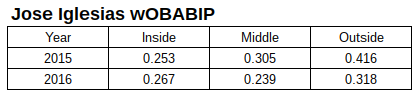
There isn’t an obvious implication for those values. Any of them could be good or bad depending on the value of the balls in play. So let’s look at that. Please note I called this wOBABIP to jive with the MLBAM “in play” tag, but it’s the same as wOBACON (as his homers are included).

This is interesting. Iglesias is seeing more pitches inside and is performing better against them when he puts them in play. Mix that with a relative push on balls and strikes and he’s doing better against inside pitches overall despite seeing more of them. However, he’s doing much worse on pitches down the middle and outside this year.
It could easily be the case that Iglesias’ desire to make contact against everything is actually harming his overall production because he’s had to focus inside more this year to the detriment of his production elsewhere. Down the middle, he’s taking more strikes and producing less and outside he’s producing less.
There are other explanations like health, sequencing, etc that might explain something like this, but this fits the facts on the ground. Iglesias is still making contact when he swings, he’s just not producing as much overall. It seems likely that this is partly due to pitchers challenging him inside and Iglesias having a tough time catching up to those pitches without sacrificing some oomph on the outer two thirds.
While I greatly admire his contact ability, it might be time for him to accept some swings and misses inside if it means doing a little more damage overall. Pitchers are attacking him differently and are winning, he needs to explore an adjustment.
The Anibal Sanchez Crossroads

After another rough start in which Anibal Sanchez allowed eight hits, two walks, and three home runs against a rather limited Angels offense, we find ourselves at a crossroads. I would typically prefer not to lean on a cliche for this kind of thing, but sometimes cliches exist because they capture an enduring condition. Anibal Sanchez is pitching poorly, he’s being pitching poorly for quite some time, and the Tigers have an opportunity to change direction now that Fulmer, Norris, Boyd, and Greene are all legitimate rotation options. With Verlander being Verlander and Zimmermann ready to come back, there is an out for Sanchez. It’s time.
I’ve written about this and I’ve tweeted about it even more. Anibal Sanchez isn’t flashing the same stuff he did when he was an ace, but I still maintain that his stuff is still mostly there. This isn’t a question of vanished velocity or a lack of movement overall, it’s about a lack of execution that has become too frequent to ignore.
While it’s hard to diagnose the precise cause of his troubles, the method of failure is obvious.
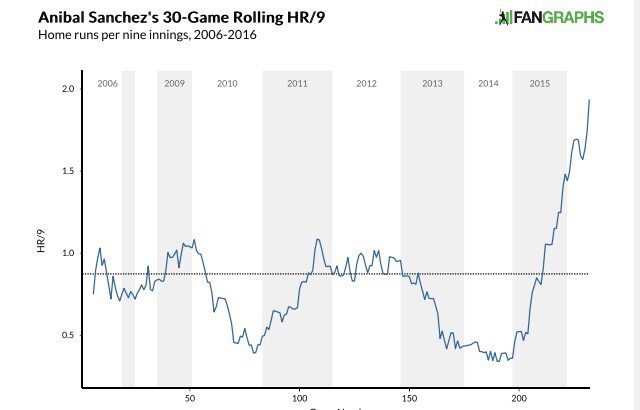
During Sanchez’s best seasons, he was preventing home runs at an elite rate. No one expected that to continue, but the way in which it has failed to continue is extraordinary. The chart shows a 30-game rolling average of his HR/9 by game. So the last point is his last 30 starts, the point at Game 150 is for career games 120-150, etc. The home run problem has exploded.
Home runs are funny. Most of the time, pitches influence whether they allow long fly balls, but the rate at which they clear the fence is pretty random. You can be homer prone, but even the worst pitchers don’t give up that many. Dingers are noisy and so when the problem started at the beginning of last year, it was easy for me to dismiss as one of those weird things. After all, the stuff looked fine. But it kept happening.
And now lately he’s been walking batters at an alarming rate.

The walk rate isn’t unprecedented like his HR rate, but they’re climbing back to pre-ace levels. You can walk batters in the show, but you can’t walk them if you’re also giving up a ton of HR. There’s no path forward for a pitcher like that.
Sanchez says he’s healthy and given how poorly he’s pitched, it would be easy to blame an injury if one was lurking at all. He’s not at peak velocity, but he’s at a workable velocity and he still gets break on his pitches. He’s just throwing too many bad pitches mixed in with the normal ones. At first you chalk it up to the randomness of baseball and clustering, but we’re 40 or so starts deep into this run. It’s time to worry.
Sanchez has indicated some of this is mental. I try not to psychoanalyze players, but if he’s offering it as an explanation I’ll give it credence. Sanchez has given the Tigers about 10 WAR during this contract and even if he never pitches for them again it won’t be much of a loss. This isn’t about salvaging a disasterous contract or wishing the club had gone another direction, it’s about finding a way to get Sanchez back to useful status.
The best path is probably to send him to the bullpen. Tell him to focus on preparing for 3-6 batters per outing and try to give him a schedule. Let him concentrate on a small task and work back up to longer outings. At worst, he’ll offer some bullpen depth and at best it will give him a chance to reset himself without the pressure of going 6-7 inning each time. It might not work, but it’s better than sending him to Toledo to pitch against inferior opponents with low stakes.
Sanchez has been one of my favorite players since he arrived on Detroit and had previously been the recipient of one of my Twitter things. It’s been hard to watch the wheels fall off over the last year and a half, but there’s really no way to ignore it anymore. The best thing for him and the team is to move him to the bullpen and hope that we haven’t seen the final Anibal Sanchez Night in America.
Verlander’s Slider Is Basically A Cutter Now
I’m certainly not the first person to notice this, nor is it much of a secret after his last outing, but Justin Verlander’s slider is slowly becoming Justin Verlander’s cutter. As a brief review, you would expect a cutter to be faster and flatter than a slider, which would typically have more depth to it. However, it’s important to remember that “slider” and “cutter” are just words we use to group pitches together based on how they behave. Everything is a continuum.
First, a look at Verlander’s average pitch velocity by game this year:
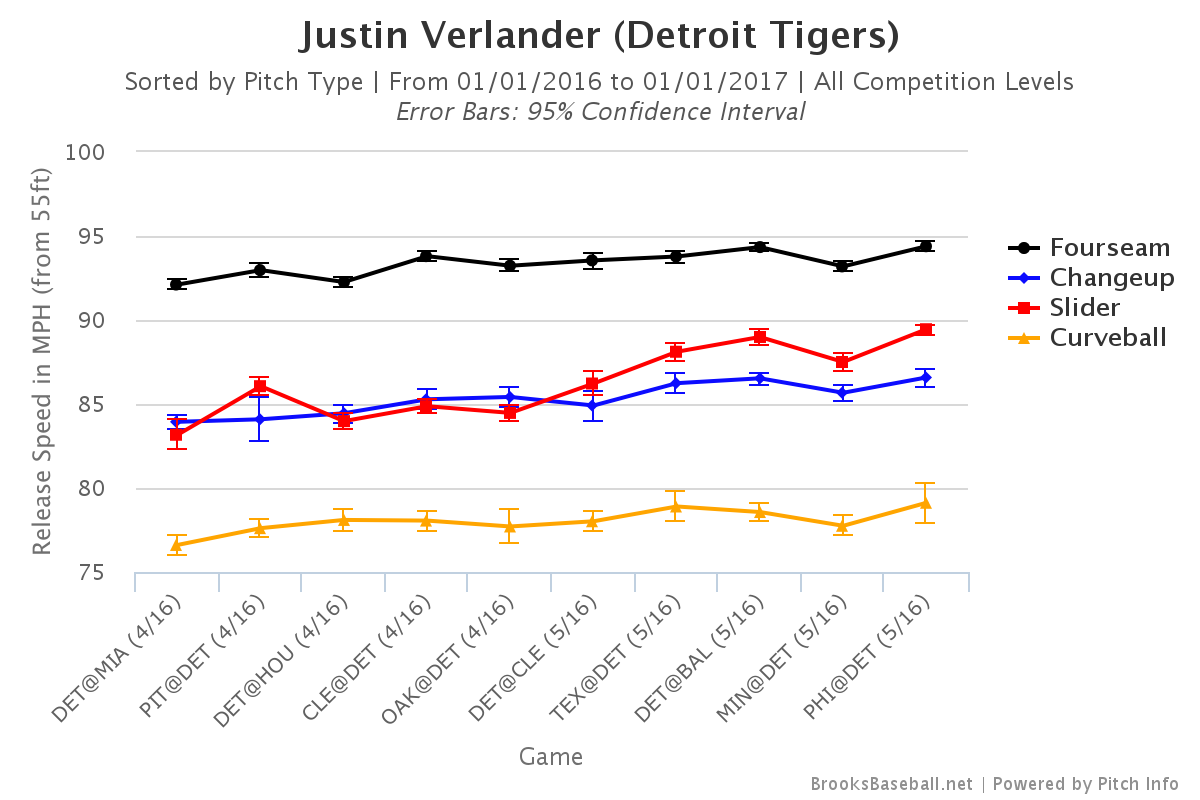
It’s pretty clear that the pitch Brooks calls a “slider” is coming in faster over the last four or five starts. This coincides with “less” vertical movement. Keep in mind that vertical movement is relative to how the pitch would behave if it wasn’t spinning. No pitch actually rises from an overhand throw:

Here’s a plot of individual pitch velo and vertical movement for his “sliders” this year:
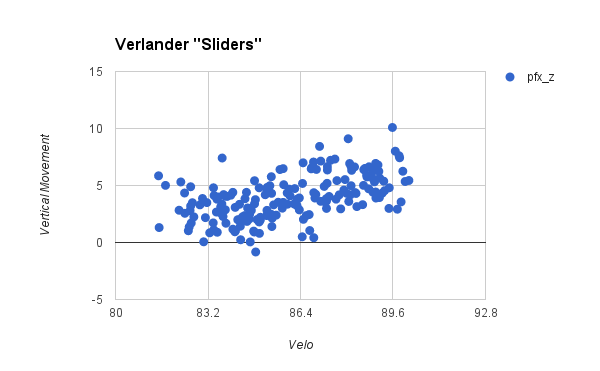
There’s a clear correlation between velo and movement, which is exactly what we would expect if they were different pitches. If Verlander happened to just be messing with velocity and movement independently, we would see a more random relationship here. Verlander, instead, is throwing one version with more depth and less velo and one with more velo and less depth. In other words, a slider and a proto-cutter.
Here they are by month, notice the gap:
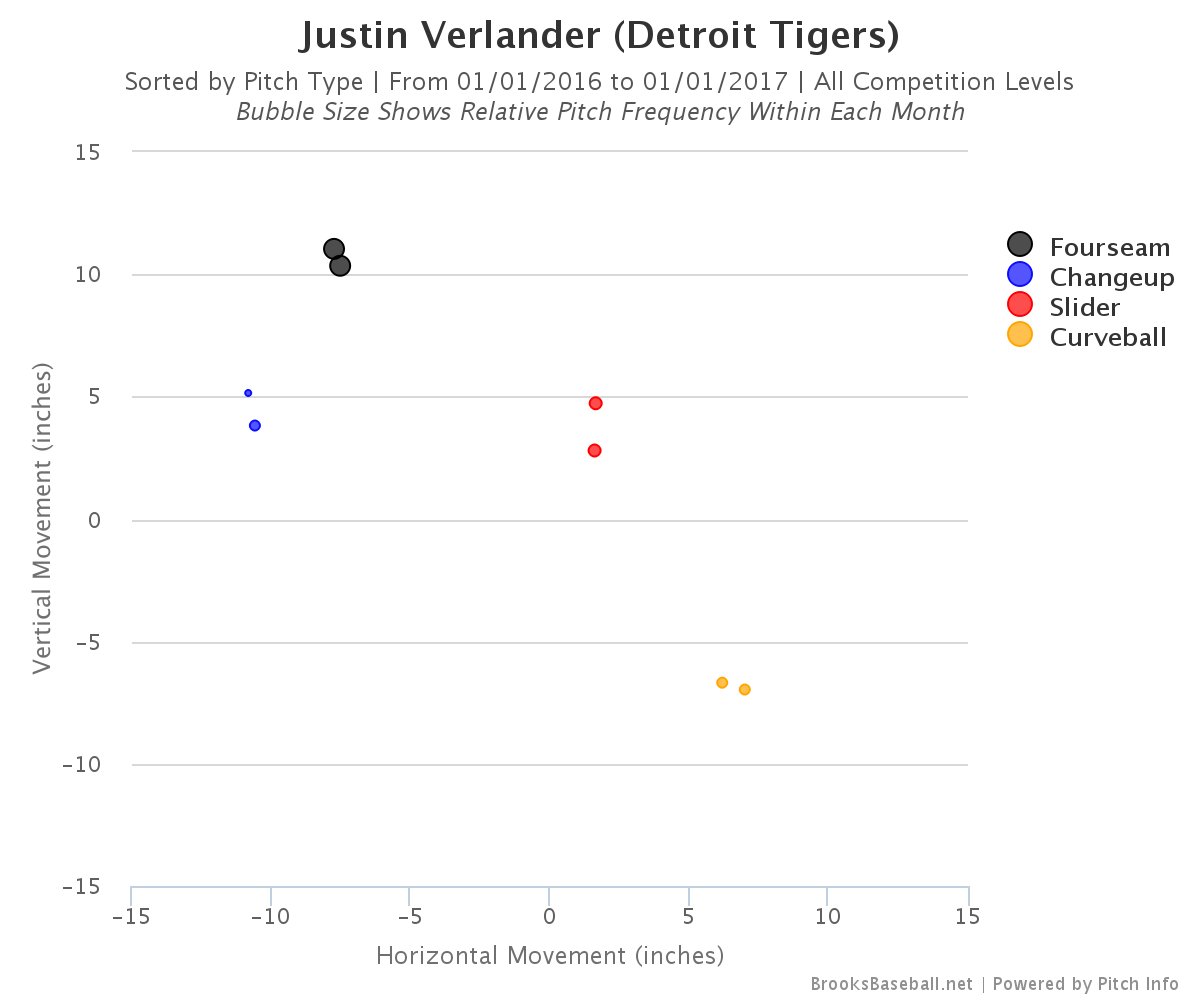
It’s not clear if Verlander is junking the slider in favor of the cutter or if he’s going to throw both. I looked at the relationship by date on a more granular level and the pitches I see as cutters are basically crowding out the sliders. He’s not really adding cutters to his mix, he’s using them instead of sliders. That could be strategic or it could be because he’s just found a way to throw the pitch in a way he likes better that has turned it into a cutter.
It’s too early to say if this is a good choice or what the full implications will be, but he’s looked better since he started using the cutter over the slider. At the very least, it’s visually appealling to see him toss fastballs that break in opposite directions.
James McCann Might Be Learning To Frame
Last season, James McCann’s overall production wasn’t very good. Granted, he was a 25-year old catcher in his first full MLB season, so we don’t want to bury him for not being a superstar. In 2015, McCann had an 85 wRC+ in 425 PA to go with his 1.0 fWAR. His arm was on display on numerous occasions even when his bat slumped as the year went on. A 1 WAR year for a rookie is nothing at which to sneeze, except for the fact that FanGraphs WAR doesn’t include catcher framing (the ability to get strikes on borderline pitches) and McCann rated extremely poorly according to the models provided by BP and StatCorner.
To remind you, BP had McCann at -16.6 framing runs and StatCorner pegged him at -15.6 framing runs. BP’s model is more nuanced, bu given that both models agree, we don’t need to dive too deep into the differences. McCann cost the team about 15 runs last year based on his difficulty receiving the baseball. That works out to -1.6 wins, turning the back of the envelope WAR value into a paltry -0.6 WAR for 2015. Uh oh.
Now, I wrote last season that I wasn’t worried about McCann’s early framing numbers because there are a lot of reasons why a catcher might struggle out of the gate without being a lost cause. In fact, this year McCann is at +0.6 runs via BP and +0.8 via StatCorner. That might not seem like a great number, but on a per pitch basis, he’s improved from -0.016 called strikes per chance to +0.003 according to BP. That’s a 17-18 run difference over 7,000 chances, which equates to a 1.8 WAR difference (approx). In other words, if you put 2016 McCann framing on 2015 McCann, you might have 1.2-1.4 WAR player instead of a -0.6. Big difference.
That’s a long way of saying, McCann’s framing numbers have been much better over the first ~month of his 2016 season. There are a lot of framing chances in a season, so the sample stabilizes quickly enough that it’s not like we’re dealing with an irrelevant sample. It’s far from determined, but it’s not like we’re looking at HR in a month compared to HR in a year.
To walk through this, I want to break the numbers down a bit rather than just showing you the bundled up BP/SC numbers. Communicating framing in runs is useful, but it’s also difficult to grasp in some cases. Let’s start with the MLB strike zone. Keep in mind, this is not the strike zone as it’s called, it’s the strike zone as defined. Fortunately, for our purposes, we’re comparing two similar seasons so it won’t be a big issue.
This is from the catcher’s perspective.
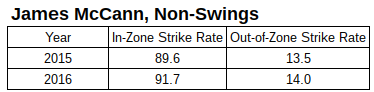
If you just look at in/out of zone strike rate on all non-swings, McCann is getting 2% more strikes in the zone and 0.5% more strikes out of the zone. Keep in mind this is against RHH and LHH and there are no controls for ump/count/etc. Those things matter and they’re folded into the BP number, but this is meant to unpack.
If McCann had the 2016 rates based on his 2015 total pitches caught, we’re talking about a difference of 68 strikes. At a rate of 0.13 runs per strike, that’s a 9 run increase if you’re only looking at zone/out of zone and not paying any attention to where the pitches really are on the grid.
Let’s go a step further. Here are the percentage differences by zone. Use your imagination to draw the lines for the four out of zone boxes.
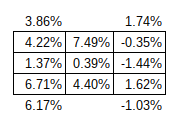
McCann is improving greatly on glove side pitches at the expense of his performance on his throwing side. Granted, the gains are large enough to offset the losses, so there’s a net gain. Let’s look at McCann vs the league by percentage. The league baseline is 2015 in both cases.
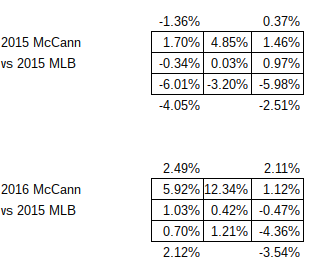
He has improved dramatically in the places he’s improved and the losses down and away are much smaller.
Now of course, none of this will matter if McCann doesn’t find his bat in 2016. A 5 wRC+ isn’t something you can survive no matter how good you are on defense. And there’s also no guarantee his framing won’t regress because we’re not totally sure what’s causing it. He’s catching lots of new pitchers and hasn’t seen nearly as many different teams and umpires as he did last year. There’s a lot of season left, but the early returns are really encouraging.
Taking A Look At Castellanos’ Defense
If you happen to have just emerged from a year-long slumber, you might not be aware that Nick Castellanos now hits baseballs pretty well. So far this season he has a 162 wRC+, and while that’s propped up by a sure-to-regress .398 BABIP, there is a very real power spike driving the improved offense that dates back to late June 2015.
It’s not clear if Castellanos will be a 115 wRC+ or a 140 wRC+ guy when things settle, but he’s definitely done enough to convince me (and most people) that he’s taken a big step forward with the stick after two seasons of a 94 wRC+.
But while Nick was unimpressive with the stick during his freshman and sophomore campaigns, the big problem was his glove. If you can run a 95 wRC+ as a 22-23 year old third baseman while playing solid defense, you’re a pretty promising and useful player. But Nick didn’t play solid defense, he played somewhere between awful and not good defense over his first two seasons, and unfortunately defense typically doesn’t improve as players age. You often grow into your offensive potential, but if you can’t field when you debut, chances are you won’t be able to field throughout your career.
That being said, Castellanos’ early struggles were unusually pronounced and with hard work and good coaching, we figured some of it could improve. After all, his arm is fine and he doesn’t have hands made of stone. Any scout worth their salt would put a below average grade on his glove, but you had to watch him a decent amount to really see the magnitude of the flaws.
Yet there has been talk this year that Castellanos looks like an improved defender. I’ve heard it from announcers, beat writers, and fans throughout the year as he’s made a number of good plays at the hot corner. Personally, I’m not sure I would have taken this position – I think he looks about the same as last year – but it’s not like I’m inventing a strawman just to tear it down. This is an opinion that’s out there in the world.
The metrics disagree (caveats in a moment). In 281 innings, he has a -4 DRS, -3.1 UZR, and a .650 revised zone rating. That RZR looks a lot like his 2015 mark and the DRS/UZR look like his 2014 numbers. So either he’s as bad as last year or he’s been as bad as he was in his disastrous rookie year. If you look at the Inside Edge numbers, he’s doing poorly on balls in the 40-60% bucket, and no better on balls marked 60-90% or 90-100%. In other words, statistically he’s been as bad or worse than his previous defensive seasons.
Now, some caveats apply to the data. First, 280 innings is not a sufficient sample size for a couple of reasons. For one, there is measurement error in these statistics that requires a large sample to even out. We haven’t yet built metrics around Statcast, so the numbers still rely on humans to input data into an algorithm and humans sometimes get the coding wrong. Those errors shouldn’t be biased in one way or another, but you need more than 300 innings before you can discount it.
Second, most defensive plays are very easy which means that fielders separate themselves based on a small number of difficult plays. Even a great defender might have bad numbers over a couple of months simply because of when their misplays occurred. This is even more pronounced in an era of shifting, in which a number of plays get thrown out of the sample. Third, defensive metrics lag a bit so if you think he’s made a zillion great plays in the last two days, it won’t necessarily show up right away.
To be clear, I am not saying this early season data indicates Castellanos is definitely still bad at defense. I am saying the numbers so far aren’t showing anything different than his first 2,300 innings. Basically, while there is statistical evidence of an offensive breakout, there is no early indication that his defense has improved.
One thing I like to do with defense is to take a step back and work through the question in a rudimentary way. Yes, Castellanos’ runs saved numbers aren’t good, but it can be instructive to look at a deconstructed version that looks only at hits/outs rather than hits/outs and run values. Let’s dive in.
Let’s carve the infield up into zones based. Let’s say the third baseman is responsive for covering 45% of the left side of the infield (we’ll also do 35%) and let’s look only at ground balls. Line drives might matter, but some are going to be totally uncatchable too. This is meant to be basic, remember. The following is for all Tigers third basemen, of which Nick covers most of the innings. The first table shows 45% of the left side and the second shows 35% of the left side, starting from the line, and reports on ground balls only. There are no controls for anything else (i.e. were the hits singles/doubles, how hard was the ball hit, which balls didn’t get fielded, batter handedness, pitcher quality, etc). Errors aren’t included, but they have been basically constant.

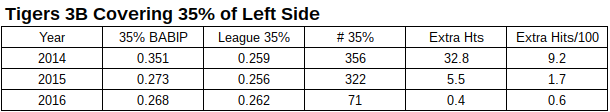
If you look at these tables, the numbers are striking for 2014 and 2015. The Tigers allowed many, many more hits on balls in play than the average (the league includes the Tigers, FYI). This was especially true in the 45% category. This year, the numbers are much better in the 45% category and a little better in the 35% category from last year and much better from 2014.
Let’s unpack this. Now keep in mind, the shortstop and pitcher are involved here. If Igleisas makes a play way into Castellanos’ territory, this method won’t know the difference. The metrics are smart enough not to count that in Nick’s favor (it also won’t penalize him for it). Realistically, what we’re seeing here is the Tigers getting better at pinching off the 5.5 hole between the two fielders from 2015 to 2016.
During 2014, 33 of the 45 extra hits occurred in the 35% zone and 12 occurred in the 35-45% zone (give or take). That’s 74/26 split. In 2015, it was a 29/71 split. This year, it’s a 24/76 split. What does that mean? It means that 2014 was a disaster across the board and that the problem area in 2015 was mostly to Castellanos’ left/Iglesias’ right. Given that we know this is where Iglesias struggles, it makes perfect sense.
Let’s carve out that middle zone by itself:

In 2015, the Tigers got much better at turning batted balls into outs in the 35% zone than they were in 2014. This year, they maintained they’ve gotten a little better in that zone but they have gotten a lot better in the 35-45% zone between the third baseman and the shortstop after being really bad in 2014 and worse in 2015.
I don’t know if this is Iglesias getting better to his right or Castellanos getting better to his left, but there’s definitely something good happening here.
Does this mean the metrics are wrong and Castellanos is actually getting better? No, not yet. For one, this could all be Iglesias/Romine. Two, this doesn’t include line drives. Three, and most importantly, we didn’t control for the actual difficulty or run values of the plays. In other words, the raw number of hits and outs look really positive, but if Nick’s misplays have been particularly bad and his good plays haven’t been particularly good, it’s perfectly reasonable and correct for his metrics to look the way they do. After all, the Tigers haven’t cracked league average in any of these zones in terms of out rate, so if the they’re screwing up easy balls this would make a lot of sense.
What I think this exercise shows is that there is an inherent logic in thinking Castellanos has been getting better. There are fewer balls going for hits near him. From 2014 to 2015, his metrics improved a lot, which is pretty consistent with the data shown here. From 2015 to 2016 (sample size warning) the metrics haven’t gotten better but this data has. You can read this to say that 1) his metrics will improve with a bigger sample, 2) Iglesias is getting better, 3) the added complexity of the metrics is seeing something this doesn’t. It’s probably some from each.
All told, I do think there are positive signs in the data for Castellanos’ defense, but I trust the metrics (even in small samples) which say it hasn’t shown up in the totality of his performance just yet. He can simultaneously improve and not yet show the fruits of that improvement in his numbers. It’s the same as a player dramatically improving the quality of his contact but still not getting hits for a few weeks. It’s possible that Nick is better and he just hasn’t translated it into results, or it could simply be that the metrics are smart enough to see beyond BABIP, or that it’s Iglesias who is truly improving.
Let’s Dissect The Various Reasons To Panic
The Tigers are 15-18 and have lost 8 of 9 games. In typical Tigers fan fashion, the panic has arrived in earnest. The Tigers haven’t played well and blame is flying. Ausmus sucks (he does)! Justin Upton is a bust (well, hold on a second)! The pitching is terrible (I mean…)! Before we get ahead of ourselves, let’s run through the problems with the team’s performance so far in an effort to litigate the actual problems.
The Starting Pitching is Bad!
Yes, yes it is. Using park-adjusted ERA, they are the 6th worst group of starters in the game. They’re 9th worst by FIP and 5th worst by xFIP. The results are bad whether you look at run outcomes or fielding independent components. They’re striking out 18.2% of batters and walking 9.7%, which is the fourth worst differential in the game.
Zimmermann has been the star, but his runs allowed will catch up with his fielding independent numbers. Verlander’s been okay and might be putting it together. Sanchez has looked okay, but he’s still giving up home runs like he was last year. Pelfrey has been very bad.
I wasn’t expecting a whole lot out of Pelfrey, but he’s shown nothing to suggest he’s going to provide any sort of positive value. Sanchez still has the talent, but the longer he goes without correcting his dinger problem, the more it starts to look like a feature of his game rather than a bug. The Fulmer/Greene/Norris group is probably going to be able to hold down a spot, with the underrated Matt Boyd available to help.
But even if Verlander’s pretty good, that’s a weak rotation. They needed something from Pelfrey and something pretty good from Sanchez. It’s still early, but we haven’t seen signs that’s coming.
If you want to panic about the starting pitching, that’s probably fair. It’s going to get better, but I’m not sure it will get good.
The Bullpen Has Been Bad This Week!
The bullpen has struggled a bit as of late, but now isn’t the time to be worried. They have a 93 ERA- and 95 FIP- as a group. Even with the meltdowns, they’ve been a pretty respectable unit. The Wilsons are good. Lowe is good even though he’s had a rough week. K-Rod will make you nervous but he’s still talented. And all of the other guys are perfectly fine in middle relief.
This isn’t going to be a great pen, but it’s not going to be a disaster and it’s not going to turn an otherwise good team into a loser.
Justin Upton Can’t Hit!
Upton is a streaky player, but the cold streaks come with hot streaks. Just wait for the hot streak.
Breathe.
Cabrera and Martinez Aren’t Hitting Like Cabrera and Martinez!
Cabrera is just going through one of those little power funks. According to the new Statcast expected run values, Cabrera is hitting the ball much better than his results indicate. The same is true for JD Martinez. Give him time and the numbers will level out.
Gose, McCann, and Iglesias Aren’t Hitting At All!
This is probably the hitter Gose is. Lots of strikeouts, decent walk rate, slightly below average power. That’s not a good hitter and we’ll have to see if he can make up for it with the glove. The comforting thing here is that he’s supposed to be a part time player, he’s just getting exposed with the injury to Maybin. Presumably Maybin will come back.
Iglesias is worrisome. He got off to a good start and has gone ice cold. He doesn’t have to hit like VMart to be valuable given that he’s a solid shortstop rather than a DH, but he’s locked into one of the worst stretches of his career at the plate. He’ll come out of the dive, but I’m not sure how quickly.
McCann is really struggling, but we’re talking about a small sample after being rushed back to big league action after the ankle injury. It’s not good, but it’s not a reason to panic. He might not be a good hitter, but we knew that based on his 2015. His 2016 is not yet changing any minds.
So, Can We Panic?
Give it some time. This is an offense that will score a lot of runs and the bullpen is much better than we’re used to. I know you want to think “oh god it’s happening again” every time they struggle, but most bullpens have bad stretches. They will recover.
The concern is the starting pitching and lack of depth. As we’ve seen with Gose, the Tigers aren’t protected anywhere but the corners. Moya is coming up to help, but they are relying on the offense to take them to the promise land and the pitching probably can’t survive if there is a big drop in run scoring.
I’m not ready to panic, but the team didn’t have much margin for error to begin with, so it’s probably reasonable to think they’re on tilt. This is not a good enough roster to bank on a 20-8 run somewhere down the line.
Teams Are Swinging Less At Verlander’s Breaking Balls
In an effort to distract us from the crushing weight of six straight losses, we turn to the one positive from Sunday’s game: Justin Verlander. Entering Sunday’s action, Verlander had made six starts in 2016, allowing seven runs twice and allowing seven total home runs. His strikeout and walk rates weren’t terrible, but certainly no one would have argued he had gotten off to a good start. Maybe you weren’t worried, but it’s not like you were totally not worried either.
Verlander went seven innings, allowed no runs, struck out nine, and walked just two yesterday. It was exactly what the team needed from him, even if the rest of the team didn’t cooperate. Even more encouraging than typical results was that Verlander generated 20 swinging strikes after topping out at 14 during his first six starts and hitting a low against Cleveland of just five. In other words, this wasn’t a good luck start, it was a well pitched game.
Now one well pitched game doesn’t a comeback make. In fact, there’s something I noticed when watching Verlander the last two starts that stuck in my mind that could either be a data point in favor of the comeback or against it. It concerns his breaking balls.
Let’s start with the basics. Since developing the pitch, Verlander has slowly shifted his slider above his curve and change as his go-to non-fastball.

And this year, batters have swung at the slider and curve far less often than they have in the past:

It breaks down by handedness. Righties don’t chase the slider, lefties don’t chase the curve. (Using 2009-present to account for the advent of the Verlander slider)

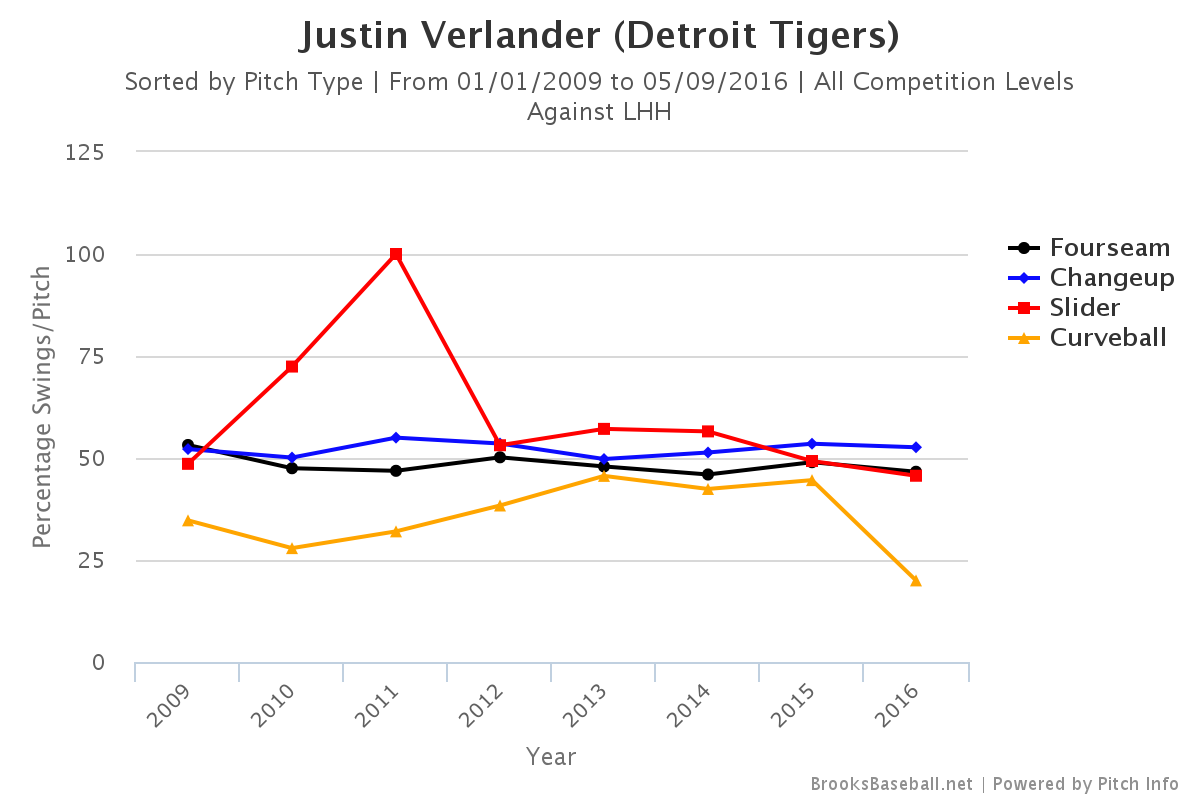
Really any pitcher who throws a slider and a curve will throw the slider more to righties and the curve more to lefties based on the nature of the movement, so it’s not surprising that we’d see the effects split like this by hand, but it is interesting that teams have started to lay off his breaking balls this season in way that we haven’t really seen ever for his slider and in several years for his curve.
Let’s collapse them into a single pitch:

Here’s the thing about this graph, I don’t know if it’s good or bad. It seems like you’d want batters swinging at your breaking balls because that’s where you might get a lot of chases, but some of the best Verlander years occurred when teams didn’t swing at his breaking balls. This is one of the interdependent things that won’t be easy to parse.
Are teams laying off the breaking balls because they’re observing improved breaking ball stuff/usage and want to avoid them. Or are they laying off because they view the fastball as increasingly hittable. It’s too early to talk about results, but the power against his fastball is way up (.286 ISO). This early in the season that’s mostly driven by a couple home runs, so I won’t make too much of it, but this is something to watch.
Are teams signaling that they’re seeing an improved Verlander or a worse Verlander by the way they’re laying off his breaking stuff? I don’t know the answer, but movement-wise the breaking balls do seem a little sharper so far this year compared to last. Hopefully that means teams are pulling back on their approach of ambushing his hangers rather than starting to zero in on a fastball that is becoming exploitable.
JD Martinez, Constantly Evolving
If you’re reading this website you’re familiar with the JD Martinez breakout. He remade his swing between 2013 and 2014 and he started hitting the ball much harder. That led to more hits and more power. Instead of being a below average hitter, he became one of the best dozen hitters in the league.
Given his low walk, high strikeout profile, we spent much of 2014 holding our breath. Guys who slug like Martinez without great discipline are frequently exploitable. We waited for the exploitation and it didn’t come. And when Martinez picked up where he left off in 2015 and had another great season, the white-knuckling stopped. JD Martinez, Actually Good!
From a results standpoint, his 2016 season has been a little worse. Instead of the 140-150 wRC+ range, Martinez is in the 120-130 neighborhood. That drop would be more concerning if we were more than 100 PA into the season, but even if you’re someone who overreacts, Martinez is still hitting well, even if he isn’t hitting like an MVP candidate.
What’s interesting about Martinez in 2016, however, is that he’s striking out much less often while also walking more. Here are some numbers (everything entering Sunday).

The better BB% and K% is encouraging. A walk is better than a ball in play and a ball in play is better than a strikeout, so any time you can add walks and cut strikeouts, you’re in good shape. And while 100 PA is just 100 PA, the better discipline results are supported by his lower swing rate.

Pitchers are challenging him with fewer pitches in the zone, and Martinez is swinging less often, particularly on pitches outside the strikezone. In other words, the Martinez isn’t swinging at the pitches that used to be in the zone but are now outside the zone.
You can get a sense here graphically:

All things being equal, more walks and fewer strikeouts is good. The only concern you might have is that this less aggressive approach is cutting down on his power. His ISO is down a non-trivial amount. Is that just small sample fluctuation or is he actually hitting the ball more softly?
Using Statcast Exit Velocity, Martinez is averaging 91.5 mph this year off the bat after a 91.8 mph average in 2015. That’s basically nothing, but contact quality is also about the angle at which the ball is hit. Hitting it 92 mph into the ground is different than on a line and different than in the air.
It’s obviously a much smaller number of balls in play for 2016, but the general shape of the chart looks the same. We could run an expected ISO using the Statcast data, but it looks to me like he’s probably just hit a few more ground balls this year when he would have otherwise elevated them last year. He’s averaging a launch angle of around 15 degrees this year when it was 16 last year. Could this be a minor problem that is costing him a little power? Sure, but it’s way to early to think it’s anything more than normal batted ball variance.
As with everything, it’s early. But pitchers are being more cautious with Martinez this season and Martinez appears to be adapting by taking more pitches. As long as it’s not sapping his power, this is going to wind up being a boon to his overall numbers and his ability to age gracefully.
Nearly Un-Salted Territory
Going into the season, Jarrod Saltalamacchia was lined up to function primarily as the Tigers backup catcher. The switch-hitting backstop was known for doing damage against RHP, but his lack of defensive skill and weakness against lefties made him something less than a full-time player. That’s why the Tigers got him for basically nothing.
Yet one McCann injury and 55 strong PA later, Salty is enjoying quite the honeymoon in Detroit. His 176 wRC+ is something you might expect from Cabrera, propped up on stats that would make Adam Dunn blush: 12.7 BB%, 38.2 K%, .408 ISO. This is obviously a small sample size kind of thing, as no one would suggest Salty is actually one of the five best hitters in baseball.
But this impressive stretch is somewhat compelling, even given the acknowledgement that it isn’t sustainable in any way.
It’s interesting because this is essentially the best 15 games of Salty’a career offensively coming right after the worst stretch. The graph below shows his rolling wOBA average over 15 game samples. He’s done this before on two occasions, but it’s striking how bad he was leading up to this year.
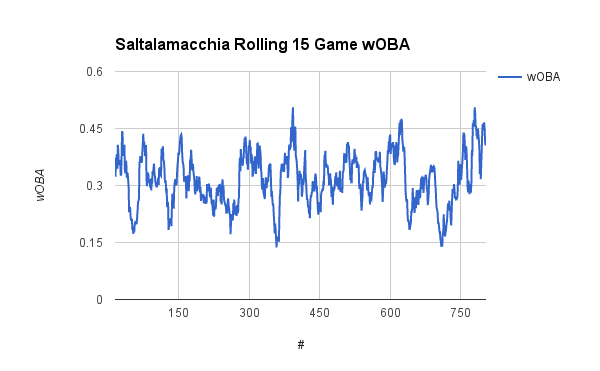
What’s most interesting to me is that Salty has really sold out for power. The rate at which he’s pulling balls and hitting fly balls is off the charts. I don’t want to make a whole lot of a couple dozen batted balls, but it lines up with the general idea: Salty is looking to do damage and doesn’t mind if he strikes out in the process. That’s always been true, but right now it’s working.
Salty’a hot start doesn’t mean he will keep hitting like this forever, but I think he’s demonstrating proof of concept. He can provide the Tigers with some left-handed thunder off the bench to keep teams from exploiting the RHH heavy Tigers late in games. The Tigers really lacked a power bat off the bench the last few years and if McCann comes back and performs, Salty can be that. If McCann struggles, the Tigers appear to have something more than a replacement level option on which to fall back.
