Stat of the Week: Expected Fielding Independent Pitching (xFIP)

Generally, I’ve been a little light on “weekly” updates to this feature, but I generally write at least one statistically informative post a week, even if it doesn’t actually follow the mold I’ve laid out. Today, I’ll try to write that wrong with an introduction to the very useful Expected Fielding Independent Pitching (xFIP).
You may recall my introduction to Fielding Independent Pitching (FIP) some months ago and my frequent use of the metric on the site. You can read my introduction to FIP or Fangraphs’ primer to catch up, but I’ll outline the basic concept because it carries over.
We use FIP because ERA is not a reflection of a pitcher’s individual performance because he cannot control what his defense does once the ball is put in play. Two pitchers who are carbon copies of each other will perform differently if you put them in front of the Dbacks defense (currently the league’s best) and the Angels defense (one of the league’s worst so far) despite throwing identical pitches to identical hitters. ERA is a reflection of the team as a whole, not just the pitcher.
In steps FIP or a class of numbers coming from this idea, to measure a pitcher’s performance based only on what we know he can control. FIP takes strikeouts, walks, and homeruns and uses historic run values to calculate a number on the same scale as ERA so that you can see which pitchers are succeeding in the areas of the game they can control. Generally speaking, defense evens out over a long enough period and ERA, FIP, and our new friend xFIP will converge toward each other.
The FIP formula looks like this:
FIP = ((13*HR)+(3*(BB+HBP))-(2*K))/IP + constant
So what exactly is xFIP? xFIP, as you can read about on Fangraphs, takes this one more step. xFIP is the same as FIP except it normalizes HR/FB rate to give you a number that better predicts future performance.
It’s actually pretty simple, just stay with me. Generally speaking, we’ve found that the percentage of a pitcher’s flyballs that are hit for homeruns will converge toward about 10% and that large variations from that number are not sustainable. If you allow more flyballs, you’ll allow more homeruns, and that will cost you in FIP and xFIP, but if you’re allowing half of your flyballs to go for homeruns, it’s likely that won’t happen for very long.
So xFIP looks like this:
xFIP = ((13*(Flyballs * League-average HR/FB rate))+(3*(BB+HBP))-(2*K))/IP + constant
As you can see, it’s the same formula, but it takes your flyball rate and multiplies that by the league average HR/FB rate to get a more predictive version of your HR rate going forward. xFIP is one of the best indicators of future performance we have and it is very useful in evaluating which pitchers are getting lucky and which pitcher’s are actually performing in line with their skills.
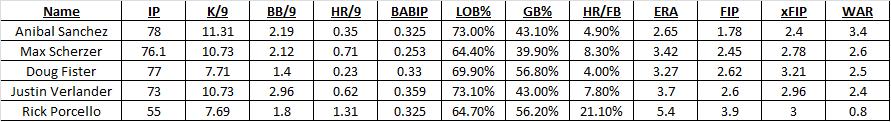
If we scan the Tigers 2013 leaderboard right now (digits truncated), you can get a sense of how this works. As expected, all of the Tigers have better FIP than their ERA because they play in front of a poor defense, but all of their xFIP are slightly higher than their FIP (except for Porcello) because they are allowing a lower than average HR/FB rate. Porcello, on the other hand, has very unlucky 21% HR/FB rate, so his xFIP is better than his FIP. Again, xFIP correlates better with future performance than almost any other ERA estimator.
Personally, I like to look at FIP to see how a pitcher is doing and use xFIP to see how fluke-y his homerun rate is. They’re both good metrics and they are both better indicators of individual performance than ERA.
Want to learn about a statistic? Request one for the next edition in the comments section or on Twitter @NeilWeinberg44. If you’re looking to catch up on sabermetrics, check out New English D’s posts on FIP, WAR, wOBA, wRC+, and ISO.
