Plate Discipline and the Case Against Simplification
I’m not alone in viewing plate discipline as one of the most important skills a major league hitter can have. Picking the right pitches to swing at and the right pitches to take is extremely critical in providing offensive value, so it’s not surprising that plate discipline is a skill we like to chase when building a team. We also find that plate discipline is a skill that tends to be predictive and sustainable, which is another way of saying plate discipline isn’t as noisy as some other stats.
But how do we measure plate discipline? Walk rate (BB%) or OBP in relation to AVG are the standard ways of looking at discipline. If guys walk, they’re likely pretty good at deciding which pitches at which they shouldn’t swing. But that doesn’t really tell the whole story. There is still a lot of noise in walk rates and strikeout rates.
Consider some of the factors included in those stats. You can’t walk if pitchers don’t throw you pitches outside of the zone. You shouldn’t walk if you get good pitches to hit. Context matters too because you might be trying to hit for extra bases in some cases and singles in others, which would tend to change how you swing and what pitches you select. Power hitters will walk more because the risk of pitching to them is higher, even if their actual ability to recognize pitches is worse than that of a speedster.
A good number to look at is O-Swing% which tells us how often someone swings at pitches outside of the strike zone. Z-Swing% tells us how often someone swings at a pitch in the zone. But these numbers vary some by what pitches you’re getting. If you swing at 25% of the pitches outside the strike zone, but see a lot of pitches outside the zone, how does that compare to someone pitches outside the strike zone, but see a lot of pitches outside teh someone swings at awho swings at 40% of pitches outside the zone, but doesn’t see all that many out there?
There’s a lot of variation in all of these stats based on the context in which we observe them. Generally speaking, we want players to not swing at pitches outside the strike zone, so we want that O-Swing% to be low. But do we want hitters swinging at all of the pitches in the zone? Probably not. Not all strikes are created equally.
We also want the count and the situation to matter. A 3-0 pitch just outside and you should take. A 1-2 pitch just outside and you better swing. With all of the new Pitch F/X data, we probably aren’t that far away from being able to call up a players discipline graph so we can see which pitches each guy swings at in which counts against which pitchers and which type of pitch, but that information isn’t quite out there yet.
The lesson here is that while we usually try to boil things down to single numbers and easy to process information, the best strategy is almost always to look at lots of data. Batting average, for example, in a vacuum is a useless stat. Almost anything in a vacuum is useless.
I spent some time this afternoon working on crafting a formula that would best reflect plate discipline in one single number. I couldn’t do it. I kept trying to isolate the signal in the midst of noise, but couldn’t find a way to do it that was less complex that than status quo: Look at more than one piece of information.
We have a tendency to look for models or numbers that give us everything we need to know. We look for things that tell us how to interpret information instead of giving us the information that we interpret ourselves.
When we talk about Wins Above Replacement (WAR), we tend to do this. WAR sums it all together and tells us who the most valuable player is. This is good in broad strokes. I can easily see that Mike Trout outperformed Curtis Granderson with this protocol, but when we need to handle finer distinctions, we should be unpacking the data and looking at all of it.
Trout’s WAR exceeded Miguel Cabrera’s, but we’re better off if we take a look at each individual piece of information that goes into WAR because it gives you a richer picture of who is better. OBP, SLG, defense, speed, etc are all hidden inside WAR. WAR is shorthand. Which particular skills are does Trout beat Cabrera at and visa versa? We ask lots of question about who is the best player, but shouldn’t we ask who is the best at this particular thing? And the particular components of each of those things.
I tend to believe that more information is always better than less. When I want to think about who the most disciplined hitters are, I want to think about a lot of factors and weigh how much each matters in my head. I want to look at unfiltered information.
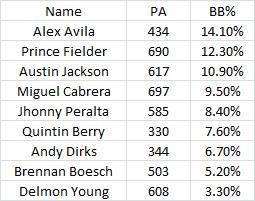
Let’s try this with the 2012 Tigers (min. 300 ABs):
By walk rate (BB%), this is how the Tigers look.
By O-Swing% (swing percentage on pitches outside the zone):

By Z-Swing% (swing percentage on pitches in the strike zone):
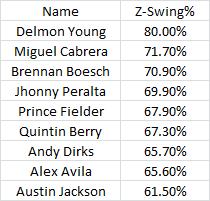
The information varies in each of these lists. There’s some correlation, but it’s not perfect. Taking pitches outside the zone makes it more likely that you walk, but lots of other things go into it. Cabrera swings at lots of pitches inside the zone, close to Delmon Young’s number, but walks a lot more than he does.
There’s so much that goes into each outcome that it’s easy to misinterpret the information. I’m pretty confident after looking at this information that Alex Avila is the more disciplined Tigers hitter, but there’s a case to be made for a couple guys for second place. And we haven’t even talked about what our eyes tell us.
When asking tough questions, instead of looking for the best number, let’s look for all the numbers. We’ll be better off.
Stat of the Week: Weighted On-Base Average (wOBA)

For this installment of Stat of the Week, we’re talking about weighted on base average (wOBA), which is OPS on steroids.
OPS is a simple stat used by a lot of people to measure offensive quality, but it is a messy and inefficient way to do that. OPS is On Base Percentage (OBP) PLUS Slugging Percentage (SLG), but OPS captures the flaws in each of those statistics and does nothing to fix them.
OBP is superior to batting average because it includes walks, but it still treats singles, doubles, triples, and homeruns equally. To OBP, all hits are created equal even though they are not. SLG has the opposite problem in that it weighs hits improperly. A triple is not worth 50% more than a double and a homerun is not worth 4x as much as a single. Those numbers, while simple to understand, do not accurately reflect each type of hit’s outcome on run scoring.
So how does wOBA help? Basically, using linear weights (i.e. math), wOBA properly aligns each hit to a proper value. The formula looks like this and is adjusted each year to reflect changes in the game:
wOBA = [(0.69 x BB) + (0.72 x HBP) + (0.88 x 1B) + (1.26 x 2B) + (1.60 x 3B) + (2.08 x HR)] / PA
Try not to memorize the numbers. Try to understand the ratios because the precise values vary year to year. Here’s a calculator with the 2013 constants for you to play along at home.
What you can see here is that a single is worth about 60% of a double as opposed to half. And a double is more than half a homerun. This might seem counterintuitive at first, but if you think about it, it makes sense. A double will drive in as many runs as a triple, so the only difference is how often the batter would score. Heck a double drives in as many as a homerun except for the batter.
wOBA looks a lot like the other slash line numbers, so here’s a scale to judge. .290 is bad, .320 is average, and .400 is great.
wOBA is a great metric because it tells us what we want OPS to tell us, but it does so in a more accurate way that reflects how things really work over the course of a season. If you’re looking for a number to judge a player’s offensive output, this might just be the one.
A couple downsides, which are evident in other stats, are that wOBA doesn’t include any corrections for era or park. We’ll have to wait for wRC+ to include that stuff.
So next time you want to see how a player is performing, try wOBA and you’ll have a lot more information than batting average and even OPS.
Stat of the Week: Wins Above Replacement (WAR)
Let’s get this out of the way early because it’s going to come up in a couple weeks when SABR Toothed Tigers New English D hands out a very controversial MVP award to someone not named Miguel Cabrera.
This week’s Stat of the Week is Wins Above Replacement (WAR). It’s been in the news a bit lately, so let’s all get on the same page about it.
First, there is something you should know. There are two different WAR. One belongs to Baseball Reference, one belongs to Fangraphs. They are different primarily because they use different measures of defense (more on this later). I will always cite Fangraphs on this site, but only for the reason that I like how they present their data.
The concept behind WAR is the same for both sites. How many wins does a given player add to his team above what a replacement level player would? A replacement level player is defined as a widely available AAA type player. Think Mike Hessman, Jeff Larish types if you followed Tigers minor leaguers in the last decade.
This is a pretty simple idea. What is the difference in wins between Prince Fielder at 1B versus Jeff Larish at 1B if everything else were equal? That is WAR in the abstract.
More concretely, a team that only played replacement level players would win about 50 games per season. As we’ve mentioned a lot here, even terrible teams win sometimes.
So what does WAR look like? For position players, you want to post at least a 2.0 WAR in a season to be considered a “starter.” Below that and you’re a backup or a minor leaguer. 2.0-4.0 WAR is considered solid, 4.0-6.0 is pushing All-Star to superstar levels, and 6.0+ is MVP type guys. You can roughly use the same scale for starting pitchers. Relievers are much different because they play so much less. Better than 1.0 WAR for a reliever is good, 2.0 is great, and 3.0 is excellent.
Let’s talk theory first. The common retort to this is that “Miguel Cabrera has to be worth more than seven wins to the Tigers! If you took him out, they’d suck!”
This isn’t really accurate. Think about it. The Tigers won 88 games, Cabrera posted a 7.1 WAR. Let’s round up to 8.0 WAR to be generous as that difference is attributed to what WAR considers poor defense (more on this later). If the Tigers did not have Cabrera and replaced him with a minor league player ala Ryan Strieby, the Tigers would go 80-82 according to WAR theory. That’s actually pretty realistic if you just look at it. That’s 9% of their wins concentrated in 4% of their roster.
80-82 isn’t very good, but it’s not horrible. After all, they Tigers have a good team around him. Let’s take away Verlander’s 6.8 WAR (rounding up to 7) and we’re at 73-89. Good for fourth worst in the AL. Essentially, if we take Verlander and Cabrera off the Tigers according to WAR, they would only be better than Cleveland, Minnesota, and Boston in 2012.
You have to buy that. They still have Fister, Scherzer, Sanchez, Fielder, Jackson, etc. They would be much worse, but still not a minor league team. Take away Fielder’s 4.9 WAR and we’re down to 68-94. Only the Twins were worse. That sounds about right when you really think about it.
So that’s the theory, but what about the practice. How do we calculate WAR? What WAR seeks to do is combine hitting, baserunning, and defense into a single number calibrated to the only thing we actually care about, wins. Each action earns a “run value” based on how often that action contributes to run scoring and the accumulation of 10 runs is about equal to 1 win.
WAR takes into account how much better than average a player is offensively using wOBA and coverts it into an overall run value, wRAA, based on the number of plate appearances a player has had. You take that wRAA and divide it by the Run to Win value of that year (usually about 9 to 10). That gives you offensive WAR. Baserunning has a similar type formula based on how many bases you take and how many you steal. Defense is based on UZR for FanGraphs and DRS for Baseball-Reference, which all come out in run values converted into wins in the same way. Overall WAR is also adjusted for the position you play.
For pitchers, FanGraphs uses Fielding Independent Pitching (FIP) and includes the number of innings pitched, park effect, and similar adjustments and Baseball Reference uses runs allowed and controls for the quality of your defense.
Simply put, WAR is trying to measure the total contribution a player makes with his play on the field. It obviously doesn’t measure things like leadership that reflect on other players (or moving to a new position!), but everything they do on the field is captured. Surely no one can challenge this concept.
WAR takes various statistics and combines them and scales them to churn out a number. The math is based on baseball history and what has been shown contributes to winning. For example, WAR values OBP over AVG because walks are important, but missing from average. It doesn’t care so much about RBIs because you can’t drive in runs if no one gets on base ahead of you. The math behind this, which I won’t subject you to any more unless you really want me to (here’s Fangraph’s page on WAR), is rooted in the game’s history and they adjust it every year to pick up new information, but it’s always scaled to that year’s replacement level so you can compare across eras.
WAR is not a perfect, exact measure of a player’s value, but it is a good one if you sum a team’s WAR and compare it to their actual win total + 50 (again this number has been slightly adjusted). It’s not a be all end all. If a player is 4.6 WAR and another is 4.5 WAR, they are essentially equal. There is margin of error. But WAR does give you a good sense of how much this player helps his team win with his own performance.
The argument against WAR is twofold. First, it’s complicated. It turns out a pretty good number, but it’s hard to grasp. You can’t watch a game and immediately see how Player X’s WAR is impacted like you can with HRs or average or walks. It’s not a stat, it’s a metric. It weighs the value of each action based on how those actions normally lead to wins for your team. So it’s hard to follow. You have to look at the numbers, you can’t figure them out and follow them as well. I’m not arguing we throw the others out in favor of WAR, but when you want to compare players who player different positions and on different teams, WAR equalizes that through a positional adjustment and other devices.
The other problem with WAR is defense. Defense is really hard to measure. Fielding percentage is not a good measure because that only tells me how often you make errors, it doesn’t tell me what kind of errors. It doesn’t tell me about your range.
WAR uses UZR (Ultimate Zone Rating) or DRS (Defensive Runs Saved) to measure defense. They are both metrics based on range and execution, with human viewers judging every play based on if it should be made routinely and how much harder or easier a play is from average difficulty. So there’s some subjectivity, but it’s much better than any of the traditional numbers. Plenty of people criticize these numbers because they fluctuate a lot and give some weird results on occasion.
Essentially, defense is WAR’s weak leg, but it’s getting better and is much better than anything traditional. But this means we can’t use WAR as a final word. We have to look at other things and use our eyes.
Don’t run from WAR because it is complex math. You can check it yourself by seeing what it turns out in a given year compare to a team’s actual results. The Tigers position player WAR and pitcher WAR sums to 43.9 this season. 50 + 43.9 = 93.9 which misses the Tigers win total by a whopping 6%. Not bad. It works even better with bigger samples.
Question WAR because it may be imperfect. It’s not trying to boil baseball down to a spreadsheet, it’s trying to correctly value on field actions. Having more RBI doesn’t make you a better player than someone else. Hitting more homeruns doesn’t either. If no one gets on base for you, you can’t drive them in. If you play in San Diego instead of Cincinnati, you’ll hit fewer bombs.
WAR is an equalizer. It allows us to compare individuals playing a team game. It’s a good thing. Don’t take it as doctrine, take it as information. The concept is great, the execution is pretty good and getting better. What WAR does is trying to measure value accurately, rather than based on old statistics that were invented before we had a good idea about what mattered in baseball. Check out our Stat Primer page to learn all about what stats are good and which aren’t so good.
And here’s a WAR calculator. Learn how to use it here.
Stat of the Week: Fielding Independent Pitching (FIP)
One of the things I want to try to do here at New English D is to introduce sabermetrics into the common vernacular of baseball fandom. I think the biggest reason for resistance to new stats and metrics is that they are not commonly understood. It’s not because people are too stupid, they just simply aren’t looking to spend a lot of time learning new things that don’t seem relevant.
Basically, most baseball fans don’t really understand why the basic statistics are misleading them about a player’s true value.
I’d like to start with one of the more prominent sabermetrics for pitchers, Fielding Independent Pitching (FIP) which is essentially a stand in for Earned Run Average (ERA).
The problem with ERA is that so much of it is outside of a pitcher’s control. For example, if you have a terrible defense, your ERA is going to be higher than if you have an awesome defense, even if you make identical pitches for an entire season.
What FIP tries to do is factor defense out of the equation by presenting a formula that predicts what your ERA would be if you had league average defense and league average luck by looking at your strikeouts, walks, and homeruns allowed (things you can actually control as a pitcher). Generally speaking, the most contact hitters make against you, the more variation we could see.
The formula goes something like this and is based on long run averages in MLB history:
FIP = (13 x HR) + (3 x (BB+HBP)) + ((2 x K) / IP) + constant
What this formula does is give you a number that looks like ERA, but only responds to things inside a pitcher’s control and FIP is a better predictor of future performance than ERA. Generally speaking, it’s a great place to start your analysis. You want to dig deeper into batted ball data and other trends, but FIP starts you off with a number that is based solely on a what a pitcher can control.
For reference, an average FIP is 4.00 with an excellent one being 2.90 and a terrible one being 5.00. For a full explanation from the people who created it, see this.
To give you an idea, let’s take a look at the some ERA to FIP comparisons from the 2012 season. For a complete listing of FIP, head here.
MLB’s top five in FIP this year were Gio Gonzalez (2.82), Felix Hernandez (2.84), Clayton Kershaw (2.89), Justin Verlander (2.94), and David Price (3.05). That seems to jive with what you might think. Remember Gio and Kershaw get to face the pitcher, so their number is going to look a little better just like ERA.
So of the qualifying starts in 2012, whose ERA made them look better or worse than they are?
I’m picking a few examples to demonstrate FIP’s usefulness. Tigers’ sinkerball Rick Porcello seems an obvious candidate for an ERA inflated by bad defense, right? Very true. Porcello’s ERA is a robust 0.68 runs higher than his FIP. The Royals Luke Hochevar didn’t get much help either with an ERA a whopping 1.10 runs higher than his FIP.
How about guys whose ERA made them look better than they are? Jeremy Hellickson got a full 1.50 runs back from his defense per nine innings and extreme fly ball pitcher Jered Weaver, with the help of the crazy good Angels outfield, got 0.94 runs better in ERA than FIP.
Now four random examples might not convince, but I encourage you to take a look at the FIP leaders and start using that metric to learn a little bit more about how someone is pitching.
Two final thoughts. One don’t bother with RA Dickey because there are so few knuckleballer’s in history and the averages don’t control for how differently knuckleballs get hit.
Two, whose defense and luck has been the most average so as to keep their FIP in line with their ERA this year? That award goes to the Pirates’ James MacDonald who posted an ERA and FIP of 4.21, making him the only player to have both numbers equal.
Come back next week for another Stat of the Week and feel free to suggest some that you would like to learn about.
