The 2013 Tigers Are (Almost) The Best Rotation Ever

In mid-June I wrote that the Tigers’ starting rotation was on pace to be the best starting staff in MLB history by Fielding Independent Pitching (what’s FIP?) which is a statistic that measures the three true outcomes a pitcher has complete control over and scales it to look like ERA. Based on strikeouts, walks, and homeruns – the Tigers are on pace for an historic season.
If you don’t know much about FIP, click on the link above to see why it’s a better reflection of a pitcher’s true talent than ERA which depends a lot on the defense behind the pitcher. Another statistic, Expected Fielding Independent Pitching (xFIP), considers a pitcher’s GB/FB rate and averages out their HR/FB%, but unfortunately we don’t have batted ball data before 2002. We have FIP data all the way back to the beginning of MLB history. If we start in 1901 and run through Saturday, the Tigers have the third best FIP of all time. What I’m about to show you is FIP-, which is simply FIP adjusted for park effects and league average which allows us to compare teams in different run scoring environments. 100 is league average and a point above or below is a point better or worse than average. A FIP- of 95 is 5% better than average. Here are the top five FIP- in MLB history:
| Rank | Season | Team | FIP- |
| 5 | 1996 | Braves | 78 |
| 4 | 1997 | Braves | 78 |
| 3 | 2013 | Tigers | 78 |
| 2 | 2011 | Phillies | 77 |
| 1 | 1971 | White Sox | 77 |
Two months ago, the Tigers had a starting rotation FIP- of 64, and they’ve since come back to the pack because that would have been a crazy good number. Despite struggles from Verlander and a few bad starts from Fister, the Tigers still have the 3rd best rotation in MLB history.
They are getting contributions from everyone in the rotation, too. Here are a series of tweets I send out Saturday night about the Tigers rotation:
The rotation is deep. Here are some basic numbers:
| Name | IP | WAR | ERA- | FIP– |
| Anibal Sanchez | 111 | 3.7 | 63 | 61 |
| Max Scherzer | 151.1 | 4.5 | 70 | 67 |
| Doug Fister | 143 | 3.1 | 86 | 80 |
| Justin Verlander | 143.2 | 3.1 | 95 | 84 |
| Rick Porcello | 110.1 | 2.0 | 111 | 86 |
| Jose Alvarez | 19.2 | -0.2 | 123 | 147 |
Only Alvarez (and his 20 IP) has a FIP that isn’t at least 14% better than average and all of the main five starters have at least 2.0 wins above replacement or more (what’s WAR?). In fact, despite having an ERA a bit worse than their FIP due to some less than perfect defense behind them, the Tigers rank very well in both all time.

More teams have allowed fewer runs relative to average, but only two teams have ever done so thanks to better pitching. The Tigers aren’t a lock to set this record, but they are pitching very well right now and are currently hanging right around the strikeout rate record as well.
The Tigers are a good team top to bottom with a great offense, but their starting pitching is the flashy component. They have baseball’s best offense and best pitching staff – and the pitching staff might be one of the best all time. I’ve written a lot about the different Tigers starters and what makes them great this season. You can find every one of those pieces in our Tigers Breakdowns section along with a piece about how the Tigers are utilizing the changeup as a weapon more and more.
With 53 games to play, the Tigers are not in position to break the all-time record for FIP, but they are just 1% away from the top mark in history. With just a little better performance than they are on pace for, the Tigers could be the first team to ever have their starting staff pitch 26% better than league average for an entire season. It’s a remarkable record and one that isn’t nearly well-known enough.
National and local writers have made plenty out of the very good Tigers rotation, but with the exception of a piece by Dave Cameron at FanGraphs, I haven’t seen anyone else call attention to just how great this rotation truly is. The Tigers aren’t just pitching pretty well this season, they’re pitching better than all but two rotations in baseball history spanning more than 100 seasons.
With about two months left, this is going to be fun to watch.
How Was The Game? (August 3, 2013)
Another pleasure.
Tigers 3, White Sox 0
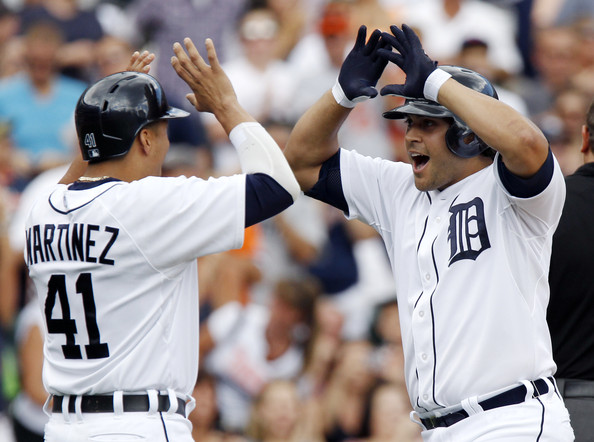
I’m starting to sound like a broken record stuck on a good song, but the Tigers played another brilliant game. Max Scherzer (22 GS, 151.1 IP, 2.85 ERA, 2.72 FIP, 4.5 WAR) led the way with 7.2 superb innings of 0 run baseball in which he allowed 3 hits and 3 walks but also struck out 6. The Sox couldn’t get anything going against him and he cruised through this one easily and left to a standing ovation. The Tigers’ bats didn’t do a ton, but they made it count when they did getting solo homeruns from Hunter, Peralta, and Iglesias to give Max all he would need. The Tigers have now won 7 straight, 11 of 12, and will look to notched their 3rd consecutive sweep on Sunday behind the very solid Rick Porcello (19 GS, 112.1 IP, 4.49 ERA, 3.52 FIP, 2.0 WAR).
The Moment: Iglesias launches his first HR as a Tiger…and the crowd gets on its feet for Scherzer.
How Was The Game? (August 2, 2013)
A joy.
Tigers 2, White Sox 1
Any time Doug Fister (22 GS, 143 IP, 3.52 ERA, 3.27 FIP, 3.2 WAR) is on cruise control, it is must see television. He had quick inning after quick inning, getting through 5 innings in 45 pitches, 7 in 75, and 8 in 88. He was brilliant, delivering 8 innings of 7 H, 0 BB, 2 K baseball and allowed just a single run in the 6th inning. He was backed by a Jose Iglesias RBI single and a Jackson solo homerun, but he did the rest without a problem getting ground ball after ground ball and mowing through the White Sox order. It was one of the easiest 8 innings we’ve seen this season from any Tigers starter and there isn’t much else to say other than that while Fister is good, the White Sox are an abysmal offense. The game took just 2 hours and 7 minutes despite Leyland going to the glacial Benoit instead of allowing Fister to finish what he started. I mean seriously it was awesome other than Leyland’s desire to ruin every CG ever. Their 6th straight win and 9th in their last 10 pushes the Tigers to 62-45 and they will go for the series victory Saturday night with Max Scherzer (21 GS, 143.2 IP, 3.01 ERA, 2.72 FIP, 4.3 WAR) taking the baseball.
The Moment: Anything and everything Doug Fister did.
Matt Tuiasosopo: Difference Maker
The story is pretty widely known. Matt Tuiasosopo didn’t have a job this winter and e-mailed GM’s who he thought might have interest. Dave Dombrowski took the chance.The Tigers needed a right-handed hitting outfielder to use with Andy Dirks in LF and to come off the bench when the team needed a power bat. It’s paying off.
Tuiasosopo had never had any success in the major leagues. In parts of 3 seasons, the last of which was 2010, he had accumulated 210 PA. In those plate appearances he posted an unimpressive .176/.234/.306 stat line which produced a 48 wRC+ (what’s wRC+?). In total, his career wins above replacement (what’s WAR?) was -1.1. That’s a small sample and you can’t make too much of it, but Tuiasosopo paced out to about -3.0 WAR over a full season based on his career numbers.
Let’s just say 2013 has been different. While Tuiasosopo had some occasional offensive success in the minors it looked liked the 27 year old was never going to have a steady big league job. After four months of 2013, he’s at least earned himself a spot on someone’s big league bench next season.
If you assume there are 255 starting spots in the show (9 spots per AL club, 8 per NL club) then the 255 position players with the most plate appearances are the starters and the rest are bench guys. Obviously injuries throw a wrench into the clean cut off, but I’m just using it as a jumping off point, so we can be a little loose about it.
Among the remaining 527 players to grab a PA this season, Tuiasosopo ranks 15th in WAR at 1.2. He’s been one of the best 15 backup players in the major leagues this season despite no success in his career and zero MLB at bats in the two previous seasons. If you actually look at the list of players in the sample, the two guys at the top are Hanley Ramirez and Yasiel Puig, so we probably shouldn’t count them because they’re basically superstars. Jose Reyes is ahead of Tuiasosopo. So is Wil Myers.
I told you the cutoff line wasn’t perfect, but the point is pretty clear. Tuiasosopo is one of baseball’s most valuable bench players in baseball this season.
He has just 129 PA this year, so let’s see what happens when we look at players with 150 PA or fewer in 2013. Among players with 150 PA or fewer in 2013, Matt Tuiasosopo ranks 3rd in WAR. He’s the 3rd best player in the game (with some margin of error) who averages fewer than 1.5 PA per team game.
I point this out because we spend a lot of time focusing on star players who carry teams, but I’m a big believer in the value of the backups. Individual bench players can’t change their team’s fortune overall, but the overall bench is very important. The ability to fill in for injured players and to give stars a day off is very important. If each of your bench players can give you 1.0 WAR, you’re looking at 4-5 wins above what you could get from a bad bench. If you can get 2+ wins (a starter’s floor) out of a couple bench guys, you’re looking at something pretty special.
There are a finite number of at bats during a season and it’s critical that you get the most out of each. The difference between Tuiasosopo and a AAA player has already been 1.2 wins and could easily find its way to 2 by the time the season is over. What’s great about that is that he looked exactly like one of those replacement level players entering the season.
Dombrowski and his staff saw something in Tui that made him give the guy a shot and the coaches saw enough to bring him north after Spring Training. In those 129 PA, Tuiasosopo has hit .299/.419/.561 with a .424 wOBA (what’s wOBA?) and 171 wRC+. He’s walking 15% of the time he comes to the plate.
I know you can’t just extrapolate it out, but he’s playing at a 6.0 WAR pace. That’s one heck of a weak half of a platoon.
Now Tuiasosopo won’t continue to hit like this because he’s basically hitting like Mike Trout, but he’s already added more value than you could have expected at the start of the year. He’s already done it, even if he never takes another swing. If you set the minimum at 100 PA for 2013, only 6 players have a better overall offensive rate using wRC+. It’s an impressive list.
| Rank | Name | Team | PA | wRC+ |
| 1 | Hanley Ramirez | Dodgers | 196 | 205 |
| 2 | Miguel Cabrera | Tigers | 452 | 202 |
| 3 | Jeff Baker | Rangers | 106 | 183 |
| 4 | Chris Davis | Orioles | 444 | 180 |
| 5 | Yasiel Puig | Dodgers | 212 | 180 |
| 6 | Mike Trout | Angels | 485 | 171 |
| 7 | Matt Tuiasosopo | Tigers | 129 | 171 |
Among players who have come to the plate 100 or more times, only Ramirez, Cabrera, Baker (!), Davis, Puig, and Trout have been better. Surely he’d regress if given a full season of reps, but it’s amazing nonetheless. He’s given the Tigers so much value for almost no cost.
The big moves make headlines. Signing Sanchez and Hunter, extending Verlander, trading for others along the way. But Matt Tuiasosopo has been a very important piece for the 2013 Tigers even if it’s in a limited role. I don’t think we give enough credit to role players in MLB, so that’s really all this is.
Earlier this year I penned this love letter to Don Kelly (my favorite player), but other than that, you don’t see big features written about guys who spend more time on the pines than on the grass. But we do that here at New English D. We love these guys. They play an important role and can sometimes be the difference.
Matt Tuiasosopo is having a heck of a season at the plate and if you’re willing to accept the small sample as indicative of what has already happened even if it isn’t predicitve, he’s one of the best players in the game who fill his role. He’s one of the best hitters with at least 100 PA and one of the most valuable guys to have fewer than 150. He’s not Miguel Cabrera, but the 10th, 11th, 12th, and 13th spots on the position player side of your lineup card matter and deserve more attention.
Nice job, Dave and Jim. But really, nice job, Matt.
How Was The Month? Detroit Tigers July Report
Excellent.
18-8 (61-45 overall)
It was during July that the Detroit Tigers became the DETROIT TIGERS, AL POWERHOUSE. After playing well, but not having a record that matched the performance perfectly, the Tigers unloaded in the month of July. They won 9 of their final 10 and put themselves back on a 93 win pace thanks to outscoring their opponents by 61 runs.
The Tigers led the AL in offense with a 122 wRC+ (what’s wRC+?) in July and were second in the AL in position player wins above replacement (what’s WAR?) The story of the month offensively was Victor Martinez’s resurgence as he posted a 180 wRC+ after a very slow start, but among Tigers who came to the plate a significant number of times quite a fewer put up above average numbers. Hunter (187 wRC+), Miguel Cabrera (173 wRC+), Don Kelly (138 wRC+), Matt Tuiasosopo (137 wRC+), Alex Avila (126 wRC+), and Jhonny Peralta (115 wRC+) all put up great numbers during the month. Avila’s numbers really jump off the page.
In 77 PA in July, Avila hit .269/.355/.463 and was worth 0.5 WAR. Those numbers look very reasonable for what he could do going forward. Avila might hit for a bit less average, but the walks are always there and he can hit for some decent power. If you guide it out, Avila is a 2.5 to 3.0 WAR player in my mind going forward because he’s going to have to spend some time on the DL each year. The numbers are in a small sample, but the process looks much better too.
Overall, the pitching staff was around average in July, offering a 3.0 WAR in the month and a 3.44 ERA and 3.91 FIP (what’s FIP?) after an historic start to the year. They are still within 1% of having baseball’s best rotation in history, but after July it’s going to be a bit harder to achieve that goal as the starters only posted the 8th best numbers in MLB over the last 31 days.
Scherzer and Porcello were both brilliant in July, and while Anibal Sanchez didn’t pitch great, he did manage to limit the runs he allowed with some timely outs. Verlander struggled in the month across the board and Fister was certainly below where you’d expect to see him, but Fister has figured it out since the break after struggling before it and Verlander has shown signs of promise.
Smyly and Benoit remain one of baseball’s best two headed monsters out in the pen, and with reinforcements coming, things look pretty good there too.
All in all, it was a great month for the team and it was fun to watch. The bats carried the pitching staff, but the pitching staff was still pretty good – they just weren’t as good as the pace they set in the first half. The Tigers have 56 games left in 2013 and will likely play most of them without Jhonny Peralta, but as long as Cabrera’s injury doesn’t prove to be too serious, it doesn’t look like much can stop them. The Tigers look like they’ll ride to the postseason and are ready to make another deep run. They only need to play at an 83 win pace the rest of the way in order to reach 90 wins, which should be more than enough to outlast the Indians and Royals.
The Moment: Brayan Pena tags out Nick Swisher on a ball Swisher expected to go foul. Pena chuckles with delight.
How Was The Game? (July 31, 2013)
A slaughter.
Tigers 11, Nationals 1
A day after the Tigers got to Stephen Strasburg, they backed Justin Verlander (23 GS, 143.2 IP, 3.88 ERA, 3.42 FIP, 3.1 WAR) with 11 runs against Gio Gonzalez thanks to two innings in which they batted around and scored 5 runs. Hunter led the way with four hits including a homerun and Avila added his second homerun in as many days and his first against a LHP all season long. It was an all out assault on offense and Verlander was certainly good enough. He struggled in the first inning and walked 5 overall, but got through 6 innings of 1 run baseball while gathering 6 strikeouts. He wasn’t his old self, but he did break off some nice curveballs, which he had been missing thanks to issues with his release point. The win is the Tigers 5th straight and 9th in their last 10 tries pushing them to 16 games over .500 at 61-45 as they get set for a weekend set against the White Sox. Doug Fister (21 GS, 135 IP, 3.67 ERA, 3.31 FIP, 2.9 WAR) will take the ball in game one on Friday, likely with new Tiger Jose Iglesias behind him with a suspension likely coming to Jhonny Peralta this week. Should Peralta’s regular season effectively be over, it certainly was one of his best as he finished with a .307/.363/.460 line good for 126 wRC+, and 3.3 WAR.
The Moment: Santiago and Avila both drive in a pair in the second to put this one away early.
How Was The Game? (July 30, 2013)
A crushing blow.
Tigers 5, Nationals 1
In the day’s marquee matchup, Anibal Sanchez (18 GS, 111 IP, 2.59 ERA, 2.46 FIP, 3.8 WAR) finished with 7 innings of 1 run baseball and got the better of Stephen Strasburg after dueling early. Both teams scored single runs early in the game and were shut down by the two starters until the bottom of the 6th. At that point, the Tigers broke through. Cabrera made the first out before Fielder singled, Martinez doubled, and Peralta walked. With the bases loaded Andy Dirks struck out swinging and left it up to Alex Avila. Avila worked himself into a 2-1 count, before turning on a 96 mph fastball from one of the game’s best and deposited it in the right field seats to give the Tigers a 5-1 lead. That would be all they would need as Leyland called on Veras for the 8th and Benoit for the 9th who shut the door easily. The win is the Tigers’ 60th of the season and their 8th in their last 9. A quick turnout will put the Tigers on the field during Wednesday’s trading deadline with Justin Verlander (22 GS, 137.2 IP, 3.99 ERA, 3.41 FIP, 3.0 WAR) on the mound trying to rediscover his release point.
The Moment: Avila’s grand slam puts the Tigers ahead for good.
Hidden Value: Assessing the Tigers on The Bases
Baserunning is pretty much the red-headed stepchild of baseball analysis. We care a lot about hitting. We care a lot about pitching. Most people given a courtesy nod to defense, even if they basically ignore it. But no one talks about baserunning aside from stolen base totals, or maybe stolen base efficiency.
But there is so much more going on on the bases that we could be talking about. Going first to third, scoring on singles, not making outs you don’t have to make. All of these are critical aspects of baserunning that we don’t talk about, but very easily could. In the text of this post I’ll be introducing some statistics (which are very simple) and discussing them in the context of the 2013 Tigers to date (July 30th).
Let’s start by digging deeper on stolen bases. Stolen bases add value to the team, about 1/4 of the value added by a single. But getting caught is costly, and is about twice as costly as stealing a base is beneficial because the value of moving up a base is not as important as not making an extra out. In other words, you need to steal at about a 70% rate or better in order to be adding value to your team overall.
| Name | wSB |
| Andy Dirks | 0.7 |
| Don Kelly | 0.3 |
| Hernan Perez | 0.2 |
| Miguel Cabrera | 0.1 |
| Matt Tuiasosopo | -0.1 |
| Ramon Santiago | -0.1 |
| Omar Infante | -0.2 |
| Alex Avila | -0.2 |
| Austin Jackson | -0.3 |
| Torii Hunter | -0.4 |
| Avisail Garcia | -0.4 |
| Prince Fielder | -0.6 |
| Victor Martinez | -0.8 |
| Jhonny Peralta | -0.9 |
| Brayan Pena | -0.9 |
Presented above are the number of runs each Tiger has added via SB and CS. As you can see, nobody is doing much of anything. The Tigers best basestealer isn’t even up to a full run (10 runs = 1 win) of value and the worst basestealer costs about the same. The Tigers don’t steal a lot of bases, but they don’t get caught a ton either. All told they are a -3.7 wSB, which means their basestealing exploits has cost the team about one-third of a win. Not very significant.
Now let’s take a look at UBR, which is simply the same formula for all other baserunning activities. This includes the value of going first to third and the cost of getting thrown out trying to stretch something. I’m going to talk about some pieces of this in a moment, but first let me give you the overall numbers.
| Name | UBR |
| Austin Jackson | 5.0 |
| Don Kelly | 2.1 |
| Omar Infante | 1.6 |
| Avisail Garcia | 0.7 |
| Miguel Cabrera | 0.6 |
| Alex Avila | 0.6 |
| Ramon Santiago | 0.3 |
| Hernan Perez | 0.1 |
| Andy Dirks | -0.2 |
| Bryan Holaday | -0.6 |
| Jhonny Peralta | -0.7 |
| Brayan Pena | -0.7 |
| Torii Hunter | -1.2 |
| Prince Fielder | -2.1 |
| Matt Tuiasosopo | -2.8 |
| Victor Martinez | -4.6 |
Here we have a chance to see more overall value impact. It will not surprise you to learn that Austin Jackson is the Tigers best runner and that he has been worth half a win to the team simply on the bases (this does not include stealing). Kelly ranks well in this department and despite being slow, Cabrera’s solid instincts help him add value here as well. Dirks is a bit surprising because he’s the team’s best basestealer, but it looks like he doesn’t help much with the ball in play. Overall, the team has a -1.9 UBR, which is just a tick below average. Adding wSB and UBR together, the Tigers have cost themselves something like half a win this season with their baserunning (25th in MLB). You’re not happy about that, but given their collection of lumbering sluggers, it’s nice to see they aren’t giving runs back on the bases they are earning with the bat.
So now that we have an idea about the Tigers overall baserunning value, what are some other things we can track. Let’s start with outs made on the bases. The table below is sorted by total outs, but includes where each out was made. These are outs made when the runner was not forced, so it would include something like getting thrown out at the plate trying to score from second, but not getting forced out in the middle of a double play:
| Player | OOB1 | OOB2 | OOB3 | OOBHm | OOB |
| Torii Hunter | 1 | 1 | 1 | 1 | 4 |
| Victor Martinez | 0 | 1 | 0 | 3 | 4 |
| Matt Tuiasosopo | 0 | 0 | 1 | 3 | 4 |
| Andy Dirks | 1 | 0 | 0 | 2 | 3 |
| Prince Fielder | 0 | 0 | 0 | 3 | 3 |
| Omar Infante | 1 | 0 | 1 | 1 | 3 |
| Austin Jackson | 0 | 2 | 1 | 0 | 3 |
| Jhonny Peralta | 1 | 2 | 0 | 0 | 3 |
| Miguel Cabrera | 0 | 2 | 0 | 0 | 2 |
| Don Kelly | 0 | 0 | 1 | 1 | 2 |
| Alex Avila | 1 | 0 | 0 | 0 | 1 |
| Avisail Garcia | 0 | 0 | 0 | 0 | 0 |
| Bryan Holaday | 0 | 0 | 0 | 0 | 0 |
| Brayan Pena | 0 | 0 | 0 | 0 | 0 |
| Hernan Perez | 0 | 0 | 0 | 0 | 0 |
| Ramon Santiago | 0 | 0 | 0 | 0 | 0 |
You’ll notice the Tigers have made 32 outs on the bases while the average team has made 33. Essentially, the Tigers know their limitations like with stolen bases. This is not a club blessed with speed, but they know not to push it and don’t run into an inordinate amount of outs. It’s important to recognize that the base coaches are partially responsible for this, so don’t look at Fielder’s 3 outs at home and put it all on him. This isn’t a perfectly individual situation and it’s important to consider the context of every action and game situations. It would just be way too difficult for me to show you the percentage of time Fielder scored on singles from second versus the times he stopped at 3B versus the times he got thrown out in a simple table.
Now let’s look at the Tigers’ Extra Bases Taken Percentage. This is how often a player takes an extra base when the opportunity presents itself. Note that this is how often they go from first to third when the opportunity comes up not how often the make it when they try for it.
| Player | XBT% |
| Omar Infante | 55% |
| Torii Hunter | 49% |
| Austin Jackson | 48% |
| Miguel Cabrera | 41% |
| Avisail Garcia | 40% |
| Jhonny Peralta | 37% |
| Ramon Santiago | 36% |
| Don Kelly | 33% |
| Hernan Perez | 33% |
| Andy Dirks | 29% |
| Prince Fielder | 29% |
| Victor Martinez | 23% |
| Alex Avila | 17% |
| Brayan Pena | 13% |
| Matt Tuiasosopo | 8% |
| Bryan Holaday | 0% |
League average is 40% and the Tigers as a unit take 35%. Some Tigers do this very well and some do it quite poorly. It’s important to think about the last two stats together. The Tigers make an average number of outs and take a slightly below average number of extra bases. This is a team that knows what it can and can’t do and doesn’t run into a lot of outs relative to the rest of the league. Remember our lesson from the stolen bases section. Not making outs is more important than moving up a base.
You can break these stats down further to each base situation. I’ll just give you one to demonstrate. Let’s try for how many times each Tiger has scored from second base on a single:
| Player | 2ndSH |
| Torii Hunter | 14 |
| Austin Jackson | 11 |
| Victor Martinez | 11 |
| Miguel Cabrera | 9 |
| Omar Infante | 8 |
| Jhonny Peralta | 7 |
| Andy Dirks | 6 |
| Don Kelly | 4 |
| Ramon Santiago | 3 |
| Alex Avila | 3 |
| Avisail Garcia | 2 |
| Prince Fielder | 2 |
| Brayan Pena | 2 |
| Hernan Perez | 0 |
| Matt Tuiasosopo | 0 |
| Bryan Holaday | 0 |
It’s important to think about all of these numbers in the context of opportunity and situations, but they are valuable to know. Baserunning doesn’t swing entire seasons dramatically (usually 1-2 wins over an entire season), but it does matter and could easily be talked about more often. In just a few short minutes I’ve given you some other ways to think about baserunning. Stolen bases are important, but they can be measured a bit more accurately too. Additionally, there are stats readily available at sites like Baseball Reference that can tell you more about baserunning value such as XBT% and Outs on the Bases.
As always, there is a lot of information out there and I think you’ll enjoy your baseball watching experience a lot more if you know just a little bit more. Baserunning is about more than raw speed and there are ways to measure which players add value on the bases beyond the stolen base. The 2013 Tigers aren’t the poster children, but they seem to know their game is more about swinging that motoring.
Torii Hunter Plays The Field

A couple of weeks ago I took a look at Torii Hunter’s late career offensive resurgence and explained that a change in his approach has paid off for the Tigers’ RF. Hunter has had a very nice career overall and was once consider one of the game’s elite defensive players. If you’re curious about Hunter’s current and former swing, check out the link above, but thanks to a reader question over the weekend, this post is going to discuss Hunter’s defense.
The genesis of the discussion was the reader wondering how Hunter’s defensive numbers look this season compared to last season because the reader noticed he’s seemed to make some bad plays out in RF. My eyes tell me the same thing. Hunter has made a number of poor plays this season at bad times.
Let’s take a look at Torii Hunter’s defense this season and throughout his career. Let’s start up front and say that I’m going to present the numbers, drawing heavily from Defensive Runs Saved (DRS) and Ultimate Zone Rating (UZR), and leaving the reputation to the side. Hunter won a lot of gold gloves and was all over the Web Gems in the late 90s and early 00s. You may remember him making amazing plays in center, but this presentation is about data. I don’t feel comfortable giving you a real scouting report from his early days because that was before the days of MLB Network and MLB.TV when I couldn’t watch all the baseball I wanted to. I’ve seen him for 100 games this year so I’ll give you the scouting report from this season and the raw data from other seasons.
Let’s take a look at the overall numbers. Remember a few things. Up through 2009 he played almost exclusively CF and after he started blending into RF and has played just one game in center since the start of 2011. What is important here is that defensive metrics judge players compared to average at their position meaning that a +10 in CF is a better defensive player than a +10 in RF. Additionally, defense peaks early. Hunter should get worse as he ages, everyone does.
Total Zone is an approximation based on play by play data that covers players up through 2001. In 2002 UZR becomes available and DRS comes in 2003. So these numbers will get more accurate as we move forward and Hunter’s best seasons happen to overlap with the infancy of advanced defense. Don’t take these numbers as gospel. They aren’t perfect, especially early. I’m just presenting the information. A final aside is that defensive metrics are generally a good description of what happened in a given season, but they take very big samples (close to 3 years) to provide a lot of predictive value about a player’s true skill level. Every 10 runs by these defensive scores equals about 1 win.
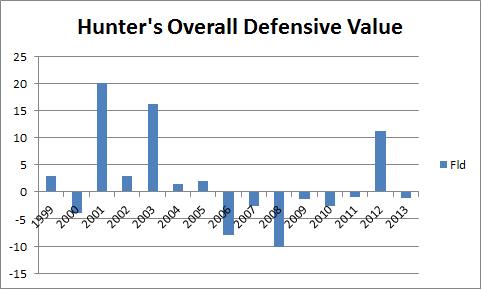
This Fld number is Total Zone until 2002 and then UZR. This is what FanGraphs uses for the defensive component of Wins Above Replacement (WAR). What you see on the surface here is that Hunter is essentially an average defensive player over his career with a couple of fantastic seasons and a couple of poor ones. The overall picture says Hunter isn’t a great defensive player overall and is pretty much in line with his career numbers this season.
Now let’s take a look at UZR and DRS in his career in CF only.

What is pretty interesting about these numbers is that DRS has almost always liked Hunter better than UZR. DRS is scored by hand and UZR is done with an algorithm. This consistency likely indicates that Hunter is doing something very pleasing to the human eyes. Let’s look at RF:

I think this is pretty interesting. He didn’t play a ton of RF in 2010, so I’m not too worried about it. In 2011 and 2012 DRS likes Hunter better in RF than UZR does, but in 2013 it flips. And that actually corresponds perfectly to what I’m seeing with my own eyes. Hunter’s range actually looks pretty good to me this season. What Hunter is doing poorly this year, in my opinion, is coughing up easy plays. I can think of at least five instances off the top of my head where Hunter got himself to medium difficulty fly ball and he just botched the catch after doing the hard work. He’s also made some atrocious throws in terms of accuracy and has misjudged the wall a few times. Hunter is making bad mistakes this year, and the data seems to suggest that this might be new.
You can see that he’s been pretty consistent in making errors in his career but is already at his quota for the season:

So the defensive metrics disagree about Hunter. Defensive Runs Saved thinks he’s pretty good (averaging about +5 DRS per season since 2003). Ultimate Zone Rating thinks he’s right about average overall with some heavy year to year variation. If you trust UZR, he’s having an average season at the end of an average career. Defensive Runs Saved says he’s having a bad season at the end of a pretty good career. In total, over the last 11 seasons the difference between Hunter’s UZR and DRS works out to about 4.5 WAR. That’s an interesting difference and it’s one that makes sense.
Let’s take a look at another statistic that I like. What is his defensive efficiency? What percentage of the balls hit to his defensive zone does he catch and how many out of zone plays does he make?

In his CF days he made more plays that average early in his career and started falling behind a little bit as time went on. That makes sense. In his early days he had great range and as he aged the young kids coming up started passing him. Here are the numbers in RF.
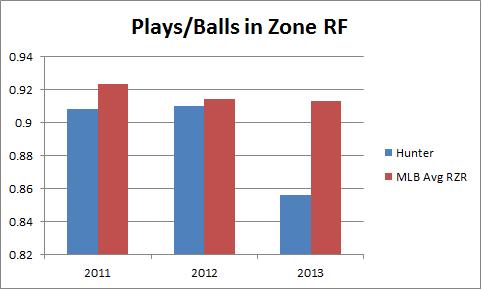
This continues the theme we’ve been seeing. Hunter was right around average in his first two seasons and has basically collapsed this season. Hunter is making fewer plays on balls in his zone this season, likely because of the misplays I’ve been talking about. It’s not limited range, it’s Hunter making mistakes. That’s how I blend this information and my own observation. Hunter seems just as athletic, but he’s not executing.

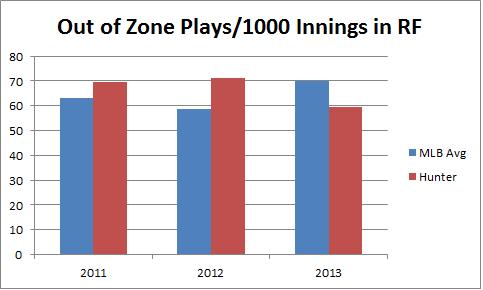
What these two charts show us is that Hunter has been in the ballpark of league average in making plays outside of his defensive zone. Recognize that these numbers were brand new in 2003 and are constantly being refined, he’s sometimes been better and sometimes worse than average.
So what does this all mean? For me, it says that Hunter has obviously declined as he’s aged but that he hasn’t lost a ton of his range relative to what you would expect given typical aging curves. Generally speaking, human scorers like Hunter’s defense more than the machines, until this season when the humans have turned on him. That turn, which lines up with what the plays/balls in zone data tells us and my own visual inspection, tells us that Hunter is getting hit this season for making mistakes fielding the ball, not getting to it.
On several occasions Hunter has gotten to medium difficulty ball and dropped it or misjudged the wall or given up on a ball in front of him a little too early. These kind of plays aren’t called for errors, but they are absolutely mistakes made by Hunter that should count against him.
So the story here is that Hunter was probably not quite as good a defender as you thought he was coming up, but that he was pretty good and remains pretty good given his age. This year he’s struggled, not with declining range, but just some stupid mistakes. You can judge that how you will, but it appears to be a sign that his defense could improve rather than continue to decline for the rest of the season. Hunter’s bat has been a nice addition for the Tigers this year and his defense, despite its current issues, is still dramatically better than what Brennan Boesch offered the last few seasons.
How Was The Game? (July 28, 2013)
Another blowout.
Tigers 12. Phillies 4
Despite losing Miguel Cabrera and Jim Leyland to Chad Fairchild’s questionable sense of superiority, the Tigers had no trouble completing an impressive sweep of the Philadelphia Phillies. Rick Porcello (19 GS, 112.1 IP, 4.49 ERA, 3.51 FIP, 2.0 WAR) was solid, but hardly necessary, giving the Tigers 6 innings of 3 run baseball in which he struck out 3 and walked 2 (1 intentional). The Phillies scattered their runs, but the Tigers unloaded in big assaults. The Tigers got 3 in the 5th to tie it and 8 in the 6th on one of the worst defensive innings you’ll ever see from the Phillies. Peralta capped it off with a grand slam and the Tigers tacked on an extra run in the 7th for good measure. The win gives the Tigers three straight and 7 of 8 to move to 59-45 on the season. They will take Monday off in preparation for a two game set with the Nationals in which Anibal Sanchez (17 GS, 104 IP, 2.68 ERA, 2.39 FIP, 3.5 WAR) will start game one.
The Moment: Peralta caps an 8 run inning with a no doubt grand slam homerun.
