How Was The Game? (August 30, 2013)

Two steps forward.
Tigers 7, Indians 2 (7 innings)
With the final three games of the season against the Indians taking place this weekend, the Tigers turned to Rick Porcello (25 GS, 148 IP, 4.44 ERA, 3.51 FIP, 2.6 WAR) to get off on the right foot and the 24 year old hurler did just that, tossing 5.2 innings of 2 run baseball as his team staked him to an early lead. The Tigers grabbed one in the second and four in the third in part due to a hilarious Michael Bourn misplay in centerfield. Porcello got ground ball after ground ball and the bullpen backed him up to send the Tigers to 7.5 games up in the division with just 27 games to play. One more win this weekend should finalize the team’s October plans and Anibal Sanchez (27 GS, 144.2 IP, 2.61 ERA, 2.43 FIP, 4.8 WAR) will try to set the team up to do just that on Saturday.
The Moment: Iglesias starts a ridiculous double play. (Video)
Checking In On The Tigers Late Inning Scoring
During the middle part of the season, much was made over the Tigers inability to score runs late in games. I don’t have the exact numbers, but they scored many fewer runs in the 7-9th innings than they did during the earlier ones. A lot of people were concerned that the Tigers weren’t clutch, or for some reason gave away innings at the end of the game. At the time, my view was pretty much in line with most of my views on statistics. The overall number was more important than the split. At the time, the Tigers were a top five offense in terms of run scoring and in terms of other stats like wOBA and wRC+. Or even basic numbers like OBP and OPS.
The Tigers were a good offensive and the inning to inning variation didn’t seem meaningful to me. Now that we have some more data, let’s take a look. Below are the Tigers runs per inning compared to the league average AL club.
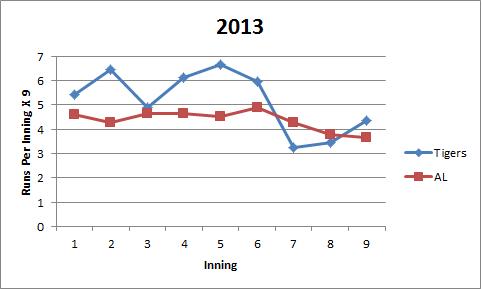
You’ll notice I’ve multiplied the runs per innings times nine so that you can more easily interpret the numbers. Entering August 30th, the Tigers have scored 5.2 runs per game and have five innings above that pace and four innings below. The entire AL scores 4.4 runs per game and has a four/five split above and below.
Several things jump out. First, it appears to be very common for teams to score fewer runs in the final three innings. Relievers allow fewer runs per inning because they don’t have to pace themselves like starters – this is well established. Second, you’ll notice that the Tigers outperform league average in 7 of 9 innings. Third, you’ll notice the 7th inning is the only inning in which they seriously under-perform.
But I’d like to call your attention to the 3rd inning. The Tigers have a drop off in production between innings 2 and 4 that otherwise goes unexplained. What is it about the 3rd inning that causes this? Nothing. That’s silly. Let’s now look at the percentage of innings in which the team scores – in other words controlling for the big innings. How often do they score?

This graphic tells the same story. The Tigers score frequently and they score a lot, with both a little lighter on the back end.
What does it all mean? First of all, they’ve improved in the late innings lately and limited some of the early season damage. In big enough samples, things tend to balance out. Second, runs scored are runs scored. They count the same in the first and the eighth, so what does it really matter?
They are outscoring their opponents by quite a bit. Does scoring less often in a certain inning reflect a real difference in ability? I can’t see how it would. What accounts for the difference between the 3rd and 4th innings? What about the the 6th and 7th? Their performance goes up and down, so it’s not attrition. They score better than average in the 9th, so it’s not like they wilt under pressure, because the 9th should have the most pressure because you’re running out of outs.
I don’t really have a good explanation, but I’m not sure we need one. The Tigers score a ton of runs and the distribution is balancing out to some degree. I really just wanted to put the numbers out there and let you make up your own mind. I don’t think the distribution is meaningful, but you might. Throw out some ideas in the comments section if you’re so inclined. They’re comfortably baseball’s best offense, must they also be the most even keeled one?
How Was The Game? (August 29, 2013)
A complete 180.
Tigers 7, A’s 6
Max Scherzer (27 GS, 183.1 IP, 2.90 ERA, 2.73 FIP, 5.5 WAR) entered the day likely driving the Cy Young bus, but stubbed his toe against the red hot A’s, allowing 6 runs (5 ER) in 5 innings courtesy of 2 HR. He struck out 5 and walked only 1, but much of the contact was sharp. He wasn’t atrocious by any means, but compared to the rest of his season, it’s hard to remember a day in which he was tagged any harder. The Tigers clawed at the sides of the early hole as they got a run in the 4th and 2 in the 6th, but entered the 9th inning down 6-3 with Balfour coming on. Jackson walked, Dirks popped out, and Avila struck out before a Fielder walk and Martinez single prepared Torii Hunter to come to the plate. After entering as pinch hitter earlier in the came, Hunter was hitting in the 6 spot, but that didn’t seem to matter as he drove the second pitch he saw out to left to win it for the Tigers. The win helps them avoid the sweep and guarantee they welcome the Indians to town no closer than 5.5 games back with Rick Porcello (24 GS, 142.1 IP, 4.49 ERA, 3.53 FIP, 2.5 WAR) taking the ball in the first game.
The Moment: Hunter walks off down 2, with 2 outs.
Dynamic Standings Projection (August 29, 2013)
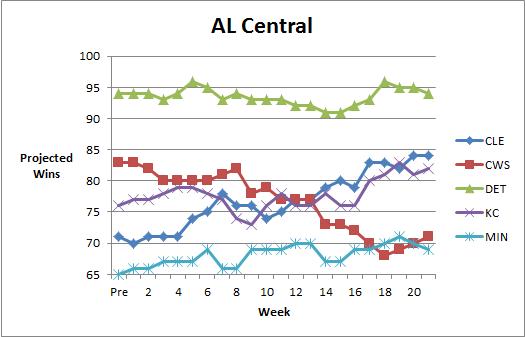
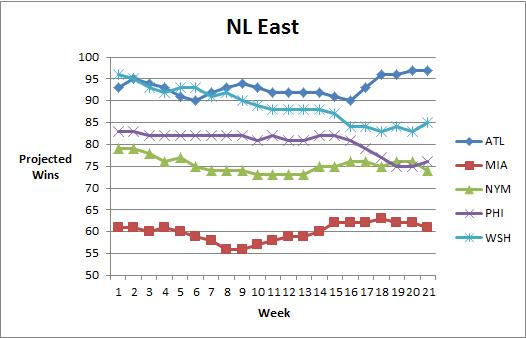
In case you missed it, in April we launched our Dynamic Standings Projection feature on New English D. A full explanation of the methodology can be found here or by clicking the tab at the top of the page. This project seeks to provide a reasoned and cautious approach to updating our beliefs about the baseball future. You can find a summarization of the original projections here. You’ll notice a column on the far right that indicates the difference in projected wins from the preseason prediction. Positive numbers mean teams are now projected to win more games and negative numbers mean a team is now projected to win fewer games. You’ll notice a series of graphs below the standings section that track how the projections have evolved over the course of the year.
This Dynamic Standings Projection is updated through the August 28 games. Note that DSP posts have been moved to Thursday accommodate something that won’t interest you.
| 29-Aug | W | L | PreDiff | |
| TB | 92 | 70 | 0.568 | 1 |
| BOS | 92 | 70 | 0.568 | 15 |
| BAL | 86 | 76 | 0.531 | 4 |
| NYY | 85 | 77 | 0.525 | 0 |
| TOR | 75 | 87 | 0.463 | -12 |
| W | L | PreDiff | ||
| DET | 94 | 68 | 0.580 | 0 |
| CLE | 84 | 78 | 0.519 | 13 |
| KC | 82 | 80 | 0.506 | 6 |
| CWS | 71 | 91 | 0.438 | -12 |
| MIN | 69 | 93 | 0.426 | 4 |
| W | L | PreDiff | ||
| TEX | 94 | 68 | 0.580 | 3 |
| OAK | 91 | 71 | 0.562 | 7 |
| LAA | 76 | 86 | 0.469 | -12 |
| SEA | 73 | 89 | 0.451 | -2 |
| HOU | 55 | 107 | 0.340 | -5 |
| W | L | PreDiff | ||
| ATL | 97 | 65 | 0.599 | 7 |
| WSH | 85 | 77 | 0.525 | -10 |
| PHI | 76 | 86 | 0.469 | -8 |
| NYM | 74 | 88 | 0.457 | -4 |
| MIA | 61 | 101 | 0.377 | -2 |
| W | L | PreDiff | ||
| STL | 94 | 68 | 0.580 | 6 |
| PIT | 92 | 70 | 0.568 | 10 |
| CIN | 91 | 71 | 0.562 | -1 |
| MIL | 73 | 89 | 0.451 | -6 |
| CHC | 68 | 94 | 0.420 | 0 |
| W | L | PreDiff | ||
| LAD | 94 | 68 | 0.580 | 6 |
| ARZ | 83 | 79 | 0.512 | 1 |
| SF | 75 | 87 | 0.463 | -16 |
| SD | 74 | 88 | 0.457 | -4 |
| COL | 74 | 88 | 0.457 | 11 |


How Was The Game? (August 28, 2013)
Not much to look at.
A’s 14, Tigers 4
Doug Fister (27 GS, 172.2 IP, 3.81 ERA, 3.22 FIP, 3.9 WAR) didn’t pitch as poorly as the line indicates, but that isn’t to say he pitched well. He allowed 7 runs in 5 IP courtesy of 13 hits, but no walks and 2 Ks. Not much of the contact was hard, but it still wasn’t one of the Fister’s better nights. The offense had some early chances against Straily, but other than Hunter’s solo shot, they couldn’t deliver until it was too late. Other than some nice defense from Jose Iglesias, this was just one to forget and the Tigers will try to do just that and avoid the sweep with Max Scherzer (26 GS, 178.1 IP, 2.73 ERA, 2.61 FIP, 5.6 WAR) getting the nod on Thursday.
The Moment: Iglesias makes some nifty plays.
Al Alburquerque’s Magic Pitch

Let’s get a few things out of the way early. Al Alburquerque gets a lot of strikeouts and issues a lot of walks. 33.7% of the batters he has faced in his career have struck out. 16.1% have walked. Add those together and we’re talking about 49.8% of his career has been spent not letting the hitter put the ball in play. It should also be noted that his arm should probably fall off given that pitching with good mechanics is very violent and he doesn’t have good mechanics.
Al-Al (as I’ll refer to him because his last name takes forever to type) is really good at not allowing batters to make contact and when they do, it’s not usually great contact. In his career, he’s allowed a .291 SLG (MLB average is about .400). In 95.1 IP, he has a 2.93 ERA, 2.71 FIP, and 1.9 WAR. He’s been erratic, but he’s been very effective – and that includes slightly elevated 2013 numbers based on an out of the ordinary BABIP. He’s not likely to produce a .220 BABIP like he did in 2012, but .350 is likely too high as well.
All in all, Al-Al is a dangerously talented all or nothing kind of arm. He might throw 10 straight balls or he might retire six batters like nothing. You know this about him and you know that he’s got a two pitch mix. Fastball, slider. That’s it. The fastball is good when he can command it, but his moneymaker is his slider. This post is about that slider for no other reason than it is incredible.
Since he only has 95.1 career innings, I’m going to stick with career long stats entering play on August 28th. Coming in, Pitch F/X says he’s thrown 974 sliders (about 60% of his pitches) and has allowed a .130/.226/.148 line against, good for a .186 wOBA and 20 wRC+. Those are insane numbers. Against Al-Al’s slider, hitters are 80% worse than league average. They slug 100 points lower than league average batting average. It’s incredible.
He gets a 24% swinging strike rate against it. League average in 2013 is 9.2%. He gets a 47.9% Contact%. League average is 79.7%. Among pitchers to throw 600+ sliders in the Pitch F/X era, no one has a higher Whiff/Swing rate on that pitch than Al-Al’s 54%. It’s nasty. When batters hit it, it rarely does much. And they don’t hit it very often.
As far as its properties, it only averages 1.5 inches of horizontal movement, but has a very nice -0.4 vertical movement (remember vertical movement is compared to where it would be compared to a pitch that isn’t spinning without gravity). I’ll show you. He’s gone 80-90 with a an 86 mph average:

But let’s get fancy and look at vertical movement with horizontal:

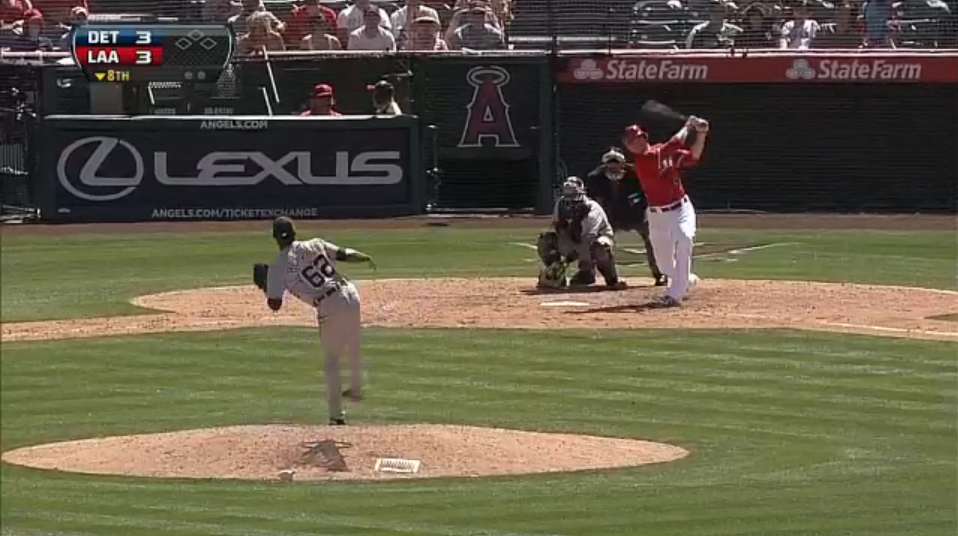
It’s a good slider, but it’s not the best slider if you’re looking at it in terms of its basic properties. It’s 86 mph with 0-5 inches of horizontal break and somewhere in the 5 to -5 vertical range (remember this factors out gravity!). That’s a nice slider, but its not the best in the league. The key, I imagine, is how difficult the pitch is to pick up. Let’s consider a couple of images:
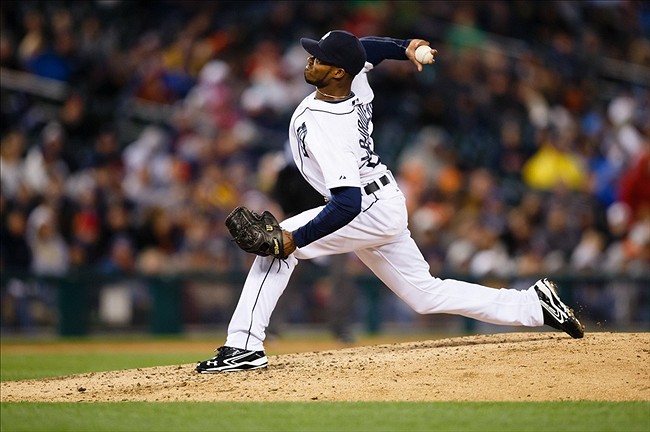
Hopefully you can see that the ball is behind his head. I think this is a slider, but I can’t be sure. He’s hiding that ball for a long time. Let’s try to get a better screen grab:

What are you supposed to do with that? By that point in his delivery, Verlander has the ball way out in the open. Not surprisingly, Trumbo swung and missed at this slider. (PS: If someone can teach me to make GIFs, that would be super cool).
So let’s review. Alburquerque’s slider is very effective and his main fault is being wild. His slider has solid movement and velocity, but the key is that you just can’t see it coming. I can only imagine what it’s like to stand in the batter’s box. The ball comes from behind his head!
Two lessons jump out. One, if Al-Al finds a way to get down to like, 4 walks per 9, he’ll be the most dominant reliever in the game. Two, his elbow is going to explode at some point. Elbows shouldn’t move like normal pitchers make them move. This movement is just ridiculous. Good luck, people facing him. I would just recommend you look for a walk.
How Was The Game? (August 27, 2013)
Nasty, brutish, and short.
A’s 6, Tigers 3 (5+ innings)
Justin Verlander (28 GS, 178.2 IP, 3.73 ERA, 3.54 FIP, 3.7 WAR) had a very bad first inning and while his team recovered very quickly, he would eventually dig the hole too deep. Only 3 of his 5 runs were earned across 5 innings of 3 BB and 3 K baseball, but even allowing three in five innings is too many to average. The bats got him three runs in the 1st thanks to a bases loaded single by Fielder, but they would get no more as the rains came early and often. The game should have been delayed much earlier, but the umpires pushed it to the point of comedy and we ended after 5.5 innings. The Tigers didn’t deserve to win, but it is ridiculous the way the league/umpire attempt to push games past 5 innings in order to make them official, and while doing so, make the games a joke. You shouldn’t play 3 innings in pouring rain. Hopefully Wednesday night will be drier for Doug Fister (26 GS, 167.2 IP, 3.54 ERA, 3.25 FIP, 3.7 WAR) who will try to get the Tigers a win. Sleep it off Detroit.
The Moment: Fielder delivers a 2 run single.
How Was The Game? (August 26, 2013)
Full of free passes.
A’s 8, Tigers 6
Anibal Sanchez (23 GS, 144.2 IP, 2.61 ERA, 2.43 FIP, 4.9 WAR) didn’t bring his best tonight, but he kept the Tigers in the game with 5 pedestrian innings of 5 H, 4 R, 3 BB, 6 K baseball against the Oakland A’s. He left the game trailing 4-2 thanks to an Infante HR and watched Cabrera tie it up at 4 with a 2 run opposite field blast in the 5th. However, the bullpen couldn’t hold it as Alvarez surrendered two and Alburquerque and Bonderman each allowed one. The Tigers had a shot with the bases loaded and two outs in the 7th, but Fielder flew out to deep left center. Martinez crushed one in the 8th to narrow the deficit but Hunter failed to deliver with the bases loaded as the Tigers left them full for a second consecutive inning. They added a run in the 9th but would get no closer. The pitching betrayed the Tigers on this night, even if it did seem like the offense failed to deliver in a couple of big spots. With three more left with the A’s, they will shake it off and call on Justin Verlander (27 GS, 173.2 IP, 3.68 ERA, 3.46 FIP, 3.7 WAR) for game two on Tuesday.
The Moment: Cabrera ties it at 4 with a 2 run HR.
Jon Heyman Kills The Win While Trying to Save It
Here at New English D we are on the front lines of the #KillTheWin movement. If you’re new to the site and are open-minded, please check out our 5 part series on why wins aren’t useful:
- You Can Pitch Great and Not Win
- You Can Pitch Poorly and Win
- Wins Don’t Even Out Over Long Careers
- Wins Mislead You When Comparing Players
- Assorted Facts About Wins from 2013
All of those links make a singular case. Wins are not useful when evaluating individual pitchers. The goal of baseball fans and analysts is to properly understand the game we love. Wins don’t cause poverty, but wins are detrimental to our understanding of baseball because so many people use them as a measure of value, which they are not.
Today, Jon Heyman wrote about Max Scherzer (currently leading the league in wins by a lot) and couldn’t resist fighting back against the #KillTheWin movement. He makes several points. First, he argues that Scherzer should narrowly beat Felix for the AL Cy. Hey, we agree on that! Second, he says those of us trying to kill the win are wasting our time. That’s silly because we enjoy killing the win and baseball is about having fun, but I’m not going to engage in pettiness when the real issues are much more important.
Next, Heyman says:
Wins do matter (though clearly not nearly as much as we once thought — and I give the stat guys credit for pointing this out.) No starter gets to 19-1 only because they are lucky, or because they “happened” to be “standing on the mound” when his team scored a ton of runs, as some would have you believe.
So here we see Heyman acknowledge that he places less stock in wins today that he used to. Meaning that he was wrong before and therefore could be wrong again. Furthermore, Heyman says no one goes 19-1 because of luck/happenstance/standing on the mound. Actually, Jon, they do. Scherzer is an excellent starting pitcher, but he is not meaningfully better than Felix. Certainly not better than Kershaw or Harvey. Yet he has many more wins than they do and many fewer losses. The difference is that the Tigers score crazy amount of runs for Scherzer because they are really good at scoring runs. Additionally, he gets more runs than his other rotation-mates. Scherzer gets 7.32 runs per 9. Felix gets 4.73. Chris Sale gets 3.03.
Even if you want to dramatically oversimplify baseball and assume a pitcher controls everything that happens when he is on the mound (he doesn’t), he still has no control over what his offense does. In order to get a win, you have to be in the game when your team takes the lead for the final time. If you team doesn’t score, or scores AT THE WRONG TIME, you do not get a win regardless of how you pitched.
It’s obvious that Heyman knows this based on his comments throughout the piece:
There are a lot better numbers to illustrate a pitcher’s performance over a season than wins and losses.
But does that mean a pitcher’s record is now totally worthless?
Heyman argues that wins are not the most important thing, but that they are not worthless. Which poses the important question at which I will now arrive. What do wins tell us that we can’t see in other stats?
What is the value of seeing a W/L record beyond seeing things like ERA, K%, BB%, GB%, FIP, xFIP, WAR, RE24, SwStr%, IP, etc? What do wins and losses add to the discussion?
Nothing. Not one thing. Heyman says consistency, but that isn’t the case. Check out the link about about “misleading” and you’ll see that argument doesn’t hold water. Good, consistent pitchers can win less often than bad and inconsistent ones. Heyman says wins aren’t about being in the right place at the right time, but they clearly are. The Tigers score a disproportionate number of runs for Scherzer than they do for his teammates. Scherzer is both good and lucky. They aren’t mutually exclusive, but that doesn’t mean he should get credit for something he had nothing to do with.
Scherzer is great. He has an excellent W/L record. Those two things are related, but not highly related. Good pitchers, on average, win more often than bad ones because they have some control over the number of runs they allow but that doesn’t mean judging a player by wins and losses is useful. It adds nothing to our understanding and does more harm than good. Heyman cites Tillman making the ASG as case and point.
Wins influence people’s thinking, whether it’s Tillman in the ASG or it’s Dusty Baker leaving Bailey on the mound when he was losing it so he could “have a chance to get a win.”
My argument here is that wins provide us with no meaningful information and at best are trivial and at worst are negatively impacting games. Heyman concludes:
The goal, ultimately, is to win games when a pitcher takes the mound, and Scherzer has done that better than anybody. Yes, there is a lot of luck involved in getting pitcher wins. But in Scherzer’s case, he has pitched great, too, and no one should claim he hasn’t.
Which is interesting, because the Scherzer is getting a lot of luck as far as wins go. Sale isn’t pitching as well as Scherzer, but he’s not pitching 9-12 to 19-1 worse. Also, Heyman is using a strawman argument in his closing. No one, not one single person, thinks Scherzer hasn’t been great. He’s been amazing. Fantastic. Cy Young or very close to it, brilliant. That’s not what this is about at all. He’s 19-1 and Chris Sale is 9-12. He’s not “10 wins” better than Sale. Not under any real definition of pitching ability or performance. This is a statistic that doesn’t reflect performance at all. It adds nothing to the conversation you can’t get elsewhere. That’s why we want to kill it.
I would like to point out the broader issue. Heyman is actually one of the more evolutionary members of the old guard. He clearly sees the fault in wins, but still wants to defend them. Read his defense. Think about it for yourself, it’s like he wants to hold onto wins because he’s used to them. And that’s not a good reason. “How we’ve always done things” is not a good way to make decisions.
I don’t understand the purpose of Heyman’s argument. Why does he want to save them? What utility do they bring to the conversation? This is not a personal assault on Heyman, but he put his views out there in writing, so they are open to criticism. I’m an academic and a baseball writer, so I know about critical feedback. You’re welcome to criticize my reasoning as well. I can take it, don’t worry. I offered Heyman a chance to clarify his message on Twitter and he has yet to do so. If he writes back, I’ll be glad to amend this post.
There is no value in looking at wins and losses for a starting pitcher. That’s not about Scherzer or Felix, it’s about analysts and fans. In fact, Heyman and his fellow BBWAA members should use their access to go ask Scherzer about wins, or even Google his quotes on the issue. He gets it and he’s the person who benefits most from looking at wins. If he doesn’t care about them, it’s time to let them go.
How Was The Game? (August 25, 2013)
A nice easy sweep.
Tigers 11, Mets 3
The Tigers slugged their way to a sweep of the Mets on Sunday thanks to a pair of two run homeruns from Miguel Cabrera and Andy Dirks who backed a 7 inning, 3 run affair from Rick Porcello (24 GS, 142.1 IP, 4.49 ERA, 3.53 FIP, 2.5 WAR) who continues to be baseball’s best number five starter. He handed out some free passes, but the only real blemish was a two run homerun to d’Arnaud. Porcello retired the last seven he faced and added four strikeouts to set a new career high. While the Tigers were in position to win entering the 9th inning, they decided to really make sure as they put up 7 insurance runs on a 10 batter hit parade. The win moves the Tigers to 77-53 and sets them up to take on Oakland for four at Comerica Park with Anibal Sanchez (22 GS, 139.2 IP, 2,45 ERA, 2.34 FIP, 4.8 WAR) getting game one.
The Moment: Cabrera launches a monster homer in the first.
