A Changeup in the Tigers Pitching Approach

Fastball velocity catches your attention. Knee-buckling breaking balls demand respect. But the changeup is not usually a pitch that grabs headlines, but here I am, writing about it. I’ve mentioned it briefly in these electronic pages and Rod Allen has touched on it as well: the Tigers are throwing more changeups and it’s working.
Now I’m not sure if this change is coming from Jeff Jones, the Tigers pitching coach, or Jim Leyland. Maybe it’s coming from Alex Avila. Perhaps the starters are doing it themselves and learning from one another. Heck, the front office could be putting useful information about the pitch in front of the players. I don’t know the answer, but I know it’s happening and I know it’s yielding some good results.
First, let’s check out the Tigers starting pitching as a whole over the last five seasons:
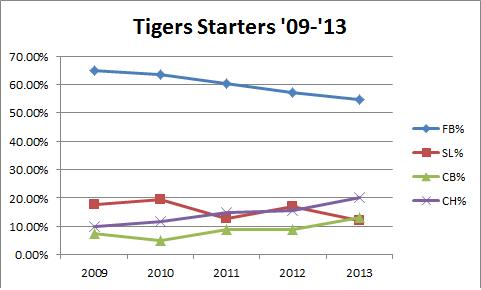
The trend is pretty clear, even if we can’t identify the cause. The Tigers are trading fastballs and sliders for curveballs and changeups. Now the slider versus curveball transformation could be many things, but those are both breaking balls and they are moving together. The changeup is a distinct pitch. Let’s look at the same chart but with sliders and curveballs combined:

This allows you to see the trend a little better. Fastballs down, changeups up. Breaking balls mostly constant (splitters, cutters, knucklers all excluded due to very low numbers).
So is this an overall trend that reflects a difference in organizational approach, or is one pitcher getting changeup happy and obscuring the results. (The size of the scale on the vertical axis makes these changes look minor, but we are talking about noticeable changes).
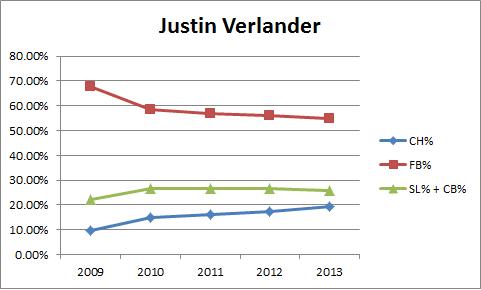
Justin Verlander
Verlander, as you can see below, matches the overall trend perfectly. He’s changed the breaking ball he throws, but he hasn’t really changed the percentage of breaking balls. He has, however, traded fastballs for changeups:

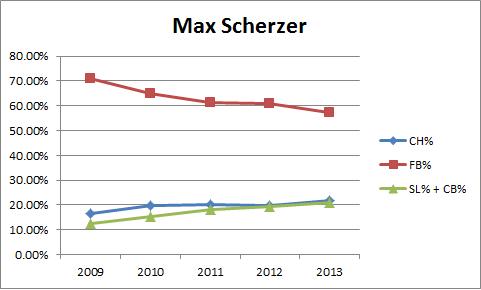
Max Scherzer
The pattern fits Scherzer (joined the Tigers in 2010) a bit less cleanly, as he is using more breaking balls and changeups instead of the fastball. You can see here:

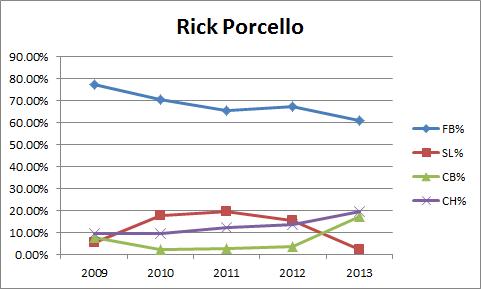
Rick Porcello
I’ve made a ton of Rick Porcello’s breakout campaign this season, and looking at his pitch type, he fits the mold perfectly:

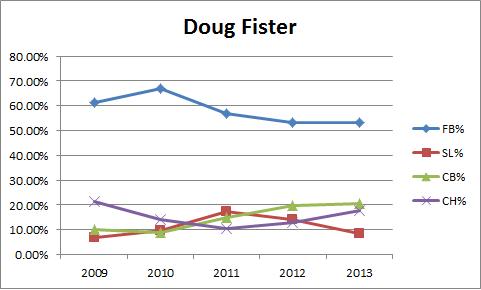
Doug Fister
Fister, too, fits the mold especially if you look at his change from 2011 (when he joined the Tigers):

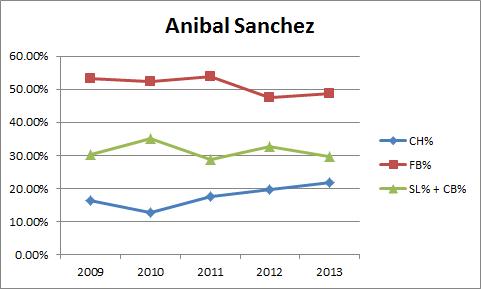
Anibal Sanchez
Sanchez also fits the mold, especially since joining the Tigers last year, but he is trading breaking balls for changeups more so than fastballs in recent years:

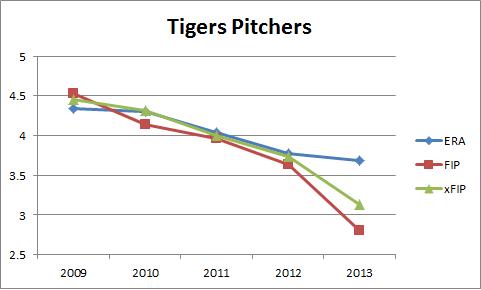
Twelve graphs later, what have we learned? Well we can see that the Tigers starters are collectively and individually moving toward changeups at the expense of the fastball, while also shifting which types of breaking balls they throw. I’m not sure if this change in approach is coming from the pitching coach, the catcher, or the pitchers themselves, but the trend exists and it’s hard to argue with the staff that has 4 of the top 12 pitchers by WAR so far in 2013 and leads the league by more than 3 full wins as an entire pitching staff.
You can see how the results are getting better, even if not all five guys were on the staff each year. Compare this to the top charts. I’m not making the case that the changeups are making the Tigers staff this much better, but rather that the change in pitch type as an organization is a noticeable trend that is tracking with success:
And the last question you should be asking, also has an answer. This is not a league-wide trend:

The Tigers are throwing more changeups. I’m not sure whose idea it was, but it’s working and it isn’t happening in all 30 major league cities. Changeups aren’t usually thought about as a “stuff” pitch, but it might be time to rethink that approach. I know there are some advocates for the pitch, like Dave Cameron at Fangraphs, who like me, thinks great changeups are vastly underappreciated, but on the whole, we overlook the changeup. Maybe we shouldn’t.
The Morning Edition (May 30, 2013)
From Last Night:
- Baltimore’s 6 run 7th tops Zimmerman’s 3 HR night
- The Mets beat the Yanks with 5 in the first, but Nova delivers an immaculate inning
- Navarro homers 3 times as the Cubs beat the White Sox
What I’m Watching Today:
- Felix goes at Petco (330p Eastern)
- Moore faces the Marlins (7p Eastern)
- Michael Wacha makes his MLB debut for the Cards
The Big Question:
- Has the Cardinals draft team been tested for PEDs?
I spend some time checking into various baserunning numbers and threw several tweets out regarding those numbers (you can read them if you look to the right of this page) and I made this handy graph comparing how often a team scores from second base on a single:

You can see 60% is about average and the Mets lead the way with 79%, but look at those Astros. My, my those Astros. 39%.
How Was The Game? (May 29, 2013)
Very good, and then it totally unraveled.
Pirates 5, Tigers 3
This game can be thought of as a two act play. The first act got rave reviews as the Tigers jumped out to a 3-1 lead thanks to a three run 5th and a great start by Anibal Sanchez (5-5, 71 IP, 2.79 ERA, 1.87 FIP, 3.1 WAR). But in the bottom of the 7th, this would be the start of act two, the Pirates jumped on Sanchez so quickly he didn’t know what hit him.

They got 4 runs on 5 hits and a walk in the inning to chase Sanchez with a final line of 6.2 IP, 7 H, 5 R, 1 BB, and 9 K. Now trailing by two the Tigers made a run at a comeback, but ultimately came up short and will need to win tomorrow behind Doug Fister (5-2, 61.2 IP, 3.65 ERA, 2.89 FIP, 1.8 WAR) to split the four game, home and home series, with the Pirates.
The Moment: Cabrera smacks an opposite field bomb in the 5th.
Dynamic Standings Projection (May 29, 2013)
In case you missed it, last month we launched our Dynamic Standings Projection feature on New English D. A full explanation of the methodology can be found here or by clicking the tab at the top of the page. This project seeks to provide a reasoned and cautious approach to updating our beliefs about the baseball future. You can find a summarization of the original projections here. You’ll notice a column on the far right that indicates the difference in projected wins from the preseason prediction. Positive numbers mean teams are now projected to win more games and negative numbers mean a team is now projected to win fewer games.
This Dynamic Standings Projection is updated through the May 28 games.

The Morning Edition (May 29, 2013)
From Last Night:
- Harvey and Kuroda deliver a classic duel in NY
- Lee dominates the Red Sox, wins 3-1
- Rays walk off against the Marlins
- McCann homers in the 10th to lift the Braves over the Jays
What I’m Watching Today:
- Zimmermann faces the Orioles in Baltimore (7p Eastern)
- McCarthy looks to stay hot against the Rangers (8p Eastern)
- Weaver returns to action against the Dodgers (10p Eastern)
The Big Question:
- How do you like some of these home and home series in MLB?
Cliff Lee in 2013: 7.03 K/9, 1.45 BB/9, 0.56 HR/9, 39.1 GB% 2.34 ERA, 2.84 FIP, 3.63 xFIP, 2.0 WAR
Rick Porcello in 2013: 7.06 K/9, 1.76 BB/9, 1.24 HR/9, 55.7 GB%, 5.29 ERA, 3.93 ERA, 3.15 xFIP, 0.7 WAR
Once their HR/FB rates normalize (5.5% to 19.4%), they’re basically the same pitcher with Porcello getting the ball on the ground more often. I’m not saying Porcello is going to be Cliff Lee, but so far, it’s not such a crazy thought. (Innings aside)
How Was The Game? (May 28, 2013)
Baseball as it should be, with an unfortunate ending.
Pirates 1, Tigers 0
I’ve been banging the Rick Porcello (2-2, 51 IP, 5.29 ERA, 3.93 FIP, 0.7 WAR) drum pretty hard for a long time, and as recently as two weeks ago, and it was so much fun to watch him walk out onto the mound after a rain delay tonight and deliver the best performance of his career. He was brilliant from the start and finished with 8 innings, 3 hits, 0 runs, 1 BB, and 11 K. Only two balls were hit in the air against him all night, both of which were caught. The three hits were groundball singles up the middle. Nothing else of any substance came off the bats of the Pirates hitters and Porcello (as you can see below) continued his march toward his breakout year.

For their part, the Tigers offense made him sweat and didn’t deliver anything, even into the 11th inning, when Neil Walker’s solo HR gave the Pirates a 1-0 lead that would hold.The loss gives the Tigers a 4-2 homestand and a 29-21 record so far on the year as they pack up and head to Pittsburgh to play the second half of the home and home series. Anibal Sanchez (5-4, 64.1 IP, 2.38 ERA, 1.78 FIP, 2.8 WAR) will start game one Wednesday looking to continue his great season and keep his near no-hitter stuff going.
The Moment: Porcello strikes out his 11th batter to set a new career best.
Jhonny Peralta Turns 31 During a Great Season

Today is Jhonny Peralta’s 31st birthday. Most major league baseball players have their best seasons at or before they turn 30, but Peralta might be making an attempt to buck that trend. His best MLB season to date was 2011 in which he accumulated 5.0 WAR, while his best offensive season was 2005 in which he he provided 136 wRC+. I separate the two because this post is about Peralta at the plate, so his considerable improvement according to the defensive metrics over the last few years is worth separating out. Let’s take a quick peak at Peralta in 2005 and 2011:
2005: .292/.366/.520, 136 wRC+, 4.4 WAR (570 PA)
2011: .299/.345/.478, 122 wRC+, 5.0 WAR (576 PA)
His best offensive season was 2005, when he was 23, and his second best was in 2011 when he was 29. At 31, he is making a run at his best season yet. So far, he’s hitting .341/.392/.500, 139 wRC+, 2.1 WAR (195 PA). If we assume he will play 150 games based on career norms, he is set to accumulate career best 7.0 WAR.
But he likely won’t keep up this pace because this is a borderline MVP pace and he’s never done that before and players generally don’t get significantly better after age 30. A player’s performance is also not uniform over an entire season and it would be wrong to assume he will play at this pace for the rest of the year simply because that would be unlikely even if he did get tangibly better.
One of the reasons Peralta isn’t going to keep this up is because he has a very high, unsustainable Batting Average on Balls in Play (BABIP), which is a statistic we associate with luck. The standard BABIP rule of thumb is that .300 is where you expect most players to converge toward, with better hitters maintaining numbers in the middle .300s. The idea here is that when you put the ball in play, you only have control over how hard you hit it and the precise location is outside of your control. Sometimes you’ll smoke a baseball and it will be caught and sometimes a bloop hit will fall. In general, these take a a couple thousand plate appearances to balance out.
This is not to say that hitters can’t influence their BABIPs with their approach and talent level, but rather that BABIP will regress toward a player’s career norm and that small sample BABIPs can lead you to make mistaken predictions.
Jhonny Peralta’s BABIP in 2013 is .414. That’s very high. His career BABIP entering 2013 was .310, meaning it is unlikely that Peralta will be able to maintain his high BABIP, and with it, his current level of production. It’s possible that he got better, but it is not possible his true talent level is now a .414 BABIP.
The highest BABIP among active players is .367, with a number of the games’ best hitters in the .330 to .360 range. The highest modern day BABIP is Ty Cobb, coming in at .378. League average BABIP for non-pitchers over the last 10 years hovers between .294 and .305.
This is all by way of saying that Peralta’s early season success isn’t around to stay. He’s still very capable of having a great year, but it isn’t going to look like this, don’t fool yourself.
But as I gathered my thoughts last week and discovered his high BABIP, I thought, “Meh, a high BABIP post isn’t interesting. He’ll regress back toward career norms and will have a solid, 2011 type season. Nothing wrong with that, but not super interesting to write about.”
Well, then I thought to myself, perhaps I’m missing something. Perhaps Peralta’s good BABIP luck is hiding an actual improvement in his skills. Maybe he’s gotten better and luckier in his 31st year on Earth.
Peralta is walking and striking out at rates almost identical to his career rates and his Isolated Slugging Percentage (ISO) is even more identical to his career line. His triple slash line is equally buoyed this year by about 70 points all the way around (74/62/75):
Career: .267/.330/.425
2013: .341/.392/.500
If you erase the BABIP increase, he’s pretty much the Jhonny Peralta you knew. So how much, if at all, is the BABIP increase a change in skill?
Wait a second! Peralta is doing something different if you look at the results:

Peralta is hitting more line drives and more groundballs at the expense of hitting the ball in the air. This is important because line drives and groundballs are more likely to go for hits than flyballs, which could actually make his BABIP shift reasonable in direction if not in magnitude. In other words, the balls are coming off Peralta’s bat this season on a different trajectory that they did in the past. This could be something.
If we look at his spray charts from April and May from 2012 and 2013 we notice he’s using the lines more effectively this year, but the comparison I want to show you is the one between 2010 and 2013 because it shows the difference between a flyball heavy approach and a groundball heavy approach as you can divine from the graph above:
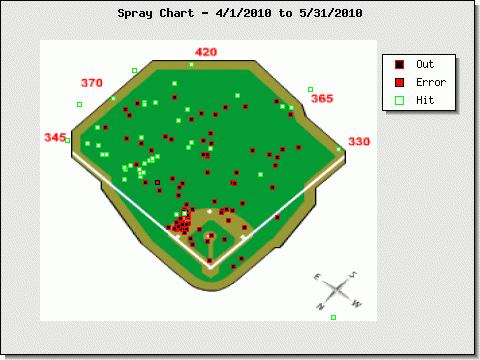
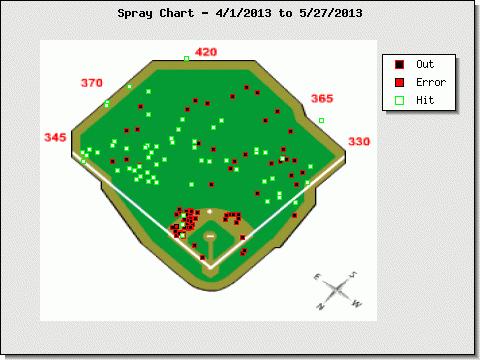
What we see here is that as Peralta has changed as a hitter, he has started to get hits to right field. Everyone knows that. He’s definitely learned to go the other way, but what is also striking to me is that he is also making fewer outs in the air to left field. He’s making fewer outs in the outfield period. He’s getting a band of hits in front of the outfielders in a way that didn’t happen in 2010.
So while Peralta’s numbers this year are great, his high BABIP means he’s not going to keep up this pace. But if you look at the batted ball data, you can see that he changing the way he makes contact to some degree and is inducing different trajectories off the bat. He’s not a 7.0 WAR player like the pace indicates, but there is reason to believe that if he continues to impress the defensive metrics, he may hit well enough to approach another 5.0 win season.
The Morning Edition (May 28, 2013)
From Last Night:
- The Mets rally late to back a strong outing by Niese against the Yanks
- Samardzija drops a CGSO against the cross town Sox
- Aaron Harang also provides a CGSO against San Diego
- Skaggs is sharp at the front of a doubleheader
- Wainwright goes 8 to beat Shields and the Royals 6-3
- Gomez homers twice, but the Crew lose to the Twins
- The Astros walk off in 12 versus the Rockies
- Votto’s 8th inning homer leads the Reds over the Indians
What I’m Watching Today:
- Gausman takes his second turn, gets the Nats (7p Eastern)
- Matt Harvey faces the Yankees for the first time (7p Eastern)
- Cliff Lee comes to Boston (7p Eastern)
- Chris Sale tries to take one from the Cubs (8p Eastern)
The Big Question:
- Is the new schedule dulling interleague play?
Danny Knobler at CBS wrote yesterday how little buzz there is for this week’s big interleague matchups and I’m in total agreement. Interleague play, which is the scorn of my father’s generation, used to feel special for me. It would be fun to spend a couple weeks watching players from the NL that I usually didn’t get to watch up close. Now, those teams are sprinkled into the normal schedule after nearly 20 years of being confined to a fortnight or so in June. The novelty has really lost its luster. It feels strange and awkward and forced. It’s either time to add two more teams and dump interleague play or get rid of the pretense all together and play all 29 clubs.
How Was The Game? (May 27, 2013)
A much more typical affair.
Tigers 6, Pirates 5
After three shaky starts in a row, Justin Verlander (6-4, 66 IP, 3.68 ERA, 2.26 FIP, 2.5 WAR) set out to silence the doubters and did a fine job, delivering 7 innings of 3 run baseball that featured 13, yes 13, strikeouts and just 2 walks. The final stat line actually belies Verlander’s dominance as the Pirates grabbed two of their runs at the very end of the game. For most of the contest they were absolutely overmatched, until the fourth trip through the lineup. You can also see here that his fastball velocity matched the typical Verlander style that we came to love with the early ones in the low 90s and the late ones ratcheting up toward 100 (via Pitch F/X classification and velo):

On the other side, the Tigers got runs off three Jhonny Peralta (.341/.392/.500, 138 wRC+, 2.1 WAR) RBI hits, a Brayan Pena bases loaded walk, and a big Victor Martinez double. Benoit allowed two runs in the 8th inning, but also registered his first career pickoff in 805.2 career innings and turned it over to Valverde in the 9th who put the tying run on before getting out of the inning. The Tigers added their 6th win in their last 7 and now stand at 29-20 with Rick Porcello (2-2, 43 IP, 6.28 ERA, 4.53 FIP, 0.3 WAR) on the hill tomorrow looking to sweep the home half of this four game set with the Pirates.
The Moment: Verlander Ks 13 Pirates.
Two Reasons Max Scherzer Got Tougher

Last week, I spent some time breaking down Max Scherzer’s great start against the Indians and pointed out some factors that led to his success: 1) command of his fastball 2) better velocity 3) and increasing velocity in the late innings. But Scherzer was strong again yesterday and I took a quick peak as to why. Here are two things I found:
1) Excellent Command
First, let’s look at his strikezone plot from the Indians start
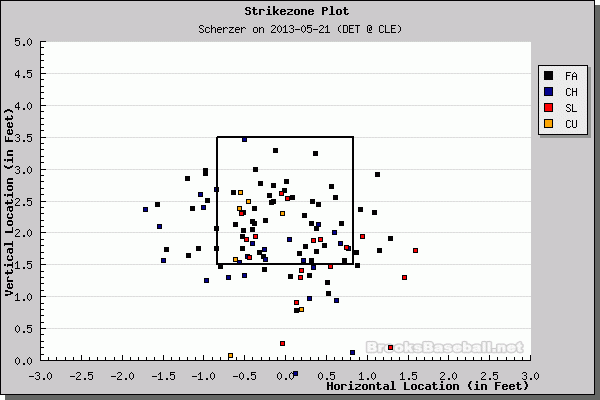
He stayed away from the high 1/4 of the zone, only pitching there four times. But let’s look at yesterday:

Scherzer threw one pitch that was in the zone and in the top 1/4 of the zone. One. There are also fewer pitches in the dirt and a few more at hitting height but outside the reach of the hitters.
2) Fastball Movement
Here’s a plot of Scherzer’s velocity and horizontal movement from the Cleveland start and then the Twins start.
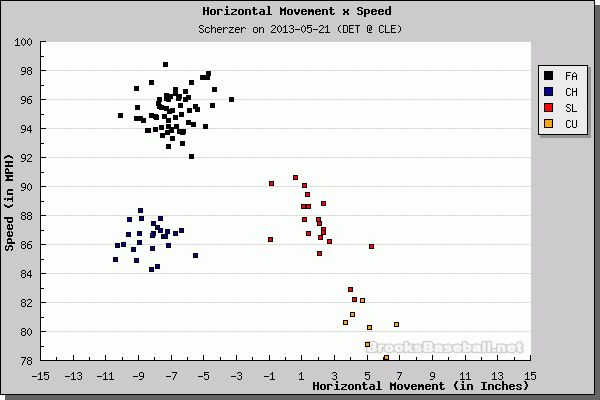

These graphs are on identical horizontal scales. Look at how much more movement he got on his fastball and changeup.
Velocity is great, Scherzer has it. Command is great, Scherzer has it. Movement is great, Scherzer has it. He’s having his best season so far and should probably start thinking about making reservations in New York for the Midsummer Classic.
