A Quick Verlander Release Point Recap

About two weeks ago I wrote a piece explaining how Verlander’s troubles this season can be chalked up to his inconsistent release point. You can read the entire thing here, in which I lay out the problem in the results, the causes of those problems, and the root cause – release point – that is behind the whole thing. I’ll trust that you’ll believe me or go back and read that piece so I don’t have to repeat myself here.
It’s August 6th and Verlander just twirled 8 excellent innings against the Indians and the initial thing that will catch your eye is his increased fastball velocity (average 96.9, top 100.8). But as you know, I’m not interested in the velocity issue, I’m interested in his release point. So how’d it look?
First, let me show you full season graphs from 2012 and 2013 to get you up to speed on what we’re looking for (from catcher’s perspective):


The difference is obvious. In the initial post I isolated it by pitch type, but let’s just keep it going. You’ll notice our goal is to keep everything to the left of the imaginary -1.5 line. You want the data points between -2.5 and -1.5. That’s the sweet spot. Also between 6 and 7 feet vertically, but that hasn’t been an issue this year.
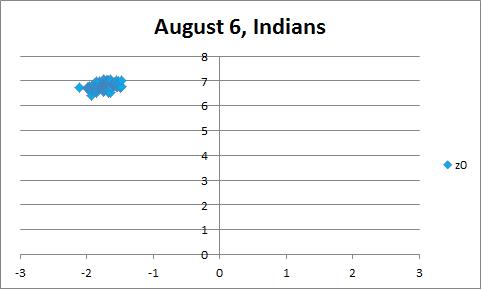
How’d he do tonight?
First allow me to apologize for using a different plotting source. The graphs above are from FanGraphs, which won’t update until tomorrow. Below is from Brooks Baseball. I’ll make two notes. One, I’ve looked at the actual numbers from the source and they confirm the graphic. Two, I’ve drawn in the lines of interest because I’m a super helpful guy.

The danger zone is empty. If you look at the source data, there are a couple points that are technically less than an inch over the -1.5 line, but the first two graphs aren’t super precise, so that’s not an issue. I would also like to point out, that thanks to reader suggestion, I checked to see if the Cleveland Pitch F/X setup could be influencing these results. Comparing Sanchez’s start on Monday compared to his last start at Comerica Park showed no systemic bias. In fact, if anything, my exploration of other Sanchez starts indicates that the Cleveland setup might actually be working against Verlander in the example I’m about to show you. I’m not going to wager my life savings on this, but JV’s improvement seems to be showing up despite any sort of technical issues.
If you take a look at the movement charts, there is still room left to improve. The curveball had nice depth, but it needs more horizontal tilt. That said, the velocity is up and the release point looks great. I’m encouraged. The process was good and the results were there against a very good offense. Want more evidence? Below I’ve done the plotting myself for consistency. The first is a terrible start against the worst offense in the AL, the second is tonight against the very good Indians:

Need I say more?
Guys, I think he’s back. The American League is on notice. (Editor’s note: The velocity and release point gains carried into his next start. Details here)
