Dynamic Standings Projection (September 19, 2013)
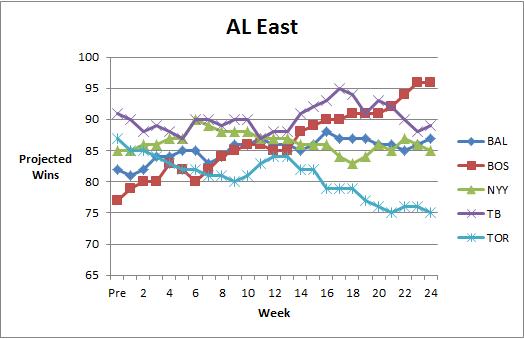
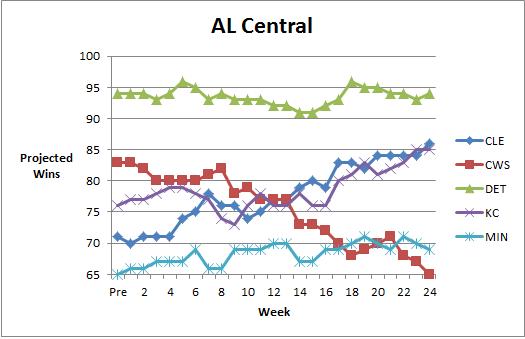
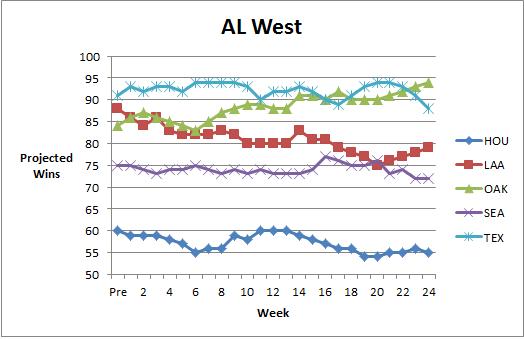
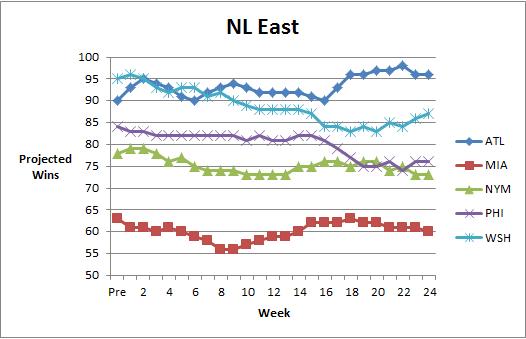
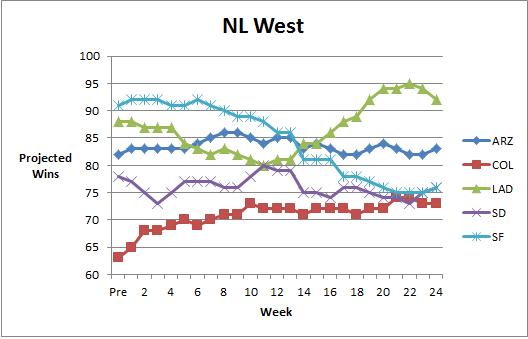
In case you missed it, in April we launched our Dynamic Standings Projection feature on New English D. A full explanation of the methodology can be found here or by clicking the tab at the top of the page. This project seeks to provide a reasoned and cautious approach to updating our beliefs about the baseball future. You can find a summarization of the original projections here. You’ll notice a column on the far right that indicates the difference in projected wins from the preseason prediction. Positive numbers mean teams are now projected to win more games and negative numbers mean a team is now projected to win fewer games. You’ll notice a series of graphs below the standings section that track how the projections have evolved over the course of the year.
This Dynamic Standings Projection is updated through the September 18th games. Note that DSP posts have been moved to Thursday accommodate something that won’t interest you.
| 19-Sep | W | L | PreDiff | |
| BOS | 96 | 66 | 0.593 | 19 |
| TB | 89 | 73 | 0.549 | -2 |
| BAL | 87 | 75 | 0.537 | 5 |
| NYY | 85 | 77 | 0.525 | 0 |
| TOR | 75 | 87 | 0.463 | -12 |
| W | L | PreDiff | ||
| DET | 94 | 68 | 0.580 | 0 |
| CLE | 86 | 76 | 0.531 | 15 |
| KC | 85 | 77 | 0.525 | 9 |
| MIN | 69 | 93 | 0.426 | 4 |
| CWS | 65 | 97 | 0.401 | -18 |
| W | L | PreDiff | ||
| OAK | 94 | 68 | 0.580 | 10 |
| TEX | 88 | 74 | 0.543 | -3 |
| LAA | 79 | 83 | 0.488 | -9 |
| SEA | 72 | 90 | 0.444 | -3 |
| HOU | 55 | 107 | 0.340 | -5 |
| W | L | PreDiff | ||
| ATL | 96 | 66 | 0.593 | 6 |
| WSH | 87 | 75 | 0.537 | -8 |
| PHI | 76 | 86 | 0.469 | -8 |
| NYM | 73 | 89 | 0.451 | -5 |
| MIA | 60 | 102 | 0.370 | -3 |
| W | L | PreDiff | ||
| STL | 94 | 68 | 0.580 | 6 |
| CIN | 92 | 70 | 0.568 | 0 |
| PIT | 92 | 70 | 0.568 | 10 |
| MIL | 73 | 89 | 0.451 | -6 |
| CHC | 67 | 95 | 0.414 | -1 |
| W | L | PreDiff | ||
| LAD | 92 | 70 | 0.568 | 4 |
| ARZ | 83 | 79 | 0.512 | 1 |
| SF | 76 | 86 | 0.469 | -15 |
| SD | 76 | 86 | 0.469 | -2 |
| COL | 73 | 89 | 0.451 | 10 |

How Was The Game? (September 18, 2013)

Not one to put on the highlight tape.
Mariners 8, Tigers 0 (Magic # = 6)
Justin Verlander (32 GS, 206.1 IP, 3.66 ERA, 3.45 FIP, 4.5 WAR) pitched in a lot of traffic during the first three innings of tonight’s game and allowed two runs while doing so, but allowed just one baserunner in the game’s final four innings on a Justin Smoak homerun. It looked like he wasn’t on his game early, but straightened out as the game went on and was cruising at the end. In sum, he allowed 3 runs across 7 innings that included 3 walks and 6 strikeouts. On most nights, that would suffice for the Tigers lineup but they struggled a great deal against Iwakuma despite a couple of bases loaded chances, to say nothing of the extra five runs the bullpen allowed. With two already in the hopper against the Mariners, the Tigers won’t sweat the loss with Doug Fister (30 GS, 193.2 IP, 3.67 ERA. 3.30 FIP, 4.1 WAR) going Thursday afternoon looking to snag the series.
The Moment: FSD shows O-Swing% for the first time in recorded history. Wikipedia citations can refer to the following exchange:
How Was The Game? (September 17, 2013)
A night for the sluggers – Cabrera and Kelly.
Tigers 6, Mariners 2 (Magic # = 6)
Anibal Sanchez (27 GS, 172 IP, 2.51 ERA, 2.49 FIP, 5.7 WAR) continued his Cy Young push tonight with 6.1 innings of 2 run baseball that featured two walks and ten strikeouts. Sanchez was his typical brilliant self and was backed by solo homeruns from Don Kelly and Miguel Cabrera and aided by a sac fly from Torii Hunter that scored Jose Iglesias in the 7th inning to put the Tigers ahead for good before they padded the lead in the 8th. On a night in which the Tigers’ wives were collecting donations for the Tigers Foundation, the Tigers collected their 88th win of the season, tying their 2012 mark with 11 games left to play. They’ll look to lock up the series on Wednesday with Justin Verlander (31 GS, 199.1 IP, 3.66 ERA, 3.41 FIP, 4.5 WAR) looking to remind his manager that he’d like to start game one of a playoff series.
The Moment: Don Kelly puts the Tigers on the board first with a solo shot.
Prince Fielder’s Streaky Season

Prince Fielder isn’t having a great season compared to the bar he’s set for himself. I covered the issues a couple of months ago and chalked it up to a whole host of things. Primarily he wasn’t making as much contact as the previous two seasons and he wasn’t hitting for the same kind of power he had during the seasons prior to that. In other words, as he matured into a more well-rounded hitter he started to rely more on contact and his contact numbers were down. Mix that with some BABIP luck and you’re stuck with a graph that looks like this (From the original post):

Since I wrote the post he had a a rough couple weeks and then snapped out of it. His wRC+ is only up to 126 for the season, but he’s hit a lot better since early August and is putting up the kind of numbers you would expect from him over his last 39 games. Let’s take a look at his season in four parts:
| Date | Games | PA | AVG | OBP | SLG |
| 4/1 – 5/10 | 33 | 154 | 0.298 | 0.422 | 0.573 |
| 5/11 – 6/21 | 39 | 171 | 0.263 | 0.339 | 0.395 |
| 6/22 – 8/6 | 39 | 169 | 0.219 | 0.302 | 0.351 |
| 8/7 – 9/16 | 39 | 170 | 0.344 | 0.400 | 0.539 |
The cutoffs are arbitrary to some extent, but every cutoff is arbitrary if you really think about it. Fielder started hot, slumped, slumped hard, and then caught fire. These are four roughly equal collections.
In the first act, Fielder was excellent as he hit for high average, walked plenty, and hit for power. That’s the Prince Fielder who signed a $200 million contract! Act two is a drop in batting average and a drop in power. Act three is a loss of average but no drop in power. To demonstrate, he are his ISOs from the four acts (ISO = SLG – AVG):
| Date | ISO |
| 4/1 – 5/10 | 0.275 |
| 5/11 – 6/21 | 0.132 |
| 6/22 – 8/6 | 0.132 |
| 8/7 – 9/16 | 0.195 |
You can see quite clearly that when Fielder got a hit in the third act, the odds it was for extra bases was pretty consistent with act two, he just got many fewer hits period. But then his season started to turn around and while he hasn’t recovered his power from April, he’s hitting for more power, and a way higher average since August 7th.
It’s actually kind of remarkable if you separate it out by hard, breaking, and offspeed pitches. Let’s look at batting average and slugging percentage for each.
HARD
| Date | BA | SLG |
| 4/1 – 5/10 | 0.297 | 0.676 |
| 5/11 – 6/21 | 0.225 | 0.348 |
| 6/22 – 8/6 | 0.200 | 0.278 |
| 8/7 – 9/16 | 0.364 | 0.560 |
BREAKING
| Date | BA | SLG |
| 4/1 – 5/10 | 0.353 | 0.500 |
| 5/11 – 6/21 | 0.343 | 0.600 |
| 6/22 – 8/6 | 0.293 | 0.659 |
| 8/7 – 9/16 | 0.349 | 0.698 |
OFFSPEED
| Date | BA | SLG |
| 4/1 – 5/10 | 0.188 | 0.250 |
| 5/11 – 6/21 | 0.296 | 0.296 |
| 6/22 – 8/6 | 0.200 | 0.200 |
| 8/7 – 9/16 | 0.192 | 0.308 |
If the pattern doesn’t jump out to you, allow me to demonstrate. He was still hitting breaking balls well and he was pretty consistent against offspeed pitches. Look at the fastballs, my god, look a the fastballs. His batting average and slugging percentage against fastballs plummeted between act one and two and the average dropped off a little more into act three. Now he’s back in business, but man, that thing cratered.
Fielder couldn’t get around on a fastball to save his life for about 80 games and now he’s doing it again. I’m not going to make any connections between issues he’s having in his personal life and his performance. There could have been an injury or a mechanical adjustment that needed to be worked out. But the evidence is pretty clear and pretty stark.
Prince Fielder couldn’t hit fastballs. He didn’t slump the same way against the other pitches and obviously batters see more fastballs than anything else so it’s going to drive a lot of their performance. There’s certainly a game theory/sequencing thing about what pitches are used when that we can’t really untangle right now, but it certainly appears as if Fielder just went through a period of time – for whatever reason – in which he couldn’t catch up with a fastball. That stretch has been over now for 39 games and 170 PA. He’s crushing the baseball since August 7th and the Tigers are reaping the rewards.
There’s no reason to thing this problem will reoccur, so there’s no reason to thing Fielder won’t continue to mash heading into October. Whatever was going on from May 11th to August 6th is behind him and the guy who cleans up after Miguel Cabrera appears to be back.
How Was The Game? (September 16, 2013)
Another Porcello gem.
Tigers 4, Mariners 2 (Magic # = 8)
The Tigers grabbed an early run and then added on in the 6th inning, which would be plenty for Rick Porcello (28 GS, 168 IP, 4.45 ERA, 3.69 FIP, 2.7 WAR) who was fantastic again across 6 innings at Comerica Park. Porcello allowed a solo homerun and two walks, but was aces otherwise as he struck out 10 and breezed through the rest of the ballgame. The big strikeout total lifts his 2013 K% to 18.5%, which is nearly 5% higher than his previous career high (13.7%) as he makes a run at a career high in WAR (2.7 in 2013, 2.9 career best). The win is the Tigers’ 87th on the season and drops their magic number to 8 with another game against the M’s coming Tuesday as Anibal Sanchez (26 GS, 165.2 IP, 2.50 ERA, 2.47 FIP, 5.5 WAR) takes the hill.
The Moment: Porcello punches out 10, marking his second straight excellent start.
Alex Avila Returns To Form
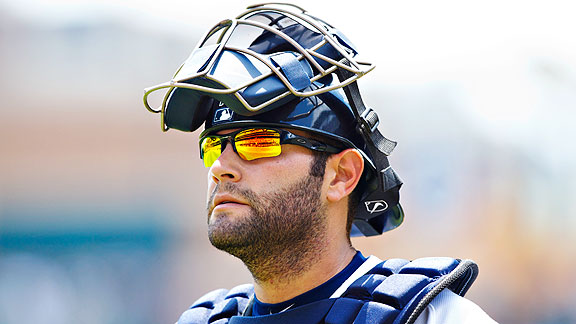
There was a time earlier this year when I advocated sending Alex Avila down to Toledo. He was lost. He was hitting .166/.265/.280. He showed the occasional flash, but it was mostly one of those horrible stretches in which a player is stuck in between and can’t find his way out. But very shortly after that he took one on the wrist and jumped on the DL. It was June 16th and he had a .560 OPS.
But Avila has been himself since the injury and even better if you put the cutoff at the All-Star Game, hitting .284/.360/.485 since the wrist injury and .313/.376/.545 since the break. He’s been the Avila we saw in 2011 as he’s posted a 153 wRC+ since the break compared to 141 wRC+ over all of 2011. It’s probably wrong to think he’s going to be that player consistently, but it’s not wrong to be optimistic that the worst is behind him.
The statistics tell a convincing story. If we drop the cutoff before and after his two week break due to injury or at the ASG, Avila looks much more like the player we thought he would be. Granted, sample sizes can always cloud your vision when it comes to statistics, but the actual swing mechanics have looked so much better ever since he got back. The flashpoint for me was the go-ahead homerun in Cleveland on August 5th where he cleared the high wall in LCF.
I’ve always though Avila was at his best when he took a short path to the ball and drove pitches to left center and he’s doing that again in a big way. Let’s draw the line at the wrist injury which puts about 190 PA on one side and 150 on the other. Neither is huge, but they aren’t way out of proportion.
First the spray charts:
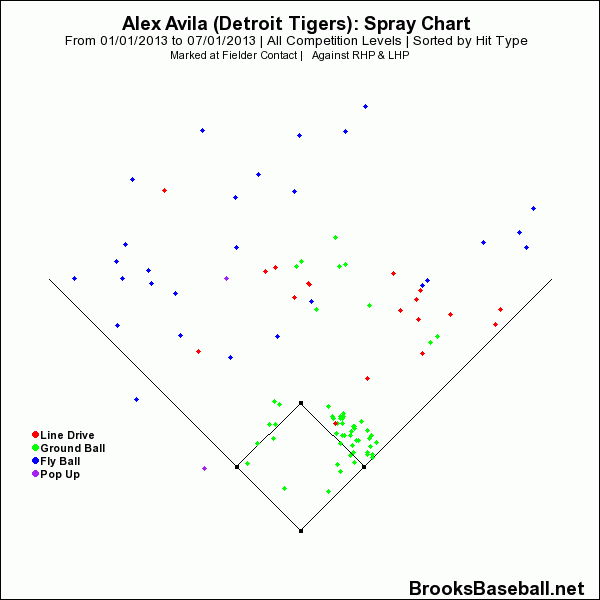

Not only is he less pull happy overall, but when he goes the other way he’s now hitting the ball on a line much more often.
His batting average and slugging percentage are up against almost every type of pitch (only slugging against sinkers is down). Let’s simplify that and take a look at hard, breaking, and offspeed pitches:

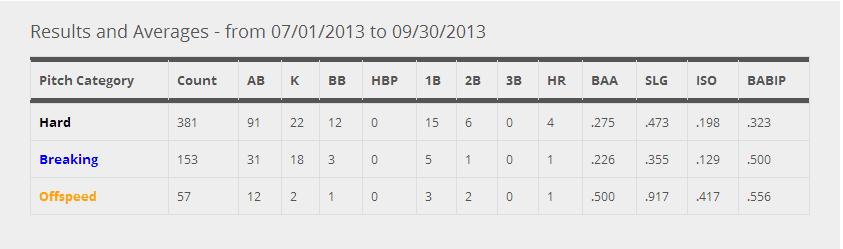
So Avila is driving the ball to the left center field gap and he’s doing much better against breaking balls and offspeed pitches. This probably isn’t surprising information considering how much his numbers have picked up. The swing is a lot shorter to the ball and it’s been a huge improvement. I wish I was adept at GIF-making, because a visual illustration would be great. Below are two screenshots from pitches at nearly identical locations at very similar speeds. He misses the first and hits the second for a game winning homerun. I think you can see the slightly more compact swing in the second, but if you can’t, that’s more my visualization abilities than anything else.
Also, one of Avila’s big problems during the slump was his awful numbers against lefties. Granted, he’s still not tearing it up against southpaws and neither is a big sample, but the comparison is striking. In 26 AB against lefties before the injury he hit .038/.100/.038. In 45 AB since, he’s .222/.314/.378. Add that to his ability to mash righties lately (Since the injury, 315/.384/.539 against RHP) and you’re in business.
He’s improved against lefties and he’s gotten better overall, but you don’t just see it in the numbers. The spray chart tells the same story and the video does as well. It’s all looking up for Avila who has been worth a full win above replacement since the break and has himself up to 90 wRC+ for the season despite the terrible start. It’s not going to be a Silver Slugger year for the Tigers backstop, but ending the season like this is a very good sign for the future. He’s never going to be the most durable player and it’s probably wrong to expect him to be a 5 win player like he was in 2011, but there’s no reason we shouldn’t expect him to be an above average catcher for the next couple of seasons.
The swing is back and he has the number to prove it. And really, if he delivers in October and helps the Tigers win a World Series, is anyone going to care how he hit in May?
How Was The Game? (September 15, 2013)
A feather in Max’s award season cap.
Tigers 3, Royals 2 (Magic # = 9)
When Max Scherzer (30 GS, 201.1 IP, 2.95 ERA, 2.68 FIP, 6.2 WAR) takes the mound you can usually count on the Tigers to score a lot of runs, but on this afternoon that wouldn’t be the case. Despite plenty of chances the Tigers only scored on Alex Avila’s 2 run homer in the second inning and that would be all Max would need (sort of!). Aside from a solo homerun to Gordon he dazzled across 7 innings in which he allowed 5 hits, 1 walk, and struck out 12 Kansas City Royals, including 5 straight at one point. It was vintage Max after he struggled in two of his past three outings and he sent the Tigers on the path to their 86th win of the season that would be interrupted by a run scoring wild pitch in the 8th inning that tied the game at 2 until Avila stepped in to untie it again with a bomb in the 8th. They’ll welcome the Mariners to Comerica Park for the first time this season on Monday with Rick Porcello (27 GS, 162 IP, 4.56 ERA, 3.73 FIP, 2.5 WAR) lined up for game one.
The Moment: Avila blasts a go-ahead homerun in the 8th – his second of the day.
SOEFA Sunday: Reliever Rankings Update (September 15, 2013)
You’ll recall earlier this year we introduced our very own reliever rankings called SOEFA, which you can read about in detail here. For a brief refresher, it combines inherited runner strand rate, expected OBP against, ERA-, and FIP- into a deviation from league average. This is a measure of performance, not necessarily ability, and seeks to provide a single number to judge relievers that balances context neutral and context dependent numbers. Certain pitchers, such as Craig Kimbrel, cannot be credited for stranding runners because they are never put into those situations. They are not penalized either, however. Additionally, SOEFA penalizes pitchers like Joe Nathan and Mariano Rivera who have done a very poor job when they have been asked to strand runners this season despite great numbers in other categories.
Zero is average, and will generally range between -2.5 to 2.5 with -1 to 1 being most common. This includes all pitchers who have thrown at least 20 IP in relief as of this morning, so the average score on this list is closer to 0.10 and the inherited runner threshold has been increased from 5 to 8. SOEFA is a rate stat not a counting stat. Should you wish to know the SOEFA for any other reliever, or on a day that isn’t Sunday, hit us on Twitter or in the comments section. Also, as we look to improve SOEFA for next season, let us know if you have any suggestions!
| Rank | Player | Team | SOEFA |
| 1 | Koji Uehara | Red Sox | 0.95 |
| 2 | Greg Holland | Royals | 0.94 |
| 3 | Kenley Jansen | Dodgers | 0.91 |
| 4 | Neal Cotts | Rangers | 0.89 |
| 5 | Kevin Siegrist | Cardinals | 0.80 |
| 6 | Mark Melancon | Pirates | 0.80 |
| 7 | Drew Smyly | Tigers | 0.78 |
| 8 | Jesse Crain | White Sox | 0.78 |
| 9 | Craig Kimbrel | Braves | 0.77 |
| 10 | Javier Lopez | Giants | 0.77 |
| 11 | Will Smith | Royals | 0.76 |
| 12 | Louis Coleman | Royals | 0.73 |
| 13 | Luke Hochevar | Royals | 0.73 |
| 14 | Joaquin Benoit | Tigers | 0.70 |
| 15 | Sergio Romo | Giants | 0.70 |
| 16 | Chris Withrow | Dodgers | 0.66 |
| 17 | Alex Torres | Rays | 0.65 |
| 18 | Nick Vincent | Padres | 0.64 |
| 19 | Sean Doolittle | Athletics | 0.63 |
| 20 | Sam LeCure | Reds | 0.62 |
| 21 | Edward Mujica | Cardinals | 0.61 |
| 22 | Jose Veras | – – – | 0.61 |
| 23 | Jordan Walden | Braves | 0.59 |
| 24 | Trevor Rosenthal | Cardinals | 0.59 |
| 25 | Tanner Roark | Nationals | 0.57 |
| 26 | Jason Grilli | Pirates | 0.56 |
| 27 | David Huff | – – – | 0.54 |
| 28 | Glen Perkins | Twins | 0.54 |
| 29 | Jim Henderson | Brewers | 0.54 |
| 30 | Paco Rodriguez | Dodgers | 0.54 |
| 31 | Brian Matusz | Orioles | 0.53 |
| 32 | Casey Fien | Twins | 0.52 |
| 33 | Carlos Torres | Mets | 0.51 |
| 34 | Jake Diekman | Phillies | 0.51 |
| 35 | Tommy Hunter | Orioles | 0.51 |
| 36 | Antonio Bastardo | Phillies | 0.50 |
| 37 | Dan Otero | Athletics | 0.50 |
| 38 | Juan Perez | Blue Jays | 0.50 |
| 39 | Josh Collmenter | Diamondbacks | 0.48 |
| 40 | Shawn Kelley | Yankees | 0.48 |
| 41 | Andrew Miller | Red Sox | 0.47 |
| 42 | Brett Cecil | Blue Jays | 0.47 |
| 43 | Jason Frasor | Rangers | 0.47 |
| 44 | Manny Parra | Reds | 0.47 |
| 45 | Randy Choate | Cardinals | 0.46 |
| 46 | Brandon Kintzler | Brewers | 0.45 |
| 47 | Bobby Parnell | Mets | 0.44 |
| 48 | Seth Maness | Cardinals | 0.43 |
| 49 | Chad Qualls | Marlins | 0.42 |
| 50 | J.P. Howell | Dodgers | 0.42 |
| 51 | Junichi Tazawa | Red Sox | 0.42 |
| 52 | Matt Reynolds | Diamondbacks | 0.42 |
| 53 | Jonathan Papelbon | Phillies | 0.41 |
| 54 | Luis Avilan | Braves | 0.41 |
| 55 | Francisco Rodriguez | – – – | 0.40 |
| 56 | Joel Peralta | Rays | 0.40 |
| 57 | Brad Ziegler | Diamondbacks | 0.39 |
| 58 | Steve Cishek | Marlins | 0.39 |
| 59 | Tanner Scheppers | Rangers | 0.39 |
| 60 | Aroldis Chapman | Reds | 0.38 |
| 61 | Donovan Hand | Brewers | 0.38 |
| 62 | Joe Thatcher | – – – | 0.38 |
| 63 | Vin Mazzaro | Pirates | 0.38 |
| 64 | David Carpenter | Braves | 0.37 |
| 65 | Rob Scahill | Rockies | 0.37 |
| 66 | Tony Watson | Pirates | 0.37 |
| 67 | Tyler Clippard | Nationals | 0.37 |
| 68 | Darren O’Day | Orioles | 0.36 |
| 69 | Casey Janssen | Blue Jays | 0.35 |
| 70 | Will Harris | Diamondbacks | 0.35 |
| 71 | Ernesto Frieri | Angels | 0.34 |
| 72 | Joe Smith | Indians | 0.34 |
| 73 | Scott Downs | – – – | 0.34 |
| 74 | Addison Reed | White Sox | 0.32 |
| 75 | Carlos Villanueva | Cubs | 0.32 |
| 76 | Jean Machi | Giants | 0.32 |
| 77 | Josh Outman | Rockies | 0.32 |
| 78 | Nate Jones | White Sox | 0.32 |
| 79 | Ross Ohlendorf | Nationals | 0.32 |
| 80 | Jerome Williams | Angels | 0.31 |
| 81 | Tom Gorzelanny | Brewers | 0.31 |
| 82 | Luke Gregerson | Padres | 0.30 |
| 83 | Neil Wagner | Blue Jays | 0.30 |
| 84 | Santiago Casilla | Giants | 0.30 |
| 85 | Aaron Loup | Blue Jays | 0.29 |
| 86 | Robbie Ross | Rangers | 0.29 |
| 87 | Grant Balfour | Athletics | 0.27 |
| 88 | Jamey Wright | Rays | 0.27 |
| 89 | Luke Putkonen | Tigers | 0.27 |
| 90 | Steve Delabar | Blue Jays | 0.27 |
| 91 | Tim Collins | Royals | 0.27 |
| 92 | Anthony Varvaro | Braves | 0.26 |
| 93 | Caleb Thielbar | Twins | 0.26 |
| 94 | Craig Stammen | Nationals | 0.26 |
| 95 | Jared Burton | Twins | 0.25 |
| 96 | David Robertson | Yankees | 0.24 |
| 97 | Luis Ayala | – – – | 0.24 |
| 98 | Mariano Rivera | Yankees | 0.24 |
| 99 | Boone Logan | Yankees | 0.23 |
| 100 | Matt Belisle | Rockies | 0.23 |
| 101 | Chad Gaudin | Giants | 0.22 |
| 102 | Charlie Furbush | Mariners | 0.22 |
| 103 | Craig Breslow | Red Sox | 0.22 |
| 104 | Dan Jennings | Marlins | 0.22 |
| 105 | Alfredo Simon | Reds | 0.20 |
| 106 | Blake Parker | Cubs | 0.20 |
| 107 | Fernando Rodney | Rays | 0.20 |
| 108 | Mike Dunn | Marlins | 0.20 |
| 109 | Cody Allen | Indians | 0.19 |
| 110 | Danny Farquhar | Mariners | 0.19 |
| 111 | David Purcey | White Sox | 0.19 |
| 112 | Preston Claiborne | Yankees | 0.19 |
| 113 | Rafael Betancourt | Rockies | 0.17 |
| 114 | Anthony Swarzak | Twins | 0.16 |
| 115 | Dale Thayer | Padres | 0.16 |
| 116 | J.C. Gutierrez | – – – | 0.16 |
| 117 | Rex Brothers | Rockies | 0.16 |
| 118 | J.J. Putz | Diamondbacks | 0.15 |
| 119 | Tim Stauffer | Padres | 0.15 |
| 120 | Rafael Soriano | Nationals | 0.14 |
| 121 | Carter Capps | Mariners | 0.13 |
| 122 | Kevin Gregg | Cubs | 0.12 |
| 123 | Sandy Rosario | Giants | 0.12 |
| 124 | Alfredo Figaro | Brewers | 0.11 |
| 125 | Matt Lindstrom | White Sox | 0.11 |
| 126 | Scott Rice | Mets | 0.11 |
| 127 | Bryan Shaw | Indians | 0.10 |
| 128 | Justin Wilson | Pirates | 0.10 |
| 129 | LaTroy Hawkins | Mets | 0.10 |
| 130 | Oliver Perez | Mariners | 0.10 |
| 131 | Adam Ottavino | Rockies | 0.09 |
| 132 | Ryan Cook | Athletics | 0.09 |
| 133 | Andrew Bailey | Red Sox | 0.08 |
| 134 | Brian Duensing | Twins | 0.08 |
| 135 | Brandon Workman | Red Sox | 0.07 |
| 136 | Bruce Rondon | Tigers | 0.07 |
| 137 | Joe Nathan | Rangers | 0.07 |
| 138 | Matt Thornton | – – – | 0.07 |
| 139 | Ryan Webb | Marlins | 0.07 |
| 140 | Wilton Lopez | Rockies | 0.07 |
| 141 | Fernando Abad | Nationals | 0.06 |
| 142 | Heath Bell | Diamondbacks | 0.06 |
| 143 | J.J. Hoover | Reds | 0.06 |
| 144 | Jesse Chavez | Athletics | 0.06 |
| 145 | Joe Kelly | Cardinals | 0.06 |
| 146 | Kelvin Herrera | Royals | 0.06 |
| 147 | Burke Badenhop | Brewers | 0.05 |
| 148 | Gonzalez Germen | Mets | 0.05 |
| 149 | Jim Johnson | Orioles | 0.05 |
| 150 | Yoervis Medina | Mariners | 0.05 |
| 151 | Darren Oliver | Blue Jays | 0.04 |
| 152 | Jeanmar Gomez | Pirates | 0.04 |
| 153 | Tyson Ross | Padres | 0.04 |
| 154 | Dane de la Rosa | Angels | 0.02 |
| 155 | Matt Guerrier | – – – | 0.01 |
| 156 | Michael Kohn | Angels | 0.01 |
| 157 | Ross Wolf | Rangers | 0.00 |
| 158 | Josh Edgin | Mets | -0.01 |
| 159 | Ronald Belisario | Dodgers | -0.01 |
| 160 | Edgmer Escalona | Rockies | -0.02 |
| 161 | Huston Street | Padres | -0.02 |
| 162 | Manuel Corpas | Rockies | -0.02 |
| 163 | Kevin Jepsen | Angels | -0.03 |
| 164 | Jerry Blevins | Athletics | -0.04 |
| 165 | Pat Neshek | Athletics | -0.04 |
| 166 | Ryan Pressly | Twins | -0.04 |
| 167 | Jake McGee | Rays | -0.05 |
| 168 | Tyler Thornburg | Brewers | -0.05 |
| 169 | Dustin McGowan | Blue Jays | -0.06 |
| 170 | Logan Ondrusek | Reds | -0.06 |
| 171 | James Russell | Cubs | -0.07 |
| 172 | Chris Perez | Indians | -0.08 |
| 173 | David Aardsma | Mets | -0.08 |
| 174 | Rob Wooten | Brewers | -0.09 |
| 175 | Tom Wilhelmsen | Mariners | -0.10 |
| 176 | Darin Downs | Tigers | -0.12 |
| 177 | Joe Ortiz | Rangers | -0.12 |
| 178 | Marc Rzepczynski | – – – | -0.12 |
| 179 | Matt Albers | Indians | -0.12 |
| 180 | Jared Hughes | Pirates | -0.13 |
| 181 | Josh Fields | Astros | -0.13 |
| 182 | Tony Sipp | Diamondbacks | -0.13 |
| 183 | Troy Patton | Orioles | -0.13 |
| 184 | Aaron Crow | Royals | -0.14 |
| 185 | Cesar Ramos | Rays | -0.14 |
| 186 | Wesley Wright | – – – | -0.14 |
| 187 | Drew Storen | Nationals | -0.15 |
| 188 | Josh Zeid | Astros | -0.15 |
| 189 | Kyle Farnsworth | – – – | -0.15 |
| 190 | Nick Hagadone | Indians | -0.16 |
| 191 | Phil Coke | Tigers | -0.16 |
| 192 | Brad Brach | Padres | -0.18 |
| 193 | Fernando Salas | Cardinals | -0.18 |
| 194 | Zach Duke | – – – | -0.18 |
| 195 | Cory Gearrin | Braves | -0.19 |
| 196 | Donnie Veal | White Sox | -0.19 |
| 197 | Raul Valdes | Phillies | -0.19 |
| 198 | A.J. Ramos | Marlins | -0.20 |
| 199 | Jake Dunning | Giants | -0.20 |
| 200 | Ramon Troncoso | White Sox | -0.20 |
| 201 | Evan Scribner | Athletics | -0.21 |
| 202 | George Kontos | Giants | -0.21 |
| 203 | Jose Mijares | Giants | -0.21 |
| 204 | Bryan Morris | Pirates | -0.22 |
| 205 | David Hernandez | Diamondbacks | -0.22 |
| 206 | Pedro Strop | – – – | -0.23 |
| 207 | Rich Hill | Indians | -0.23 |
| 208 | Jonathan Broxton | Reds | -0.24 |
| 209 | Blake Beavan | Mariners | -0.26 |
| 210 | Mike Adams | Phillies | -0.26 |
| 211 | Josh Roenicke | Twins | -0.27 |
| 212 | Vinnie Pestano | Indians | -0.27 |
| 213 | Brad Lincoln | Blue Jays | -0.30 |
| 214 | Justin De Fratus | Phillies | -0.30 |
| 215 | Lucas Luetge | Mariners | -0.30 |
| 216 | Garrett Richards | Angels | -0.31 |
| 217 | Michael Bowden | Cubs | -0.33 |
| 218 | T.J. McFarland | Orioles | -0.33 |
| 219 | Al Alburquerque | Tigers | -0.35 |
| 220 | John Axford | – – – | -0.35 |
| 221 | Scott Atchison | Mets | -0.36 |
| 222 | Adam Warren | Yankees | -0.37 |
| 223 | Dylan Axelrod | White Sox | -0.37 |
| 224 | Paul Clemens | Astros | -0.37 |
| 225 | Ryan Mattheus | Nationals | -0.39 |
| 226 | Travis Blackley | – – – | -0.40 |
| 227 | Clayton Mortensen | Red Sox | -0.41 |
| 228 | Esmil Rogers | Blue Jays | -0.42 |
| 229 | Alex Wilson | Red Sox | -0.45 |
| 230 | Brandon Lyon | Mets | -0.48 |
| 231 | Carlos Marmol | – – – | -0.49 |
| 232 | Greg Burke | Mets | -0.49 |
| 233 | Joba Chamberlain | Yankees | -0.49 |
| 234 | Michael Gonzalez | Brewers | -0.49 |
| 235 | Brandon Maurer | Mariners | -0.50 |
| 236 | Bruce Chen | Royals | -0.54 |
| 237 | Jose Cisnero | Astros | -0.58 |
| 238 | Jeremy Horst | Phillies | -0.59 |
| 239 | Dallas Keuchel | Astros | -0.63 |
| 240 | Hector Ambriz | Astros | -0.63 |
| 241 | Ian Krol | Nationals | -0.67 |
| 242 | Jeremy Affeldt | Giants | -0.67 |
| 243 | Hector Rondon | Cubs | -0.71 |
| 244 | Henry Rodriguez | – – – | -0.71 |
| 245 | Michael Kirkman | Rangers | -0.74 |
| 246 | Lucas Harrell | Astros | -0.81 |
| 247 | Luis Garcia | Phillies | -0.83 |
| 248 | Anthony Bass | Padres | -0.87 |
| 249 | Brandon League | Dodgers | -0.93 |
| 250 | Shawn Camp | Cubs | -1.03 |
| 251 | Curtis Partch | Reds | -1.42 |
Jim Leyland and Knowing When To Break Your Rules
I’ve long since come to terms with the fact that Jim Leyland is not a very good on-field tactician. He routinely misuses his relievers and bunts at weird times. On Saturday night, he made a very critical mistake that cost his team a chance to win. It wasn’t a mistake because of the result, it was a mistake because of the process. Let’s walk through it.
The Tigers entered the 9th inning down 1-0 with Greg Holland on the mound. Prince Fielder led off the inning with a walk. The tying run is on first base in the 9th inning and it’s Prince Fielder who is a below average runner. I love Prince, but he’s not a good baserunner. I know that, you know that, he probably knows that, and his manager knows that.
But Leyland didn’t pinch run. Martinez flied out and Dirks struck out to set up Infante. Prince Fielder stood on first while Hernan Perez and Danny Worth stood on the bench. Infante doubled and Prince was gunned down by a great relay by a step or two. The difference in this game was Leyland failing to run for Fielder. It’s obvious to see that this decision was costly, but it was a mistake long before it actually came to fruition.
Here’s the logic behind the mistake. First, Leyland has long said he won’t run for Fielder or (healthy) Cabrera. The basic premise is right. You shouldn’t pull your best hitters for pinch runners in most situations because the potential value of their later at bats is very high. However, this situation is the exact situation in which you must run for your slugger.
Down one in the 9th inning at home, you have to score at least once or you lose the game. That run is everything. You have to do everything you can to score that run and you worry about what might happen later, later. You have to maximize your odds of winning and you do that by putting the much faster Perez on first base. Whether or not Infante gets the hit doesn’t matter, it’s the right decision 10 times out of 10.
If it was a tie game, you leave Fielder in because you know you’re getting another at bat, but down a run you have to pinch run. The problem here isn’t this particular mistake it’s that an MLB manager should be ready for this situation. He’s clearly thought about the merits of pinch running for Fielder, but somehow he didn’t come to the conclusion that there is a single, glaring exception to the rule. You pinch run if that run is the difference between playing on and the game ending.
Leyland’s response to the postgame question was that he doesn’t pinch run for Fielder. (Note: I will update if one of the reporters posts more detailed comments,but so far I haven’t seen him display regret). The absolute nature of that statement is very concerning because while that rule is right most of the time, it isn’t right in this particular situation. Leyland should have been prepared for this. We aren’t talking about him deciding he liked a particular pinch hitter matchup that might involve intuition. This is pure, rational logic. There isn’t a case to be made for not pinch running, especially once we got to two outs and the chance at the two run inning was much smaller.
I don’t know how to properly weigh tactical skills and leadership skills in managerial evaluation, but this kind of mistake isn’t acceptable. And this isn’t the only mistake he’s made this year because he’s unwilling to break his rules. On multiple occasions he’s refused to go to Benoit in a tie game on the road because it wasn’t a save situation and the Tigers have been worse off for it.
The Tigers are still going to make the playoffs, but two weeks from now, the value of individual games is going to sky rocket and Jim Leyland’s poor decisions are going to be much more costly. Maybe his personal skills in the clubhouse make up for it, but that doesn’t excuse it. This isn’t a personal criticism. I have loads of affection for Leyland, but he needs to be better prepared for these situations or the Tigers are going to be disadvantaged in October. The occasional mistake is easy to overlook, but this is a pattern and it doesn’t appear as if he understands where he went wrong.
It’s not his fault the Tigers didn’t score in the first 8 innings, but when he was a given a chance to help the team win, he didn’t do it. Managers don’t often have a chance to make a big difference and you can’t let those opportunities slip away because you don’t know when to break the rules.
Updated 10:40pm: Via Matthew Mowery, Leyland had this to say:
“I’m not taking Prince Fielder out of the game. I’m not going to do it. It’s just the way it is. I’m not going to run for him….That’s the way I do it.”
So, that confirms that he doesn’t see the issue and the bad outcome tonight did not cause him to reflect on why this situation calls for him to break his rule.
How Was The Game? (September 14, 2013)
Brisk, but without success.
Royals 1, Tigers 0 (Magic # = 10)
To no one’s surprise, Doug Fister (30 GS, 193.2 IP, 3.67 ERA, 3.30 FIP, 4.2 WAR) and Ervin Santana hooked up for a pitchers’ duel tonight featuring very little offense and a pretty quick pace. Fister allowed a run on two hits in the first but was stingy the rest of the way giving the Tigers 7.2 innings of 1 run baseball featuring 6 K an 3 BB. The Tigers bats couldn’t do much against Santana and his pen despite an Infante double with a man on first in the 9th. The Tigers failed to score, however, as Leyland elected not to run for Fielder – who was on first – and it was the difference in the game as he was thrown out at home by about a step – a step that a pinch runner would have had on Fielder. It’s hard to quantify the effect managers have on games, but this was a clear time in which Leyland is squarely to blame. It makes sense not to lose Fielder in a tie game in the 9th or any time earlier, but if you don’t score the tying run in the 9th, the game ends. You have to pinch run. It’s bad strategy, pure and simple, and it’s a situation an MLB manager should be ready for from the first day of the season. Especially with expanded rosters. The Tigers will look to take the series Sunday afternoon with Max Scherzer (29 GS, 194.1 IP, 3.01 ERA, 2.71 FIP, 5.9 WAR) on the hill.
The Moment: Hunter guns down Getz at third in the 7th inning.
