SOEFA Sunday: Reliever Rankings Update (September 8, 2013)

You’ll recall earlier this year we introduced our very own reliever rankings called SOEFA, which you can read about in detail here. For a brief refresher, it combines inherited runner strand rate, expected OBP against, ERA-, and FIP- into a deviation from league average. This is a measure of performance, not necessarily ability, and seeks to provide a single number to judge relievers that balances context neutral and context dependent numbers. Certain pitchers, such as Craig Kimbrel, cannot be credited for stranding runners because they are never put into those situations. They are not penalized either, however. Additionally, SOEFA penalizes pitchers like Joe Nathan and Mariano Rivera who have done a very poor job when they have been asked to strand runners this season despite great numbers in other categories.
Zero is average, and will generally range between -2.5 to 2.5 with -1 to 1 being most common. This includes all pitchers who have thrown at least 20 IP in relief as of this morning, so the average score on this list is closer to 0.10 and the inherited runner threshold has been increased from 5 to 8. SOEFA is a rate stat not a counting stat. Should you wish to know the SOEFA for any other reliever, or on a day that isn’t Sunday, hit us on Twitter or in the comments section. Also, as we look to improve SOEFA for next season, let us know if you have any suggestions!
| Rank | Player | Team | SOEFA |
| 1 | Neal Cotts | Rangers | 1.01 |
| 2 | Kenley Jansen | Dodgers | 0.93 |
| 3 | Greg Holland | Royals | 0.92 |
| 4 | Koji Uehara | Red Sox | 0.90 |
| 5 | Kevin Siegrist | Cardinals | 0.87 |
| 6 | Mark Melancon | Pirates | 0.81 |
| 7 | Craig Kimbrel | Braves | 0.79 |
| 8 | Javier Lopez | Giants | 0.78 |
| 9 | Jesse Crain | White Sox | 0.78 |
| 10 | Drew Smyly | Tigers | 0.75 |
| 11 | Will Smith | Royals | 0.71 |
| 12 | Sergio Romo | Giants | 0.70 |
| 13 | Jordan Walden | Braves | 0.70 |
| 14 | Louis Coleman | Royals | 0.70 |
| 15 | Chris Withrow | Dodgers | 0.69 |
| 16 | Jason Grilli | Pirates | 0.67 |
| 17 | Luke Hochevar | Royals | 0.67 |
| 18 | Nick Vincent | Padres | 0.67 |
| 19 | Edward Mujica | Cardinals | 0.66 |
| 20 | Alex Torres | Rays | 0.65 |
| 21 | Sam LeCure | Reds | 0.64 |
| 22 | Joaquin Benoit | Tigers | 0.62 |
| 23 | Sean Doolittle | Athletics | 0.59 |
| 24 | Trevor Rosenthal | Cardinals | 0.58 |
| 25 | Tanner Roark | Nationals | 0.57 |
| 26 | Jim Henderson | Brewers | 0.56 |
| 27 | Brandon Kintzler | Brewers | 0.54 |
| 28 | Brian Matusz | Orioles | 0.54 |
| 29 | Paco Rodriguez | Dodgers | 0.54 |
| 30 | Josh Collmenter | Diamondbacks | 0.52 |
| 31 | Jason Frasor | Rangers | 0.52 |
| 32 | Glen Perkins | Twins | 0.52 |
| 33 | Carlos Torres | Mets | 0.51 |
| 34 | Juan Perez | Blue Jays | 0.50 |
| 35 | Antonio Bastardo | Phillies | 0.50 |
| 36 | Casey Fien | Twins | 0.48 |
| 37 | Aroldis Chapman | Reds | 0.47 |
| 38 | Dan Otero | Athletics | 0.47 |
| 39 | Tommy Hunter | Orioles | 0.47 |
| 40 | Shawn Kelley | Yankees | 0.47 |
| 41 | Andrew Miller | Red Sox | 0.47 |
| 42 | Joel Peralta | Rays | 0.46 |
| 43 | Jake Diekman | Phillies | 0.45 |
| 44 | Manny Parra | Reds | 0.45 |
| 45 | Brett Cecil | Blue Jays | 0.45 |
| 46 | Bobby Parnell | Mets | 0.44 |
| 47 | Will Harris | Diamondbacks | 0.43 |
| 48 | Randy Choate | Cardinals | 0.43 |
| 49 | Seth Maness | Cardinals | 0.43 |
| 50 | Matt Reynolds | Diamondbacks | 0.42 |
| 51 | Vin Mazzaro | Pirates | 0.42 |
| 52 | Junichi Tazawa | Red Sox | 0.41 |
| 53 | Joe Thatcher | – – – | 0.41 |
| 54 | Donovan Hand | Brewers | 0.41 |
| 55 | Francisco Rodriguez | – – – | 0.40 |
| 56 | Chad Qualls | Marlins | 0.40 |
| 57 | Luis Avilan | Braves | 0.40 |
| 58 | Jonathan Papelbon | Phillies | 0.40 |
| 59 | Steve Delabar | Blue Jays | 0.39 |
| 60 | Brad Ziegler | Diamondbacks | 0.38 |
| 61 | Scott Downs | – – – | 0.37 |
| 62 | Josh Outman | Rockies | 0.37 |
| 63 | Addison Reed | White Sox | 0.36 |
| 64 | Darren O’Day | Orioles | 0.36 |
| 65 | David Carpenter | Braves | 0.36 |
| 66 | Steve Cishek | Marlins | 0.35 |
| 67 | Preston Claiborne | Yankees | 0.35 |
| 68 | Tanner Scheppers | Rangers | 0.35 |
| 69 | J.P. Howell | Dodgers | 0.35 |
| 70 | Jean Machi | Giants | 0.34 |
| 71 | Tony Watson | Pirates | 0.33 |
| 72 | Ross Ohlendorf | Nationals | 0.33 |
| 73 | Ernesto Frieri | Angels | 0.33 |
| 74 | Robbie Ross | Rangers | 0.33 |
| 75 | Santiago Casilla | Giants | 0.33 |
| 76 | Ryan Cook | Athletics | 0.32 |
| 77 | Jerome Williams | Angels | 0.31 |
| 78 | Tom Gorzelanny | Brewers | 0.31 |
| 79 | Tyler Clippard | Nationals | 0.31 |
| 80 | Casey Janssen | Blue Jays | 0.31 |
| 81 | David Robertson | Yankees | 0.30 |
| 82 | Craig Breslow | Red Sox | 0.29 |
| 83 | Nate Jones | White Sox | 0.28 |
| 84 | Tim Collins | Royals | 0.27 |
| 85 | Danny Farquhar | Mariners | 0.27 |
| 86 | Grant Balfour | Athletics | 0.27 |
| 87 | Mariano Rivera | Yankees | 0.27 |
| 88 | Cody Allen | Indians | 0.27 |
| 89 | Joe Smith | Indians | 0.26 |
| 90 | Carlos Villanueva | Cubs | 0.26 |
| 91 | Jeanmar Gomez | Pirates | 0.26 |
| 92 | Aaron Loup | Blue Jays | 0.26 |
| 93 | Matt Belisle | Rockies | 0.25 |
| 94 | Anthony Varvaro | Braves | 0.25 |
| 95 | Neil Wagner | Blue Jays | 0.25 |
| 96 | Boone Logan | Yankees | 0.23 |
| 97 | Jared Burton | Twins | 0.22 |
| 98 | Craig Stammen | Nationals | 0.22 |
| 99 | Chad Gaudin | Giants | 0.22 |
| 100 | Jamey Wright | Rays | 0.22 |
| 101 | Luke Gregerson | Padres | 0.21 |
| 102 | Charlie Furbush | Mariners | 0.21 |
| 103 | Luis Ayala | – – – | 0.20 |
| 104 | Brian Duensing | Twins | 0.20 |
| 105 | Jose Veras | – – – | 0.19 |
| 106 | Blake Parker | Cubs | 0.18 |
| 107 | Rafael Betancourt | Rockies | 0.17 |
| 108 | Carter Capps | Mariners | 0.17 |
| 109 | Caleb Thielbar | Twins | 0.17 |
| 110 | Luke Putkonen | Tigers | 0.17 |
| 111 | Wilton Lopez | Rockies | 0.17 |
| 112 | Alfredo Simon | Reds | 0.17 |
| 113 | Dan Jennings | Marlins | 0.16 |
| 114 | Oliver Perez | Mariners | 0.16 |
| 115 | Fernando Rodney | Rays | 0.16 |
| 116 | Rex Brothers | Rockies | 0.16 |
| 117 | Mike Dunn | Marlins | 0.15 |
| 118 | Tim Stauffer | Padres | 0.15 |
| 119 | J.J. Putz | Diamondbacks | 0.15 |
| 120 | Alfredo Figaro | Brewers | 0.14 |
| 121 | Dale Thayer | Padres | 0.13 |
| 122 | Anthony Swarzak | Twins | 0.13 |
| 123 | Yoervis Medina | Mariners | 0.12 |
| 124 | Scott Rice | Mets | 0.11 |
| 125 | Jesse Chavez | Athletics | 0.11 |
| 126 | Matt Lindstrom | White Sox | 0.11 |
| 127 | Kevin Gregg | Cubs | 0.11 |
| 128 | Bryan Shaw | Indians | 0.10 |
| 129 | Rafael Soriano | Nationals | 0.10 |
| 130 | J.J. Hoover | Reds | 0.10 |
| 131 | Sandy Rosario | Giants | 0.09 |
| 132 | Justin Wilson | Pirates | 0.08 |
| 133 | Andrew Bailey | Red Sox | 0.08 |
| 134 | Ross Wolf | Rangers | 0.07 |
| 135 | Kelvin Herrera | Royals | 0.07 |
| 136 | Bruce Rondon | Tigers | 0.07 |
| 137 | J.C. Gutierrez | – – – | 0.07 |
| 138 | Joe Nathan | Rangers | 0.07 |
| 139 | Joe Kelly | Cardinals | 0.06 |
| 140 | Adam Ottavino | Rockies | 0.06 |
| 141 | James Russell | Cubs | 0.06 |
| 142 | Ryan Webb | Marlins | 0.06 |
| 143 | Heath Bell | Diamondbacks | 0.05 |
| 144 | Michael Kohn | Angels | 0.05 |
| 145 | Tyson Ross | Padres | 0.04 |
| 146 | Jim Johnson | Orioles | 0.04 |
| 147 | Matt Thornton | – – – | 0.04 |
| 148 | Manuel Corpas | Rockies | 0.04 |
| 149 | LaTroy Hawkins | Mets | 0.03 |
| 150 | Darren Oliver | Blue Jays | 0.03 |
| 151 | Fernando Abad | Nationals | 0.02 |
| 152 | Matt Guerrier | – – – | 0.01 |
| 153 | Josh Edgin | Mets | 0.00 |
| 154 | Edgmer Escalona | Rockies | -0.01 |
| 155 | Kevin Jepsen | Angels | -0.03 |
| 156 | Joe Ortiz | Rangers | -0.03 |
| 157 | Pat Neshek | Athletics | -0.03 |
| 158 | Ryan Pressly | Twins | -0.03 |
| 159 | Gonzalez Germen | Mets | -0.03 |
| 160 | Dane de la Rosa | Angels | -0.04 |
| 161 | Burke Badenhop | Brewers | -0.04 |
| 162 | Ronald Belisario | Dodgers | -0.04 |
| 163 | Chris Perez | Indians | -0.04 |
| 164 | Rob Scahill | Rockies | -0.05 |
| 165 | Tyler Thornburg | Brewers | -0.05 |
| 166 | Tony Sipp | Diamondbacks | -0.05 |
| 167 | Huston Street | Padres | -0.06 |
| 168 | David Aardsma | Mets | -0.07 |
| 169 | Jerry Blevins | Athletics | -0.09 |
| 170 | Logan Ondrusek | Reds | -0.10 |
| 171 | Darin Downs | Tigers | -0.11 |
| 172 | Jared Hughes | Pirates | -0.12 |
| 173 | Troy Patton | Orioles | -0.13 |
| 174 | Phil Coke | Tigers | -0.14 |
| 175 | Josh Fields | Astros | -0.14 |
| 176 | Josh Roenicke | Twins | -0.14 |
| 177 | Jake McGee | Rays | -0.14 |
| 178 | Aaron Crow | Royals | -0.14 |
| 179 | Fernando Salas | Cardinals | -0.16 |
| 180 | Tom Wilhelmsen | Mariners | -0.16 |
| 181 | Cesar Ramos | Rays | -0.17 |
| 182 | Rich Hill | Indians | -0.17 |
| 183 | Drew Storen | Nationals | -0.18 |
| 184 | Wesley Wright | – – – | -0.18 |
| 185 | Jose Mijares | Giants | -0.18 |
| 186 | Raul Valdes | Phillies | -0.19 |
| 187 | Cory Gearrin | Braves | -0.19 |
| 188 | Matt Albers | Indians | -0.19 |
| 189 | Ramon Troncoso | White Sox | -0.19 |
| 190 | Jake Dunning | Giants | -0.20 |
| 191 | Brad Brach | Padres | -0.20 |
| 192 | Nick Hagadone | Indians | -0.21 |
| 193 | Jonathan Broxton | Reds | -0.23 |
| 194 | Bryan Morris | Pirates | -0.24 |
| 195 | Mike Adams | Phillies | -0.26 |
| 196 | Blake Beavan | Mariners | -0.26 |
| 197 | Kyle Farnsworth | – – – | -0.26 |
| 198 | A.J. Ramos | Marlins | -0.26 |
| 199 | Evan Scribner | Athletics | -0.27 |
| 200 | Lucas Luetge | Mariners | -0.27 |
| 201 | Pedro Strop | – – – | -0.27 |
| 202 | David Hernandez | Diamondbacks | -0.29 |
| 203 | Vinnie Pestano | Indians | -0.30 |
| 204 | Greg Burke | Mets | -0.30 |
| 205 | Brad Lincoln | Blue Jays | -0.30 |
| 206 | Garrett Richards | Angels | -0.30 |
| 207 | George Kontos | Giants | -0.31 |
| 208 | Justin De Fratus | Phillies | -0.31 |
| 209 | Marc Rzepczynski | – – – | -0.32 |
| 210 | Donnie Veal | White Sox | -0.32 |
| 211 | Michael Bowden | Cubs | -0.33 |
| 212 | Zach Duke | – – – | -0.33 |
| 213 | Paul Clemens | Astros | -0.36 |
| 214 | T.J. McFarland | Orioles | -0.36 |
| 215 | Michael Gonzalez | Brewers | -0.37 |
| 216 | Adam Warren | Yankees | -0.38 |
| 217 | Clayton Mortensen | Red Sox | -0.41 |
| 218 | Esmil Rogers | Blue Jays | -0.42 |
| 219 | John Axford | – – – | -0.42 |
| 220 | Al Alburquerque | Tigers | -0.43 |
| 221 | Travis Blackley | Astros | -0.44 |
| 222 | Alex Wilson | Red Sox | -0.45 |
| 223 | Scott Atchison | Mets | -0.46 |
| 224 | Joba Chamberlain | Yankees | -0.48 |
| 225 | Brandon Lyon | Mets | -0.48 |
| 226 | Brandon Maurer | Mariners | -0.51 |
| 227 | Ryan Mattheus | Nationals | -0.53 |
| 228 | Bruce Chen | Royals | -0.54 |
| 229 | Carlos Marmol | – – – | -0.58 |
| 230 | Jose Cisnero | Astros | -0.58 |
| 231 | Jeremy Horst | Phillies | -0.59 |
| 232 | Hector Ambriz | Astros | -0.62 |
| 233 | Ian Krol | Nationals | -0.63 |
| 234 | Dallas Keuchel | Astros | -0.63 |
| 235 | Jeremy Affeldt | Giants | -0.64 |
| 236 | Henry Rodriguez | – – – | -0.70 |
| 237 | Michael Kirkman | Rangers | -0.74 |
| 238 | Hector Rondon | Cubs | -0.74 |
| 239 | Lucas Harrell | Astros | -0.80 |
| 240 | Luis Garcia | Phillies | -0.87 |
| 241 | Brandon League | Dodgers | -0.88 |
| 242 | Anthony Bass | Padres | -0.88 |
| 243 | Shawn Camp | Cubs | -1.03 |
How Was The Game? (September 7, 2013)
Badly timed.
Royals 4, Tigers 3
It looked as if the Tigers were going to wear out the Royals on this night, but after only cashing in once in the first they allowed the Royals to get back into the game. Justin Verlander (30 GS, 192.2 IP, 3.64 ERA, 3.49 FIP, 4.1 WAR) did good work for the majority of the game and made just one very critical mistake to Sal Perez in the bottom of the sixth that ended up in the left field seats. Verlander’s secondary pitches were good and he had plenty of velocity, touching 99 and averaging 96 across 7 innings of 4 run baseball that featured 7 K and 1 BB. The Tigers had some chances but only added single runs in the 5th and 7th to fall shot of the comeback. The Tigers will give the ball to Doug Fister (28 GS, 179.2 IP, 3.66 ERA, 3.27 FIP, 4.0 WAR) on Sunday looking to take the series.
The Moment: Nick Castellanos gets his first big league hit on a dribbler to second.
The Nine Pitchers Who Give Up The Most Unearned Runs
Something I’ve always found interesting is that pitchers get to deduct unearned runs from their ERA but they don’t get to deduct runs from their ERA when their defense doesn’t make an easy play that they should have. In the past, I’ve highlighted more advanced ways to demonstrate to measure a pitcher’s value that factors out defense like FIP, xFIP, and others and I’ve also pointed out why this distinction between ERA and Runs Allowed/9 is a little bit arbitrary.
Below, for no other reason than to think about something we almost never think about, are the pitchers who have allowed the most unearned runs in 2013 and the pitchers who have allowed the highest percentage of their runs in an unearned run fashion (min 50 IP).
| Rank | Name | Team | UER | UER% | ERA | IP | R | ER |
| 9 | Stephen Strasburg | Nationals | 10 | 16.13% | 2.85 | 164 | 62 | 52 |
| 8 | Hector Santiago | White Sox | 10 | 16.39% | 3.43 | 133.2 | 61 | 51 |
| 7 | Justin Verlander | Tigers | 10 | 11.90% | 3.59 | 185.2 | 84 | 74 |
| 6 | Ryan Dempster | Red Sox | 10 | 10.64% | 4.79 | 157.2 | 94 | 84 |
| 5 | Lucas Harrell | Astros | 11 | 11.22% | 5.69 | 137.2 | 98 | 87 |
| 4 | C.J. Wilson | Angels | 12 | 14.63% | 3.42 | 184 | 82 | 70 |
| 3 | Jeremy Hefner | Mets | 12 | 16.00% | 4.34 | 130.2 | 75 | 63 |
| 2 | Edwin Jackson | Cubs | 13 | 13.27% | 4.91 | 155.2 | 98 | 85 |
| 1 | Wily Peralta | Brewers | 17 | 17.00% | 4.51 | 165.2 | 100 | 83 |
| Rank | Name | Team | UER | UER% | ERA | IP | R | ER |
| 9 | Rex Brothers | Rockies | 3 | 20.00% | 1.81 | 59.2 | 15 | 12 |
| 8 | Charlie Furbush | Mariners | 5 | 20.00% | 3.16 | 57 | 25 | 20 |
| 7 | Stephen Fife | Dodgers | 4 | 21.05% | 2.55 | 53 | 19 | 15 |
| 6 | Tanner Scheppers | Rangers | 4 | 22.22% | 2.04 | 61.2 | 18 | 14 |
| 5 | Taylor Jordan | Nationals | 6 | 22.22% | 3.66 | 51.2 | 27 | 21 |
| 4 | Burke Badenhop | Brewers | 7 | 22.58% | 3.62 | 59.2 | 31 | 24 |
| 3 | Charlie Morton | Pirates | 9 | 23.08% | 3.00 | 90 | 39 | 30 |
| 2 | Craig Breslow | Red Sox | 4 | 25.00% | 2.12 | 51 | 16 | 12 |
| 1 | Bobby Parnell | Mets | 5 | 29.41% | 2.16 | 50 | 17 | 12 |
I think it’s important to think about this because we all agree that a pitcher isn’t responsible for every run he allows, but he also isn’t without blame for all of them either. Earned and unearned runs are the traditional line we draw, but there is nothing that meaningful about such a boundary. These runs count against the team and plenty of unearned runs aren’t the pitcher’s fault.
Food for thought.
How Was The Game? (September 6, 2013)
A meaningful response.
Tigers 16, Royals 2
Just two days after absorbing a 16 run defeat at the hands of the Red Sox, the Tigers turned around and took their frustration out on the Royals in a big way. Anibal Sanchez (25 GS, 159 IP, 2.60 ERA, 2.47 FIP, 5.3 WAR) was quite good, but didn’t really have to be, finishing with 7 innings of 1 run baseball and 5 Ks and 1 BB. He touched 97 and breezed through while his offense made the Royals wish they hadn’t gotten out of bed in the morning. They got 5 in the 2nd, 5 in the 4th, 3 in the 5th, 2 in the 7th, and 1 in the 9th to finish this one early and often. Jackson, Fielder, and Avila had 3 hits. Hunter and Martinez had 2. Dirks had 5. Infante had 5. It was hard to keep track. Everyone was hitting. A lot. And this wasn’t death by a million paper cuts, it was good, solid contact that erased the terrible damage they did to their run differential on Wednesday. Despite the dominance, it counts for just one game in the standings, locking in the Tigers 82nd win and setting them up to take the series with Justin Verlander (29 GS, 185.2 IP, 3.59 ERA, 3.49 FIP, 3.9 WAR) taking the hill.
The Moment: The TIgers score 16 runs. How can you choose just one?
Which Relievers Should The Tigers Take To October?
With just three weeks and change standing between the Tigers and postseason baseball for the third straight October, it’s time to start thinking about using the home stretch to make some tough choices. Specifically, the Tigers need to address Jhonny Peralta’s status with the club and which relievers are coming and which relievers are staying home. I’ll leave the Peralta question for another day and tackle the relievers right now.
Let’s start with some basic assumptions. The Tigers are going to carry 11 pitchers and 5 will be the members of their starting rotation, even if one or more of them will pitch out of the bullpen. So that leaves us with 6 slots.
The No Brainers
Joaquin Benoit, Jose Veras, Drew Smyly, and Bruce Rondon are all locks barring a serious injury or some sort of terrible meltdown.
| Name | G | IP | K/9 | BB/9 | HR/9 | ERA | FIP | xFIP | WAR |
| Drew Smyly | 53 | 69 | 9.26 | 1.96 | 0.52 | 2.22 | 2.43 | 3.04 | 1.5 |
| Joaquin Benoit | 55 | 55 | 9.82 | 3.11 | 0.65 | 2.13 | 2.89 | 3.23 | 1.1 |
| Jose Veras* | 58 | 58.1 | 8.18 | 3.09 | 0.93 | 2.93 | 3.74 | 3.99 | 0.6 |
| Bruce Rondon | 29 | 27.2 | 8.78 | 3.58 | 0.65 | 3.58 | 3.22 | 3.43 | 0.3 |
*with both the Tigers and Astros in 2013
Using New English D’s own propriety metric, SOEFA, each of these four grade out as above average relievers for the season with Benoit and Smyly being among the best dozen in the game as of last Sunday.
| Player | SOEFA |
| Joaquin Benoit | 0.79 |
| Drew Smyly | 0.76 |
| Jose Veras | 0.15 |
| Bruce Rondon | 0.02 |
The Question Marks
We know whomever the Tigers call on has to currently be in the organization and we also know that Octavio Dotel is likely out for the season. That leaves the Tigers with 7 relievers who saw big league action this year. These numbers are in relief and as Tigers.
| Name | G | IP | K/9 | BB/9 | HR/9 | ERA | FIP | xFIP | WAR |
| Darin Downs | 26 | 33 | 10.09 | 2.73 | 1.09 | 5.18 | 3.46 | 3.31 | 0.3 |
| Phil Coke | 45 | 36.2 | 7.36 | 3.93 | 0.74 | 4.91 | 3.78 | 4.14 | 0.2 |
| Luke Putkonen | 23 | 23.1 | 8.10 | 2.70 | 1.16 | 2.70 | 3.81 | 3.62 | 0.1 |
| Evan Reed | 13 | 19.1 | 6.52 | 1.86 | 0.93 | 3.72 | 3.56 | 3.50 | 0.1 |
| Al Alburquerque | 44 | 40.1 | 13.17 | 6.92 | 1.12 | 5.58 | 4.18 | 3.59 | 0.0 |
| Jose Alvarez | 3 | 4 | 2.25 | 0.00 | 2.25 | 15.75 | 5.79 | 5.30 | -0.1 |
| Jeremy Bonderman | 10 | 15.1 | 8.22 | 5.87 | 1.76 | 5.28 | 5.71 | 4.61 | -0.2 |
Downs pitched well for the Tigers earlier this year before struggling and then missing time with a shoulder injury. He wasn’t added to the roster when the limit went from 25 to 40, which signals that the Tigers don’t plan to use him in October. That could change, but it’s possible too that he hasn’t fully recovered from his injury. If Downs is healthy, he’d be an obvious choice for me as he did excellent work until the last couple outings before going on the DL and has an excellent strikeout rate and no serious platoon issues.
Coke struggled with command this season and has become a LOOGY for the most part since returning from Toledo. Last month, I looked into his struggles and didn’t find anything stuff or health related to worry about. Coke seems like an obvious choice if Downs isn’t an option because the Tigers are going to want to carry at least 2 lefties.
Jose Alvarez won’t be needed for his length and it’s hard to think he’s a better LOOGY than Coke at this point. He’s a touch and feel guy who can give you innings, which isn’t that valuable in the postseason.
Luke Putkonen has a solid fastball and some pretty good numbers to match working in long relief (for the most part) this year as he bounced up and down as necessary. Putkonen would be a good fit in principle, but with Porcello likely heading to the bullpen for the playoffs, the value of a guy who can offer length is somewhat diminished. Putkonen is certainly a candidate, but it’s a tough call.
Evan Reed hasn’t spent much time in the show this year, but he’s done solid work during his stints with the big club. There isn’t much to go on with Reed, but he doesn’t really seem to have anything that distinguishes him from Putkonen in terms of what he could bring to the roster.
Jeremy Bonderman is an interesting one because the overall results haven’t been great this year, but he’s show the ability to come in and slam the door at times this year. September will be key for evaluating Bonderman because I’m not sure if he’s capable of being a shutdown middle reliever or not. That might have been a flash in the pan, but I always thought his stuff would play up in the pen.
Al Alburquerque is going to be the key. His strikeout rate is nuts and if you need a big strikeout he’s a guy you want to be able to call upon. But he’s also extremely wild and might walk in the key run as well. He’s been hit hard lately and the overall results package hasn’t been great. He has a high payoff potential, but you’re also scared to use him to some extent with too much on the line. He might punish hitters with his slider or he might get creamed.
Which leaves us with a tough choice. It’s hard to imagine Coke, who had so much success last October and remains the best LOOGY option, doesn’t get invited to the dance. Unless he lays a big egg in the final days, he’s going to join the four-headed monster – even if I would prefer a healthy Downs.
The last righty is a tough one because of the different dynamic in October. If you need length in the pen, you’re going to use Porcello because you don’t need a guy who “saves the pen,” you need a guy who holds the lead at all costs. So a swingman, mop up type isn’t what you need. If Al-Al in the zone, he’d be in for sure, but he isn’t and a guy like Putkonen could be a safe option. He’s not going to come in and get you a big K the way Al-Al could, but you have Rondon for that and you don’t have to worry about holding back in October. The marathon is over and it’s time to sprint.
It’s tough, but I think you have to try it with Alburquerque. He’s a high risk, high reward pick but he brings a skill to the table that Putkonen, Reed, and Bonderman don’t. Presumably, with all of the off days in October and the finish line in sight, you can pitch with a short pen if Al-Al loses it and can’t be trusted. But if he hits one of his grooves, the benefits will be huge.
Should We Worry About Smyly?

Drew Smyly has had a fantastic year out of the Tigers bullpen. That’s hard to argue. He’s thrown 69 innings, turned in a 2.22 ERA and 2.43 FIP (what’s FIP?) to go along with a 1.5 WAR (what’s WAR?). He has struck out 26% of opposing hitters and walked just 5.5%. He’s been otherworldly against lefties and pretty good against righties. In fact, until August, he was dominating righties as well.
In August, Smyly had a rough go of it. It was only 8 innings and 35 batters, but it wasn’t good. It was the equivalent of one or two really bad starts, but for a reliever it looks worse. But even after that rough August, our own reliever metric, SOEFA, still likes him as the 11th best reliever in the game this year. So let’s take a look at his monthly splits and see if there is anything we should worry about going into October:
| Split | IP | ERA | AVG | OBP | SLG | wOBA |
| Mar/Apr | 18 | 1.50 | 0.188 | 0.246 | 0.250 | 0.226 |
| May | 14.2 | 3.07 | 0.214 | 0.267 | 0.321 | 0.263 |
| Jun | 16.1 | 2.20 | 0.203 | 0.281 | 0.310 | 0.260 |
| Jul | 12 | 0.00 | 0.159 | 0.159 | 0.159 | 0.141 |
| Aug | 8 | 5.63 | 0.353 | 0.371 | 0.735 | 0.471 |
So while it is only 8 innings, the ERA is way up, the average is way up, the OBP is way up, the slugging is way up, and the wOBA is way up. Hitters did a lot better in August.
| Split | K% | BB% | BABIP | FIP | xFIP |
| Mar/Apr | 29.00% | 7.30% | 0.273 | 1.65 | 2.95 |
| May | 23.30% | 6.70% | 0.268 | 2.83 | 3.36 |
| Jun | 26.20% | 7.70% | 0.286 | 2.06 | 3.24 |
| Jul | 31.80% | 0.00% | 0.233 | 0.71 | 1.97 |
| Aug | 17.10% | 2.90% | 0.360 | 6.79 | 3.81 |
Smyly struck out fewer batters in August, but he also walked almost no one. You’ll notice a much higher BABIP and a clear spike in FIP. His xFIP (what’s xFIP?) goes up as well, but not nearly as much, which tells you that homeruns were likely a bit of an issue in August.
| Split | HR/9 |
| Mar/Apr | 0.00 |
| May | 0.61 |
| Jun | 0.00 |
| Jul | 0.00 |
| Aug | 3.38 |
Smyly gave up three big longballs in August after allowing just one all season long prior to that. That’s going to drive bad results over 8 innings. This is a small sample, clearly, but the exercise is useful in pointing out that Smyly hasn’t performed well lately. Is this cause for concern?
Using Brooks Baseball’s Pitch F/X data on his fourseam fastball, we observe this pattern in game to game average velo:

The average climbed until his 30th or so appearance and has been working its way down a bit since then, but there is a lot of fluctuation. There is a trend over the last dozen appearances, but not really as much over the whole season. The movement, which is a little harder to show graphically isn’t quite as crisp as his best days, but it’s not dramatically different. His release point is drifting very marginally toward the center of the plate, but again, not in a big way.
It just looks like he threw a bad pitch to Konerko and Moss and Salvador Perez hit a good one. That’s really the difference between a good month and a bad one for a reliever who only saw 8 innings. If there are signs of fatigue or an injury, they aren’t big, dramatic, and clear signs.
This doesn’t look like anything to worry about. Some are concerned about his workload based on his never having pitch out of the pen like this, but he threw 100 MLB innings last season and isn’t getting anywhere close to that in 2013 and is still 700 pitches or so behind the number he threw last year.
This appears to be a blip on the radar for Smyly who continues to be having a great season overall. Leyland appears to watching him closely and has gone five days without using him at this point. I’m not sure if that’s a good strategy or not. I think I would want him to get more regular reps down the stretch, but it’s possible he’s tiring a bit and Leyland knows something we don’t. Either way, nothing I’m seeing concerns me very much about Smyly and I expect he’ll be one of the best relievers in baseball the rest of the way.
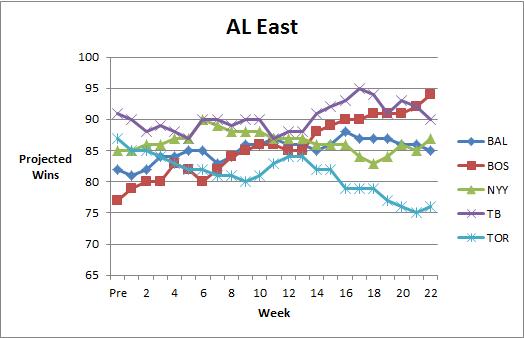
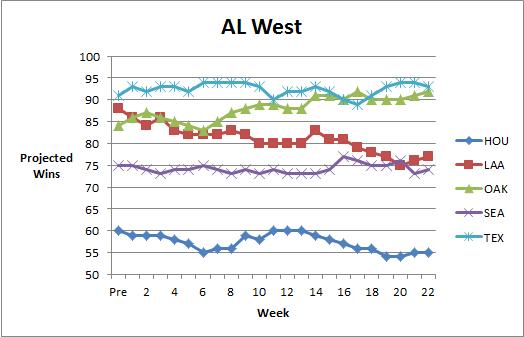
Dynamic Standings Projection (September 5, 2013)
In case you missed it, in April we launched our Dynamic Standings Projection feature on New English D. A full explanation of the methodology can be found here or by clicking the tab at the top of the page. This project seeks to provide a reasoned and cautious approach to updating our beliefs about the baseball future. You can find a summarization of the original projections here. You’ll notice a column on the far right that indicates the difference in projected wins from the preseason prediction. Positive numbers mean teams are now projected to win more games and negative numbers mean a team is now projected to win fewer games. You’ll notice a series of graphs below the standings section that track how the projections have evolved over the course of the year.
This Dynamic Standings Projection is updated through the September 4th games. Note that DSP posts have been moved to Thursday accommodate something that won’t interest you.
| 5-Sep | W | L | PreDiff | |
| BOS | 94 | 68 | 0.580 | 17 |
| TB | 90 | 72 | 0.556 | -1 |
| NYY | 87 | 75 | 0.537 | 2 |
| BAL | 85 | 77 | 0.525 | 3 |
| TOR | 76 | 86 | 0.469 | -11 |
| W | L | PreDiff | ||
| DET | 94 | 68 | 0.580 | 0 |
| CLE | 84 | 78 | 0.519 | 13 |
| KC | 83 | 79 | 0.512 | 7 |
| MIN | 71 | 91 | 0.438 | 6 |
| CWS | 68 | 94 | 0.420 | -15 |
| W | L | PreDiff | ||
| TEX | 93 | 69 | 0.574 | 2 |
| OAK | 92 | 70 | 0.568 | 8 |
| LAA | 77 | 85 | 0.475 | -11 |
| SEA | 74 | 88 | 0.457 | -1 |
| HOU | 55 | 107 | 0.340 | -5 |
| W | L | PreDiff | ||
| ATL | 98 | 64 | 0.605 | 8 |
| WSH | 84 | 78 | 0.519 | -11 |
| NYM | 75 | 87 | 0.463 | -3 |
| PHI | 74 | 88 | 0.457 | -10 |
| MIA | 61 | 101 | 0.377 | -2 |
| W | L | PreDiff | ||
| PIT | 93 | 69 | 0.574 | 11 |
| STL | 92 | 70 | 0.568 | 4 |
| CIN | 90 | 72 | 0.556 | -2 |
| MIL | 71 | 91 | 0.438 | -8 |
| CHC | 69 | 93 | 0.426 | 1 |
| W | L | PreDiff | ||
| LAD | 95 | 67 | 0.586 | 7 |
| ARZ | 82 | 80 | 0.506 | 0 |
| SF | 75 | 87 | 0.463 | -16 |
| COL | 74 | 88 | 0.457 | -4 |
| SD | 73 | 89 | 0.451 | 10 |


How Was The Game? (September 4, 2013)
One you’ll want to forget.
Red Sox 20, Tigers 4
Things were strange at Fenway on this night as Rick Porcello (26 GS, 153 IP, 4.76 ERA, 3.80 FIP, 2.2 WAR) made some very good pitches during parts of the game and got smoked on other occasions. He allowed 3 HR and then left the bases loaded for Alburquerque to unload, pushing Porcello to 5 IP and 8 ER, but can at least take some (?) comfort in the fact that he did throw some nasty curves early in this one. The bats did a decent job scoring early, but it’s hard to match 20 runs (twelve of which came after Porcello left). Not a whole lot you can do about this one, other than to forget it and get ready for Kansas City on Friday with Anibal Sanchez (24, 151.1 IP, 2.68 ERA, 2.50 FIP, 5.0 WAR) taking the ball.
The Moment: Mario Impemba calls two innings from a cell phone as the FSD’s microphones go down.
How Was The Game? (September 3, 2013)
The wrong side of a duel.
Red Sox 2, Tigers 1
Max Scherzer (28 GS, 190.1 IP, 2.88 ERA, 2.72 FIP, 5.7 WAR) gave the Tigers 7+ strong innings of 2 run baseball in which he walked 3 and struck out 8 Red Sox, but his team was unable to gather the necessary offense to carry them to victory. Leyland made some strange bullpen choices in the 8th, going to Coke and Putkonen, but no damage was done. However, when you only score one run – on an Iglesias double in the second – it’s unlikely that you’re going to win. The Tigers will have a chance to take the series Wednesday night with Rick Porcello (25 GS, 148 IP, 4.44 ERA, 3.52 FIP, 2.6 WAR) taking the ball.
The Moment: Iglesias drives one in against his former club.
Could We Assign “Wins” Differently?
If you’ve been here before, or someone like Brian Kenny tweeted a link to this post, you know that we are big proponents of the #KillTheWin movement. We don’t like wins and losses as a pitching statistic for many reasons. You can pitch well and not get a win, you can pitch terribly and get a win, wins don’t even out, and wins are extremely misleading. Put simply, wins are dependent on things that pitchers can’t control and it’s silly to measure them based on something their teammates do. Here are links to all of our formative #KillTheWin work:
- You Can Pitch Great and Not Win
- You Can Pitch Poorly and Win
- Wins Don’t Even Out Over Long Careers
- Wins Mislead You When Comparing Players
- Assorted Facts About Wins from 2013
- Dissecting the Case in Support of Wins
But today I’d like to address a solution that a lot of people are calling for. You see, the old guard won’t let go of the wins and losses concept and language. They can’t accept things like FIP, xFIP, and WAR, or even K%, BB%, GB%. Even ERA is doesn’t satisfy their longing for the “W.” So I’d like to propose a simple idea that simply changes the methodology for awarding wins and losses. Currently, a starter has to pitch at least 5 innings, leave with a lead, and not watch the bullpen surrender that lead. If we invented wins and losses today, no doubt we wouldn’t use such a silly rule.
So let’s use a better one. If there is an appetite for Wins and Losses, why don’t we actually tie wins and losses to performance? Here are two basic proposals that do that while solving a couple of key issues with wins.
The first problem with wins and losses is that it depends on how much and when your team scores. So what we want is something that only measures the impact of the pitcher on the game. Another problem with wins and losses is that the no-decision essentially erases everything you did on a given day. If a pitcher throws 7 shutout innings and gets a no decision, that game shows up in every single one of his stats except wins and losses. We want to judge every start a pitcher makes, not just one in which the right conditions are met by his offense and bullpen.
To partially resolve this issue, let’s turn to the 2013 Tigers as an example. Instead of wins and losses as determined by the current rule, what if we allocate them by Win Probability Added (WPA) or Run Expectancy 24 (RE24)? Those two stats are a bit complicated to calculate, but extremely easy to understand. WPA reflects the percentage by which a player improved his team’s chances of winning. It is very context dependent, but you can still earn positive values even when your team is losing. RE24 is a similar statistic except it doesn’t pay attention to the score of the game and just reflects how many runs above or below average you are contributing. Think of it this way, in a 10-0 game a solo homerun has a pretty low WPA because the game is already decided, but it has the same RE24 in a 10-0 as it does in a 2-0 game. Both allow for the addition of value in a context dependent sense, but both also allow a player to add value even when his team is not. Both of these stats are readily available on FanGraphs and Baseball-Reference.
Below I present the 2013 Tigers with WPA and RE24 “wins.” If a pitcher has a positive WPA or RE24 for a single game they get a win. If it’s negative, they get a loss. No no-decisions and no concern about how the game actually ended. Did the pitcher improve his team’s chances of winning a single game? That’s what wins and losses should tell us, so let’s try this.
There are obvious weakness to this approach, namely that I’m not addressing by how much a pitcher helped his team, but to answer that question, we have season long numbers that are more important. This approach is meant to give people who want to see wins and losses a better reflection of true value.
| Pitcher | Starts | W-L | WPA W-L | RE24 W-L |
| Fister | 28 | 12-7 | 18-10 | 19-9 |
| Sanchez | 24 | 12-7 | 16-8 | 17-7 |
| Scherzer | 27 | 19-1 | 22-5 | 22-5 |
| Verlander | 29 | 12-10 | 17-12 | 18-11 |
| Porcello | 26 | 11-7 | 15-11 | 16-10 |
You will notice a couple of things. You’ll notice that Scherzer’s no-decisions are primarily the function of his team bailing him out and Fister, Sanchez, and Verlander’s are almost all a case of the Tigers not providing enough run support. Porcello’s are divided pretty evenly. This is interesting because it shows that even on individual teams, wins/losses/no decisions are handed out irregularly despite the same contingent of position players.
For the die-hard #KillTheWin-er, this approach is still too context dependent and derived from an illogical attempt to hand wins and losses to a single player. But for a more traditional observer, hopefully this is compelling. Even if you like wins and losses, surely you can appreciate that the actual way in which wins and losses are assigned is arbitrary and foolish. Why is 5 innings the cutoff? Why do you not get a win if you pitch 8 shutout innings and your team wins in a walkoff? Why should you get a win if you allow 6 runs? Even if you want to track day to day contribution, at least track it in a way that reflects what the player you’re judging actually did.
Now I’m not sure if this is the best way, but this is definitely an improvement over wins and losses as currently defined. The current stat makes no contribution to analysis, this one makes some contribution. I’d still rather pay attention to season long numbers, but if we’re going to judge a player in each individual game, let’s at least do it right.
