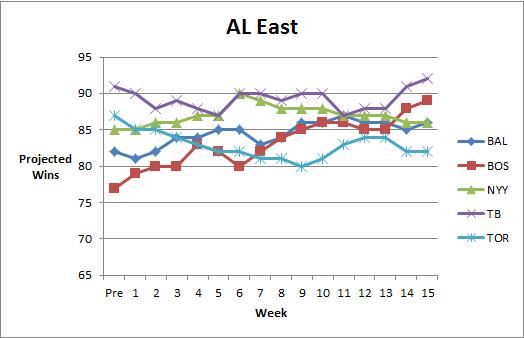
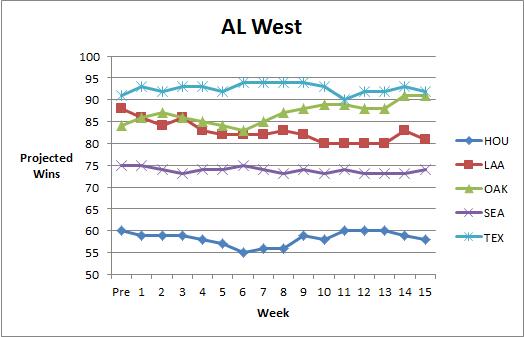
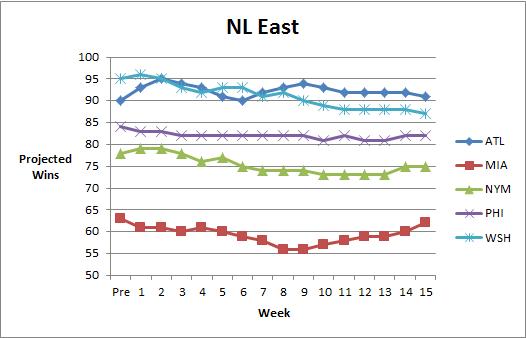
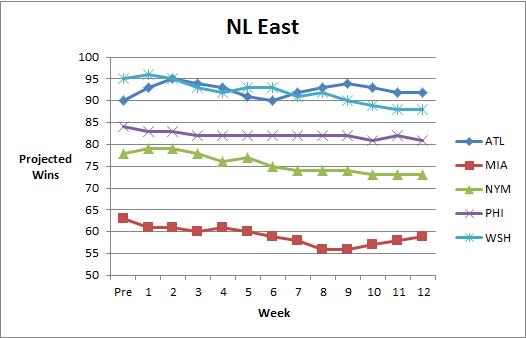
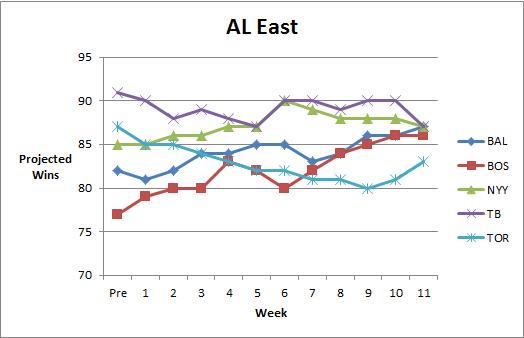
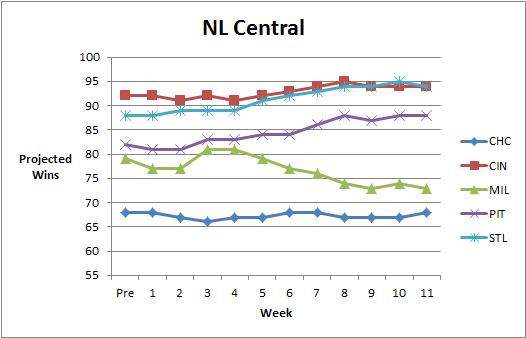
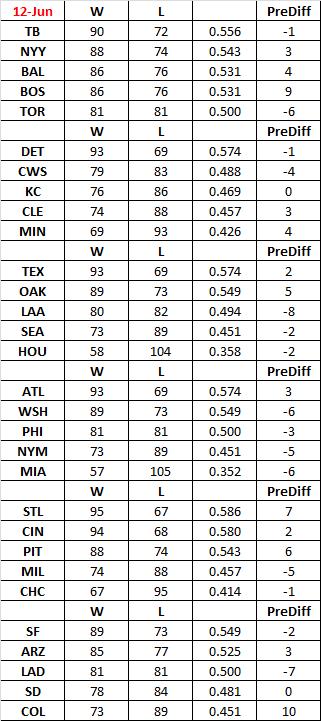
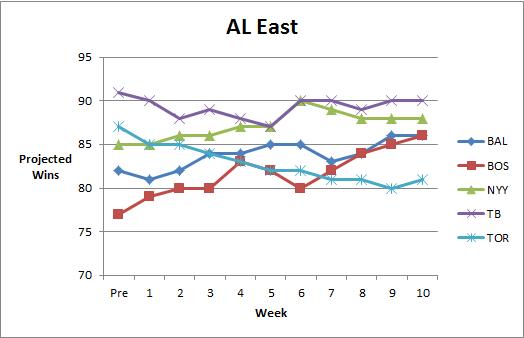
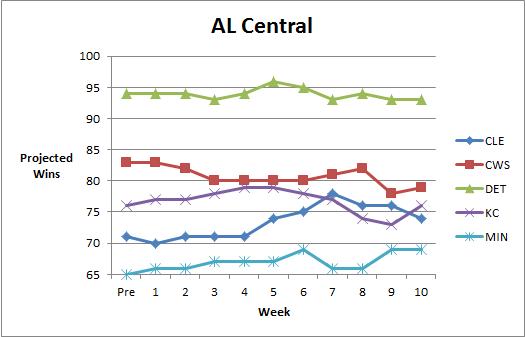
Dynamic Standings Projection (July 17, 2013)
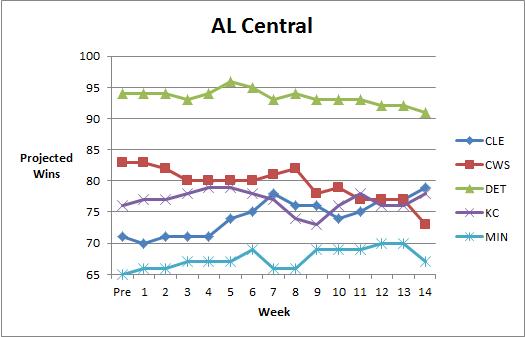
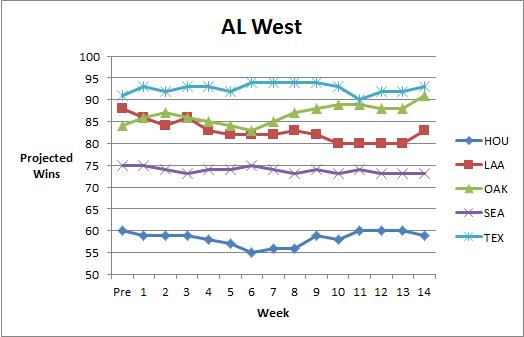
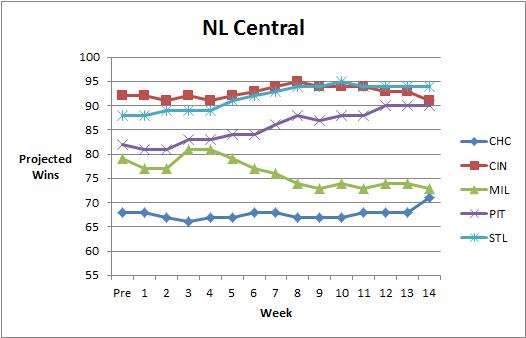
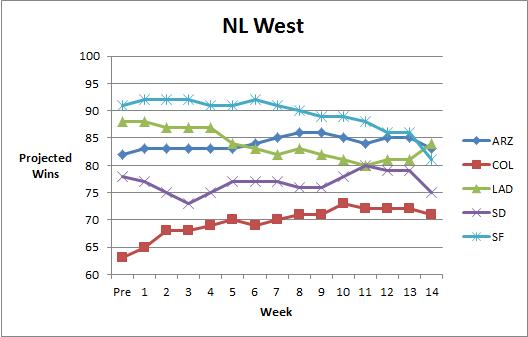
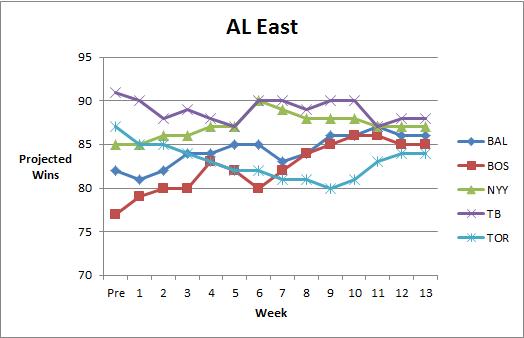
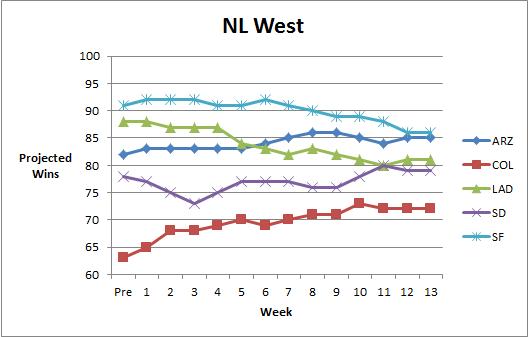
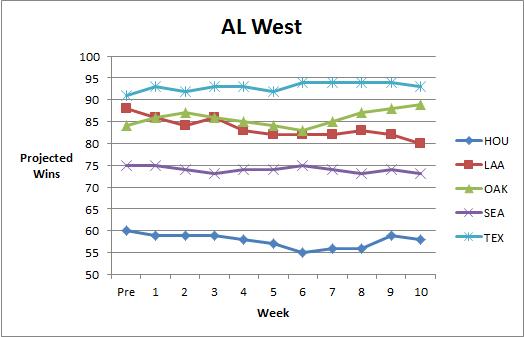
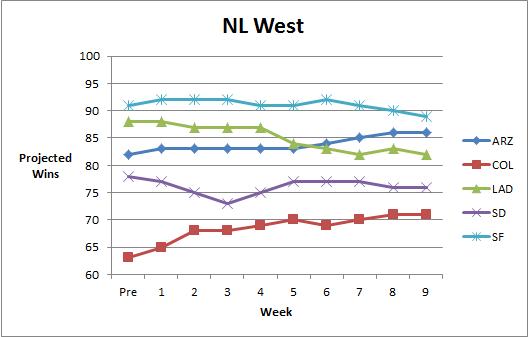
In case you missed it, in April we launched our Dynamic Standings Projection feature on New English D. A full explanation of the methodology can be found here or by clicking the tab at the top of the page. This project seeks to provide a reasoned and cautious approach to updating our beliefs about the baseball future. You can find a summarization of the original projections here. You’ll notice a column on the far right that indicates the difference in projected wins from the preseason prediction. Positive numbers mean teams are now projected to win more games and negative numbers mean a team is now projected to win fewer games. You’ll notice a series of graphs below the standings section that track how the projections have evolved over the course of the year.
This Dynamic Standings Projection is updated through the All-Star break.
| 17-Jul | W | L | PreDiff | |
| TB | 92 | 70 | 0.568 | 1 |
| BOS | 89 | 73 | 0.549 | 12 |
| NYY | 86 | 76 | 0.531 | 1 |
| BAL | 86 | 76 | 0.531 | 4 |
| TOR | 82 | 80 | 0.506 | -5 |
| W | L | PreDiff | ||
| DET | 91 | 71 | 0.562 | -3 |
| CLE | 80 | 82 | 0.494 | 9 |
| KC | 76 | 86 | 0.469 | 0 |
| CWS | 73 | 89 | 0.451 | -10 |
| MIN | 67 | 95 | 0.414 | 2 |
| W | L | PreDiff | ||
| TEX | 92 | 70 | 0.568 | 1 |
| OAK | 91 | 71 | 0.562 | 7 |
| LAA | 81 | 81 | 0.500 | -7 |
| SEA | 74 | 88 | 0.457 | -1 |
| HOU | 58 | 104 | 0.358 | -2 |
| W | L | PreDiff | ||
| ATL | 91 | 71 | 0.562 | 1 |
| WSH | 87 | 75 | 0.537 | -8 |
| PHI | 82 | 80 | 0.506 | -2 |
| NYM | 75 | 87 | 0.463 | -3 |
| MIA | 62 | 100 | 0.383 | -1 |
| W | L | PreDiff | ||
| STL | 94 | 68 | 0.580 | 6 |
| CIN | 91 | 71 | 0.562 | -1 |
| PIT | 91 | 71 | 0.562 | 9 |
| MIL | 71 | 91 | 0.438 | -8 |
| CHC | 71 | 91 | 0.438 | 3 |
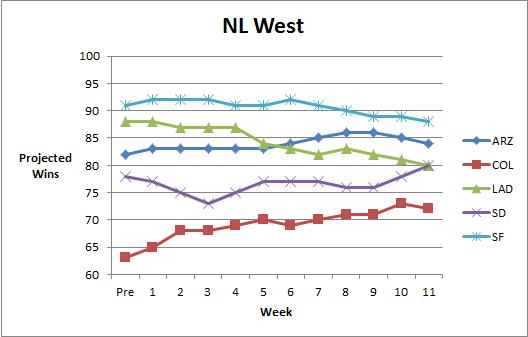
| W | L | PreDiff | ||
| LAD | 84 | 78 | 0.519 | -4 |
| ARZ | 84 | 78 | 0.519 | 2 |
| SF | 81 | 81 | 0.500 | -10 |
| SD | 75 | 87 | 0.463 | -3 |
| COL | 72 | 90 | 0.444 | 9 |


Dynamic Standings Projection (July 10, 2013)
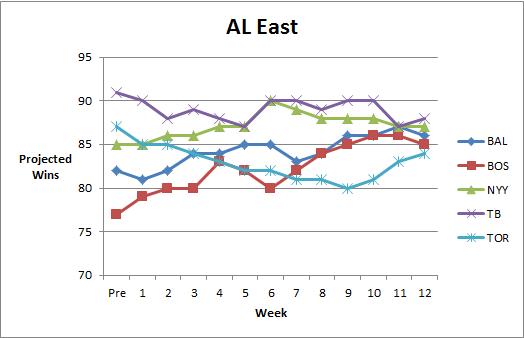
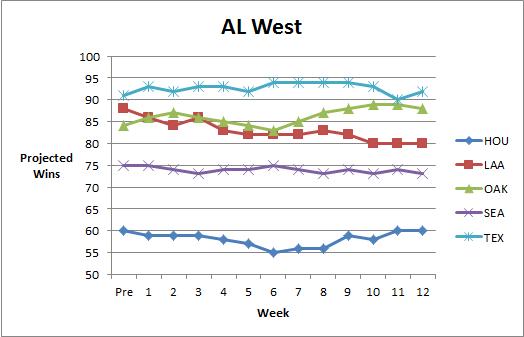
In case you missed it, in April we launched our Dynamic Standings Projection feature on New English D. A full explanation of the methodology can be found here or by clicking the tab at the top of the page. This project seeks to provide a reasoned and cautious approach to updating our beliefs about the baseball future. You can find a summarization of the original projections here. You’ll notice a column on the far right that indicates the difference in projected wins from the preseason prediction. Positive numbers mean teams are now projected to win more games and negative numbers mean a team is now projected to win fewer games. You’ll notice a series of graphs below the standings section that track how the projections have evolved over the course of the year.
This Dynamic Standings Projection is updated through the July 9 games.
| 10-Jul | W | L | PreDiff | |
| TB | 91 | 71 | 0.562 | 0 |
| BOS | 88 | 74 | 0.543 | 11 |
| NYY | 86 | 76 | 0.531 | 1 |
| BAL | 85 | 77 | 0.525 | 3 |
| TOR | 82 | 80 | 0.506 | -5 |
| W | L | PreDiff | ||
| DET | 91 | 71 | 0.562 | -3 |
| CLE | 79 | 83 | 0.488 | 8 |
| KC | 78 | 84 | 0.481 | 2 |
| CWS | 73 | 89 | 0.451 | -10 |
| MIN | 67 | 95 | 0.414 | 2 |
| W | L | PreDiff | ||
| TEX | 93 | 69 | 0.574 | 2 |
| OAK | 91 | 71 | 0.562 | 7 |
| LAA | 83 | 79 | 0.512 | -5 |
| SEA | 73 | 89 | 0.451 | -2 |
| HOU | 59 | 103 | 0.364 | -1 |
| W | L | PreDiff | ||
| ATL | 92 | 70 | 0.568 | 2 |
| WSH | 88 | 74 | 0.543 | -7 |
| PHI | 82 | 80 | 0.506 | -2 |
| NYM | 75 | 87 | 0.463 | -3 |
| MIA | 60 | 102 | 0.370 | -3 |
| W | L | PreDiff | ||
| STL | 94 | 68 | 0.580 | 6 |
| CIN | 91 | 71 | 0.562 | -1 |
| PIT | 90 | 72 | 0.556 | 8 |
| MIL | 73 | 89 | 0.451 | -6 |
| CHC | 71 | 91 | 0.438 | 3 |
| W | L | PreDiff | ||
| LAD | 84 | 78 | 0.519 | -4 |
| ARZ | 83 | 79 | 0.512 | 1 |
| SF | 81 | 81 | 0.500 | -10 |
| SD | 75 | 87 | 0.463 | -3 |
| COL | 71 | 91 | 0.438 | 8 |


Dynamic Standings Projection (July 3, 2013)
In case you missed it, in April we launched our Dynamic Standings Projection feature on New English D. A full explanation of the methodology can be found here or by clicking the tab at the top of the page. This project seeks to provide a reasoned and cautious approach to updating our beliefs about the baseball future. You can find a summarization of the original projections here. You’ll notice a column on the far right that indicates the difference in projected wins from the preseason prediction. Positive numbers mean teams are now projected to win more games and negative numbers mean a team is now projected to win fewer games. You’ll notice a series of graphs below the standings section that track how the projections have evolved over the course of the year.
This Dynamic Standings Projection is updated through the July 2 games.
| 3-Jul | W | L | PreDiff | |
| TB | 88 | 74 | 0.543 | -3 |
| NYY | 87 | 75 | 0.537 | 2 |
| BAL | 86 | 76 | 0.531 | 4 |
| BOS | 85 | 77 | 0.525 | 8 |
| TOR | 84 | 78 | 0.519 | -3 |
| W | L | PreDiff | ||
| DET | 92 | 70 | 0.568 | -2 |
| CWS | 77 | 85 | 0.475 | -6 |
| CLE | 77 | 85 | 0.475 | 6 |
| KC | 76 | 86 | 0.469 | 0 |
| MIN | 70 | 92 | 0.432 | 5 |
| W | L | PreDiff | ||
| TEX | 92 | 70 | 0.568 | 1 |
| OAK | 88 | 74 | 0.543 | 4 |
| LAA | 80 | 82 | 0.494 | -8 |
| SEA | 73 | 89 | 0.451 | -2 |
| HOU | 60 | 102 | 0.370 | 0 |
| W | L | PreDiff | ||
| ATL | 92 | 70 | 0.568 | 2 |
| WSH | 88 | 74 | 0.543 | -7 |
| PHI | 81 | 81 | 0.500 | -3 |
| NYM | 73 | 89 | 0.451 | -5 |
| MIA | 59 | 103 | 0.364 | -4 |
| W | L | PreDiff | ||
| STL | 94 | 68 | 0.580 | 6 |
| CIN | 93 | 69 | 0.574 | 1 |
| PIT | 90 | 72 | 0.556 | 8 |
| MIL | 74 | 88 | 0.457 | -5 |
| CHC | 68 | 94 | 0.420 | 0 |
| W | L | PreDiff | ||
| SF | 86 | 76 | 0.531 | -5 |
| ARZ | 85 | 77 | 0.525 | 3 |
| LAD | 81 | 81 | 0.500 | -7 |
| SD | 79 | 83 | 0.488 | 1 |
| COL | 72 | 90 | 0.444 | 9 |


Dynamic Standings Projection (June 26, 2013)
In case you missed it, in April we launched our Dynamic Standings Projection feature on New English D. A full explanation of the methodology can be found here or by clicking the tab at the top of the page. This project seeks to provide a reasoned and cautious approach to updating our beliefs about the baseball future. You can find a summarization of the original projections here. You’ll notice a column on the far right that indicates the difference in projected wins from the preseason prediction. Positive numbers mean teams are now projected to win more games and negative numbers mean a team is now projected to win fewer games. You’ll notice a series of graphs below the standings section that track how the projections have evolved over the course of the year.
This Dynamic Standings Projection is updated through the June 25 games.
| 26-Jun | W | L | PreDiff | |
| TB | 88 | 74 | 0.543 | -3 |
| NYY | 87 | 75 | 0.537 | 2 |
| BAL | 86 | 76 | 0.531 | 4 |
| BOS | 85 | 77 | 0.525 | 8 |
| TOR | 84 | 78 | 0.519 | -3 |
| W | L | PreDiff | ||
| DET | 92 | 70 | 0.568 | -2 |
| CWS | 77 | 85 | 0.475 | -6 |
| CLE | 77 | 85 | 0.475 | 6 |
| KC | 76 | 86 | 0.469 | 0 |
| MIN | 70 | 92 | 0.432 | 5 |
| W | L | PreDiff | ||
| TEX | 92 | 70 | 0.568 | 1 |
| OAK | 88 | 74 | 0.543 | 4 |
| LAA | 80 | 82 | 0.494 | -8 |
| SEA | 73 | 89 | 0.451 | -2 |
| HOU | 60 | 102 | 0.370 | 0 |
| W | L | PreDiff | ||
| ATL | 92 | 70 | 0.568 | 2 |
| WSH | 88 | 74 | 0.543 | -7 |
| PHI | 81 | 81 | 0.500 | -3 |
| NYM | 73 | 89 | 0.451 | -5 |
| MIA | 59 | 103 | 0.364 | -4 |
| W | L | PreDiff | ||
| STL | 94 | 68 | 0.580 | 6 |
| CIN | 93 | 69 | 0.574 | 1 |
| PIT | 90 | 72 | 0.556 | 8 |
| MIL | 74 | 88 | 0.457 | -5 |
| CHC | 68 | 94 | 0.420 | 0 |
| W | L | PreDiff | ||
| SF | 86 | 76 | 0.531 | -5 |
| ARZ | 85 | 77 | 0.525 | 3 |
| LAD | 81 | 81 | 0.500 | -7 |
| SD | 79 | 83 | 0.488 | 1 |
| COL | 72 | 90 | 0.444 | 9 |


Dynamic Standings Projection (June 19, 2013)
In case you missed it, in April we launched our Dynamic Standings Projection feature on New English D. A full explanation of the methodology can be found here or by clicking the tab at the top of the page. This project seeks to provide a reasoned and cautious approach to updating our beliefs about the baseball future. You can find a summarization of the original projections here. You’ll notice a column on the far right that indicates the difference in projected wins from the preseason prediction. Positive numbers mean teams are now projected to win more games and negative numbers mean a team is now projected to win fewer games. You’ll notice a series of graphs below the standings section that track how the projections have evolved over the course of the year.
This Dynamic Standings Projection is updated through the June 18 games.
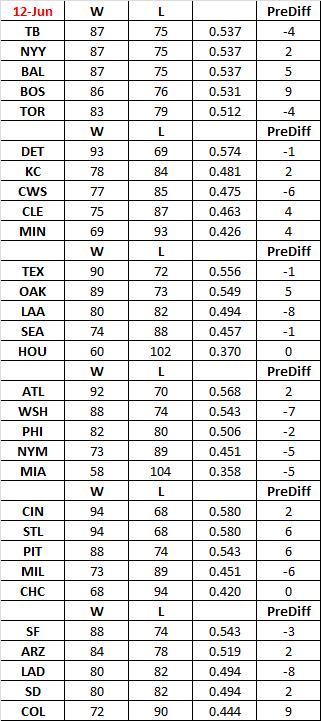


Dynamic Standings Projection (June 12, 2013)
In case you missed it, in April we launched our Dynamic Standings Projection feature on New English D. A full explanation of the methodology can be found here or by clicking the tab at the top of the page. This project seeks to provide a reasoned and cautious approach to updating our beliefs about the baseball future. You can find a summarization of the original projections here. You’ll notice a column on the far right that indicates the difference in projected wins from the preseason prediction. Positive numbers mean teams are now projected to win more games and negative numbers mean a team is now projected to win fewer games. You’ll notice a series of graphs below the standings section that track how the projections have evolved over the course of the year.
This Dynamic Standings Projection is updated through the June 11 games.


Dynamic Standings Projection (June 5, 2013)
In case you missed it, in April we launched our Dynamic Standings Projection feature on New English D. A full explanation of the methodology can be found here or by clicking the tab at the top of the page. This project seeks to provide a reasoned and cautious approach to updating our beliefs about the baseball future. You can find a summarization of the original projections here. You’ll notice a column on the far right that indicates the difference in projected wins from the preseason prediction. Positive numbers mean teams are now projected to win more games and negative numbers mean a team is now projected to win fewer games. You’ll notice a series of graphs below the standings section that track how the projections have evolved over the course of the year.
This Dynamic Standings Projection is updated through the June 4 games.


Dynamic Standings Projection (May 29, 2013)
In case you missed it, last month we launched our Dynamic Standings Projection feature on New English D. A full explanation of the methodology can be found here or by clicking the tab at the top of the page. This project seeks to provide a reasoned and cautious approach to updating our beliefs about the baseball future. You can find a summarization of the original projections here. You’ll notice a column on the far right that indicates the difference in projected wins from the preseason prediction. Positive numbers mean teams are now projected to win more games and negative numbers mean a team is now projected to win fewer games.
This Dynamic Standings Projection is updated through the May 28 games.

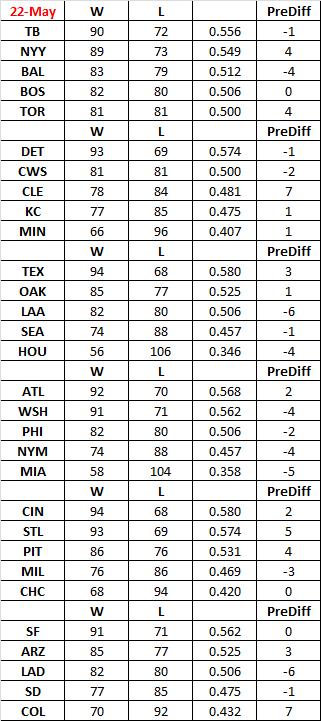
Dynamic Standings Projection (May 22, 2013)
In case you missed it, last month we launched our Dynamic Standings Projection feature on New English D. A full explanation of the methodology can be found here or by clicking the tab at the top of the page. This project seeks to provide a reasoned and cautious approach to updating our beliefs about the baseball future. You can find a summarization of the original projections here. You’ll notice a column on the far right that indicates the difference in projected wins from the preseason prediction. Positive numbers mean teams are now projected to win more games and negative numbers mean a team is now projected to win fewer games.
This Dynamic Standings Projection is updated through the May 21 games.
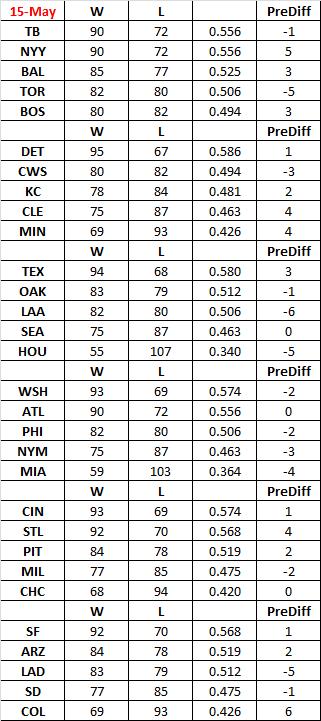
Dynamic Standings Projection (May 15, 2013)
In case you missed it, last month we launched our Dynamic Standings Projection feature on New English D. A full explanation of the methodology can be found here or by clicking the tab at the top of the page. This project seeks to provide a reasoned and cautious approach to updating our beliefs about the baseball future. You can find a summarization of the original projections here. You’ll notice a column on the far right that indicates the difference in projected wins from the preseason prediction. Positive numbers mean teams are now projected to win more games and negative numbers mean a team is now projected to win fewer games.
This Dynamic Standings Projection is updated through the May 14 games.