How Was The Game? (August 10, 2013)

Another breezy win.
Tigers 9, Yankees 3
After surrendering their 12 game winning streak on Friday in extra innings, the Tigers handled the Yankees easily on Saturday. They won the war on both fronts as Anibal Sanchez (20 GS, 125.2 IP, 2.58 ERA, 2.41 FIP, 4.2 WAR) was excellent across 7 innings (4 H, 2 R, 1 BB, 8 K) and the bats sent Hughes to the showers early. The Tigers first three hitters all homered during the game and 5 players reached base at least twice. Jackson stayed hot, Cabrera stayed hot, and Hunter, Kelly, and Iglesias also did things that improved the team’s chances of winning. It was never really in doubt as the Tigers won their 17th game in their last 19 tries and improved to 69-46 on the season. They will look to take the series on Sunday with the newly himself Justin Verlander (24 GS, 151.2 IP, 3.50 ERA, 3.33 FIP, 3.5 WAR), who lowered his ERA between starts thanks to a scoring change.
The Moment: Cabrera turned on a Hughes pitch and sent it out to left field.
How Was The Game? (August 9, 2013)
The end of a great run.
Yankees 4, Tigers 3 (10 innings)
It had to end sometime. Logic dictated that. You can’t win every game and the longer your streak goes the more improbable it gets. After 12 straight victories and a figurative funeral for the rest of the division, the Tigers finally lost on Friday. Rick Porcello (21 GS, 125 IP, 4.32 ERA, 3.49 FIP, 2.3 WAR) was solid, and a Robinson Cano double on a pretty good changeup was the difference between a very good start and a pretty good one. He only went 5 innings but struck out 6, walked 2, and surrendered 3 runs. On most nights, that’s good enough for the Tigers offense but Ivan Nova escaped a few jams against the Tigers, who only cashed in with the starter in the game during the 7th inning on a Cabrera single. Jackson had a good night, but the Tigers simply didn’t get hits with men on base, which is going to happen from time to time and especially when you’ve just completed the type of run the Tigers went on. It got extremely interesting, however, when Miguel Cabrera launched a 2 out, 2 run, game-tying homerun to dead center off Rivera and sent the game into extras. Despite the amazing turn of events, the Yankees rallied against Alburquerque in the 10th while Benoit sat alone in the bullpen waiting for a save that would never come. The streak is over, but the Tigers have still won 16 of their last 18 games and saw the Indians fall on the out of town scoreboard so they will remain 7 up in the Central with 48 to play. They’ll play a matinee at Yankee Stadium with Anibal Sanchez (19 GS, 118.2 IP, 2.58 ERA, 2.37 FIP, 4.1 WAR) on the bump.
The Moment: Cabrera hits a game tying homerun with two outs in the 9th against Mariano Rivera
Joaquin Benoit: Evolution of a Reliever

This post will make no further reference to Joaquin Benoit being the Tigers’ closer. I don’t believe in the closer myth and would rather run the bullpen much differently. That said, good relief pitching is important and having and using good relievers is essential to success. One of the key cogs in the current Tigers bullpen, Benoit, is having a great season and deserves some credit.
Let’s start with some particulars from 2013. He’s thrown 47 IP with a 1.53 ERA, 2.15 FIP, and 1.5 WAR. Those three marks are 9th, 14th, and 15th among qualified MLB relievers this year. By our own reliever stat, SOEFA, he ranks 7th among pitchers with at least 20 innings pitched. By all accounts, he’s having a great year and you know he’s had great years in the past.
This isn’t a particularly groundbreaking analysis piece, but rather more a recognition that Benoit was become a very good reliever and has been good for a pretty long time. Let’s start from 2006 when he became a full time relief pitcher and work forward. And let’s start with ERA, FIP (what’s FIP?), and xFIP (what’s xFIP?) and lets park adjust them because he’s played in a few different stadiums that are somewhat extreme. These numbers are easy to understand. 100 is league average during each season and a point below or above is a percent better or worse than average. The lower the better, just like ERA. Note that he missed 2009 with an injury:

You can see he’s been above average for the most part in his entire relief career. 2010 was his golden season, but 2013 is pretty darn close. For a reliever, strikeouts and walks are key and he’s made some nice gains over time:
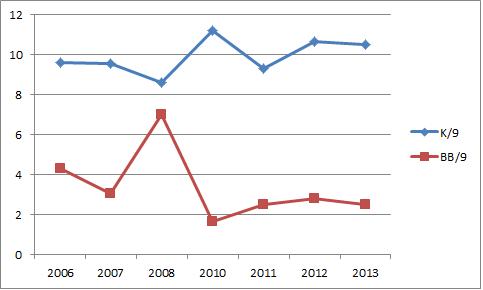
2008 is obviously the outlier, probably due to the coming injury, but overall the BB rate came down in a big way compared to before the injury and the strikeout rate has steadily risen. He’s cut his HR rate quite a bit this year, but that’s mostly a fluky small sample thing which will regress up a bit, but not so much that it will dramatically shift the results. Across the board, there aren’t a ton of other underlying numbers that have my attention except for the one that’s about to come.
Something I noticed in Jose Veras when the Tigers traded for him was that he’s getting ahead of hitters with first pitch strikes. Benoit is working the zone early too:

Since the rotator cuff injury, he has gotten better. Some of that might be maturity and between his ears, but some could be a health factor. Benoit has taken a step forward as he’s aged despite most relievers having a short shelf life. The ability to throw strikes is critical to a reliever’s success and Benoit is getting better at it early in counts. He’s not hitting the zone more, he’s just doing it earlier. That’s very valuable thing. His velocity improved after the injury, but it’s been constant since. I’m interested in the movement. The top charts (H/T FanGraphs) are 2008 and the bottom are 2013:


You can see more consistency and separation in his pitches. He’s better. More first pitch strikes, more consistent pitches, more strikeouts, fewer walks, and better overall results. Benoit’s been a very good reliever for what’s going on quite a few seasons. In over 400 MLB innings since the start of 2006, he has an ERA- of 73 and FIP- of 77.
And he’s heading onto the open market next season with the shine of a big season. He’s done that before and it paid him nicely.
How Was The Game? (August 8, 2013)
Everything you could ever want, and then some.
Tigers 10, Indians 3
So I’m going to get right to it. Yes Max Scherzer (23 GS, 158.1 IP, 2.84 ERA, 2.69 FIP, 4.8 WAR) was excellent and yes the Tigers scored 10 runs, but the story of this game came in the waning moments when Ryan Raburn came trotting in from the Indians’ bullpen. Ryan Raburn pitched in an MLB game which is the confluence of just about everything I love about baseball. I love Raburn because he’s the most dynamic player I’ve ever seen. He could hit a game winning homerun or he could trip down the stairs and injure the starting pitcher. The range of outcomes is so wide and so amazing. He’s a utility man, which I love. And he’s a player who fans didn’t like, which made me love him more. And then of course the simple fact that he was a position player called on to pitch, which is just about my favorite thing in the world anyway. Against his former team. A 1-2-3 inning. With a strikeout. On this day, the Tigers ran over the Indians for their 12 straight win, 16th in their last 17, and pushed their lead over the Indians to a seemingly insurmountable 7 games. It was their fourth straight sweep. It’s all going right these days, and we got to see Raburn pitch. Baseball, you guys. Baseball. The Tigers will hop a plain to the Big Apple and will give the ball to Rick Porcello (20 GS, 120 IP, 4.28 ERA, 3.56 FIP, 2.1 WAR) in game one on Friday.
The Moment: Ryan Raburn pitched.
Can The Tigers Win 15 Straight Games?
Winning streaks are so in right now. The Braves have won 13 games in a row and pushed their insane August-division lead to 15.5 games in the NL East. That looks like a typo even though I know it’s a fact. The Tigers, for their part, have won 11 straight baseball games and are 6 games up on the very solid Cleveland Indians. Winning is exciting and doing it a bunch of times in a row is compelling and interesting.
We’ll leave aside the Braves and focus on the Tigers because, well, this is a Tigers site. Let’s establish some basics. The Tigers record for consecutive wins is 14. The AL record is 20 by the 2002 A’s. The MLB record is 21 from the 1935 Cubs. The Tigers are currently at 11.
What are the odds they get to the record(s)?
Let’s start with the team record because that’s the one we can really dig into because we know the pitching matchups. The Tigers have one game against the Indians (108 wRC+) and then three against the Yankees (81 wRC+). The Indians have a good offense and the Yankees have a bad one. That was easy. Let’s take a look at the matchups:
- Scherzer at McAllister (3.47 ERA, 3.81 FIP)
- Porcello at Nova (3.08 ERA, 2.97 FIP)
- Sanchez at Hughes (4.87 ERA, 4.67 FIP)
- Verlander at Pettitte (4.71 ERA, 3.90 FIP)
McAllister has been successful at preventing runs and his peripherals generally support that. Nova’s been pitching well across the board. Hughes has had some trouble and he’s a mess at Yankee Stadium. Pettitte’s pitched better than his ERA, but he has to pitch in front of that defense so when we’re talking about team wins and losses the runs matter even if they aren’t Pettitte’s fault.
So what can we infer from the pitching matchups and offensive numbers that we can incorporate into our expectations? Not too much. Most individual baseball games are unpredictable. McAllister is tough matchup, Nova is pitching well. Hughes gives up homers in a small park and Pettitte is left handed. All in all that’s pretty balanced. Nothing on the page tells me the Tigers are especially favored in any of the games.
So what are the odds. Let’s use a simple formula. The Tigers have won 59.8% of their games. Indians at 54.4%. Yankees at 50.4%. These numbers are based on playing the whole league and not other reasonable good clubs. So I’ll undersell the Tigers’ advantage. Let’s say they have a 52% chance of winning any individual game against another team.
If we give them a 52% chance and assume that winning one game doesn’t change the likelihood of winning the next game, the Tigers have a 7.3% chance of winning the next four games.
But under those same conditions the odds of winning 11 in a row up to this point is a staggering 0.075%. The odds of a 15 game streak is 0.006%. Basically, they’ve done the hard part! When this thing started they had a less than a 6/100,000 chance of winning 15 straight games. Now it’s up to 7/100!
They’ve won with great pitching and big contributions from the bottom of the order and the bullpen. It’s unlikely they’ll win 4 more games before they lose and set the team record, but the odds are way better now than they were two weeks ago. 7 in 100, as an old Econ professor use to say, is not like walking outside and getting hit by an asteroid. Sometimes it does happen.
The Tigers are playing excellent baseball but they still have a ways to go to set the record, even if they’ve made it pretty easy on themselves comparatively. Just for fun, the odds of setting the AL and MLB record are pretty fun to consider.
The Tigers have a 0.14% chance of setting the AL record and a 0.075% chance of setting the MLB record starting today. The odds of winning 21 and 22 games in a row starting from zero at odds of 52% for each game comes out to 0.0001% and 0.00006%. Also known as 1 in million or 6 in 10 million.
Even if you assumed the team was a true .600 win percentage team, winning 22 straight games would still only happen 0.0013% of the time. It’s really hard to win a bunch of games in a row. Even if you were a .800 true talent team, you would still only win 22 games in a row 0.7% of the time. Essentially what I’m tell you is that if a team who finished 130-32 played repeatedly in some sort of weird experiment, they would only win 22 consecutive games about 1% of the time.
This is a fun streak. Hold your breath, because we’re getting close to some impressive history and another division title.
How Was The Game? (August 7, 2013)
A giant mess, but with a great ending.
Tigers 6, Indians 5 (14 innings)
Doug Fister (23 GS, 149 IP, 3.50 IP, 3.29 FIP, 3.2 WAR) didn’t match the brilliance of his previous two outings, but he gave the Tigers 6 innings of 7 hit, 2 run, 2 walk (1 HBP) and 8 strikeout baseball. He made a few mistake pitches but holding the Indians to 2 runs in 6 innings is nothing at which to sneeze. Unfortunately, Danny Salazar was the story on the other side. Iglesias singled in a run early and Jackson hit a solo homerun but the rookie overpowered the Tigers for most of the evening. That is, of course, until he was allowed to face Miguel Cabrera with a man on base in the 8th inning down a run. That didn’t end well for Salazar or the Indians as Cabrera effortlessly swatted a go-ahead bomb to right center field. Unfortunately, the Tigers gave one back in the bottom half and left us with the score tied entering the 9th. Extra innings were a blur of failed strategy and excellent pitching. I must have dozed off because I recall Jeremy Bonderman pitching and pitching effectively. It all came crashing down on the Indians in the 14th on a two run double from Fielder that scored Jackson and Perez. The win is the Tigers 11th straight, 15th of 16, and 24th in their last 31. They are 22 over .500 and now lead the Central by 6 games with just 4 left against Cleveland the rest of the way. They’ll go for the 4-game knockout sweep on Thursday with Max Scherzer (22 GS, 151.1 IP, 2.85 ERA, 2.71 FIP, 4.5 WAR) on the mound.
The Moment: Cabrera drives a game-winning homer to right center or…. Fielder doubles in the winning runs?
Should We Worry About Jackson?

In an all-around sense, Austin Jackson is an excellent baseball player. He’s well above average in the field no matter what statistic you look at or if you’re just a person with eyes and he’s also very good on the bases. His offense will be the difference between solid-starter and perennial all-star, so it will be the subject of this post.
The origin of the analysis comes from a Tweet sent out challenging the author:
While Cam and I are friends and he’s an occasional guest on New English D Audio, he’s hit on my role in the Tigers blogging community. Apparently, I’m the guy who finds out what’s wrong with players and tells you if you should worry or not. That’s fine, I’m on board. So first, is anything wrong with Jackson?
He’s on pace for something like a 3.5 WAR (what’s WAR?) season, which is very good, but it’s not quite like the 5.2 mark he posted a year ago. As I said before, the defense and baserunning are in line with his normal production, so it’s all about the bat (once we’ve corrected for his DL time).
Let’s start with some simple season by season comparisons of his AVG, OBP, and SLG and then we’ll use wRC+ (what’s wRC+?) to compare him to league average. Remember 100 is average and every point above or below is that percent better or worse than average.
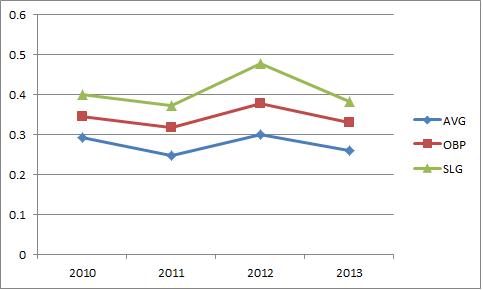

So the basic story is pretty clear. In the context of 2012, this year looks bad. In the context of the rest of his career it looks fine. Is he around average or is he a star? That’s our basic question. He’s been a very high BABIP guy (what’s BABIP?) in his entire career and these overall numbers trend along with BABIP.

So the issue with Jackson is that he’s hitting below his established BABIP. Now BABIP is a pretty fluky stat in small samples, but line drive hitters are usually above average in this department and he has always been a guy who maintains a big number. He’s closer to average (about .300) this year than ever before. Is that to blame and is that his fault?
Let’s consider this season in particular because I think it’s interesting. I don’t think it’s been all bad, I think we’re looking at a slump of some kind. Let’s check out his monthly splits. Remember he has fewer May and June PAs because of the injury:
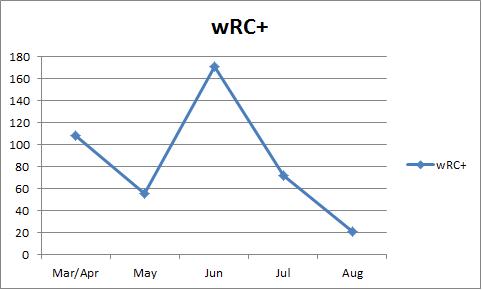 He hit well in April, struggled a little in May before the DL stint, played well at the end of June and hasn’t been great at all in July and August. Since July 1st, he’s hitting .215/.257/.356 (.280 BABIP). That’s not very good. Before July 1, he was .290/.374/.401 (.348 BABIP), which is very good for a CF, especially one who plays the rest of the game so well.
So the question is this. Is the first half Jackson the real one or is the second half Jackson the real one? Or is it the combination of the two?
My take is this. Jackson is a high BABIP guy who gets a lot of his value from getting more hits on balls in play than most, so he is susceptible to slumps based on luck. And sometimes those things snowball. I think he’s a good hitter, who will occasionally have these struggles. Let’s take a look at the batted ball data:
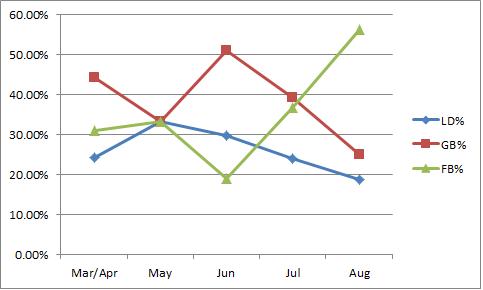 So keep in mind the varying sample sizes. Look at April and July most carefully. He’s hitting the ball in the air instead of hitting in on the ground and on a line. Remember what I said about BABIP and line drive hitters. Jackson will be more successful when he hits line drives and ground balls, so this correlates perfectly with the results. Jackson is performing worse because his BABIP is lower which is lower because he’s hitting the ball in the air more often. This is pretty straightforward, so now the question is if this is something Jackson is doing differently or if it’s just random noise that will correct itself.
I will point out that some of this is strikeouts, but not all of it. He was a 17.8% K guy in April-June and has been a 27.4% K guy since. But BABIP is only about balls in play. I’ve looked at the swing charts between the two periods and I don’t see a huge difference. If you look a spray charts, you see something of a difference:


He’s hitting fewer balls to the middle of the field and is using left and right more often since July 1. Remember the sample size is different, but the void up the middle is clear. Jackson is striking out more, but he was well below his career average entering July so you had so expect some change. As for the balls in play, it looks like he’s hitting the ball in the air too much and not back up the middle as much. To me, this is just an approach thing that needs a little work.
Jackson has the contact and pitch recognition skills to square up a ball, he’s just not doing it right now. With a little work with the hitting coaches, he should be able to get himself back on track. His swing can get long at times, and I think that’s all this is. Baseball players will go in and out of this kind of thing.
To me, it doesn’t look like this is basic random variation. I think there is something a little off with his approach, but it doesn’t look like something he can’t fix. We’ve seen him come out of stretches like this without a problem. Despite the streak, he’s still a league average hitter and an above average everything else.
Jackson is slumping a little, but nothing that can’t be fixed.
A Quick Verlander Release Point Recap
About two weeks ago I wrote a piece explaining how Verlander’s troubles this season can be chalked up to his inconsistent release point. You can read the entire thing here, in which I lay out the problem in the results, the causes of those problems, and the root cause – release point – that is behind the whole thing. I’ll trust that you’ll believe me or go back and read that piece so I don’t have to repeat myself here.
It’s August 6th and Verlander just twirled 8 excellent innings against the Indians and the initial thing that will catch your eye is his increased fastball velocity (average 96.9, top 100.8). But as you know, I’m not interested in the velocity issue, I’m interested in his release point. So how’d it look?
First, let me show you full season graphs from 2012 and 2013 to get you up to speed on what we’re looking for (from catcher’s perspective):


The difference is obvious. In the initial post I isolated it by pitch type, but let’s just keep it going. You’ll notice our goal is to keep everything to the left of the imaginary -1.5 line. You want the data points between -2.5 and -1.5. That’s the sweet spot. Also between 6 and 7 feet vertically, but that hasn’t been an issue this year.
How’d he do tonight?
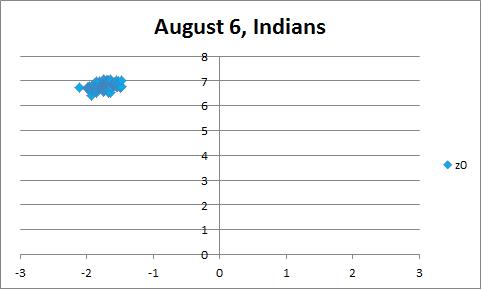
First allow me to apologize for using a different plotting source. The graphs above are from FanGraphs, which won’t update until tomorrow. Below is from Brooks Baseball. I’ll make two notes. One, I’ve looked at the actual numbers from the source and they confirm the graphic. Two, I’ve drawn in the lines of interest because I’m a super helpful guy.

The danger zone is empty. If you look at the source data, there are a couple points that are technically less than an inch over the -1.5 line, but the first two graphs aren’t super precise, so that’s not an issue. I would also like to point out, that thanks to reader suggestion, I checked to see if the Cleveland Pitch F/X setup could be influencing these results. Comparing Sanchez’s start on Monday compared to his last start at Comerica Park showed no systemic bias. In fact, if anything, my exploration of other Sanchez starts indicates that the Cleveland setup might actually be working against Verlander in the example I’m about to show you. I’m not going to wager my life savings on this, but JV’s improvement seems to be showing up despite any sort of technical issues.
If you take a look at the movement charts, there is still room left to improve. The curveball had nice depth, but it needs more horizontal tilt. That said, the velocity is up and the release point looks great. I’m encouraged. The process was good and the results were there against a very good offense. Want more evidence? Below I’ve done the plotting myself for consistency. The first is a terrible start against the worst offense in the AL, the second is tonight against the very good Indians:

Need I say more?
Guys, I think he’s back. The American League is on notice. (Editor’s note: The velocity and release point gains carried into his next start. Details here)
How Was The Game? (August 6, 2013)
Filled with everything you could ever want.
Tigers 5, Indians 1
So let’s recap what happened tonight. Justin Verlander (24 GS, 151.2 IP, 3.74 ERA, 3.32 FIP, 3.5 WAR) had one of his best starts since April with excellent velocity (96.9 MPH average FB, up to 100.8 MPH), terrific command, and a full helping of breaking pitches that allowed him to spin 8 innings of 4 hit, 1 run, 0 walk, 1 HBP, and 7 strikeout ball. Also, the Tigers extended their winning streak to 10 games and pushed their lead in the Central to 5 games. There was also the matter of Don Kelly being amazing with a 3-4 night that included the stomach punch homerun against Masterson. At the risk of being called for using a double negative, there simply wasn’t anything not to like. Verlander was great, Don Kelly led the way, and the Tigers won. That’s the whole story and it’s all you need. The Tigers will call upon Doug Fister (22 GS, 143 IP, 3.52 ERA, 3.26 FIP, 3.1 WAR) to clinch a series victory on Wednesday.
The Moment: Don Kelly turns on one in the 5th, sending it into the seats.
New English D Audio (Episode 4)
On this edition of New English D Audio I talk with Cameron Bonk of The Farm Club and The Guy Show about Peralta, PEDs in general, the Tigers hot streak, postseason prospects, and terrible announcers in sports. Return listeners of the program will notice the audio quality is improved and the two participants speak with equal volume! Should you have questions about our Detroit Tigers podcast or related questions, comments, or suggestions direct them to me on Twitter @NeilWeinberg44 or to NewEnglishD@gmail.com. The following link will direct you to another page that will allow you to download the podcast with one additional click.
Download (Approx 44 mins)
