How Was The Game? (September 15, 2013)

A feather in Max’s award season cap.
Tigers 3, Royals 2 (Magic # = 9)
When Max Scherzer (30 GS, 201.1 IP, 2.95 ERA, 2.68 FIP, 6.2 WAR) takes the mound you can usually count on the Tigers to score a lot of runs, but on this afternoon that wouldn’t be the case. Despite plenty of chances the Tigers only scored on Alex Avila’s 2 run homer in the second inning and that would be all Max would need (sort of!). Aside from a solo homerun to Gordon he dazzled across 7 innings in which he allowed 5 hits, 1 walk, and struck out 12 Kansas City Royals, including 5 straight at one point. It was vintage Max after he struggled in two of his past three outings and he sent the Tigers on the path to their 86th win of the season that would be interrupted by a run scoring wild pitch in the 8th inning that tied the game at 2 until Avila stepped in to untie it again with a bomb in the 8th. They’ll welcome the Mariners to Comerica Park for the first time this season on Monday with Rick Porcello (27 GS, 162 IP, 4.56 ERA, 3.73 FIP, 2.5 WAR) lined up for game one.
The Moment: Avila blasts a go-ahead homerun in the 8th – his second of the day.
SOEFA Sunday: Reliever Rankings Update (September 15, 2013)
You’ll recall earlier this year we introduced our very own reliever rankings called SOEFA, which you can read about in detail here. For a brief refresher, it combines inherited runner strand rate, expected OBP against, ERA-, and FIP- into a deviation from league average. This is a measure of performance, not necessarily ability, and seeks to provide a single number to judge relievers that balances context neutral and context dependent numbers. Certain pitchers, such as Craig Kimbrel, cannot be credited for stranding runners because they are never put into those situations. They are not penalized either, however. Additionally, SOEFA penalizes pitchers like Joe Nathan and Mariano Rivera who have done a very poor job when they have been asked to strand runners this season despite great numbers in other categories.
Zero is average, and will generally range between -2.5 to 2.5 with -1 to 1 being most common. This includes all pitchers who have thrown at least 20 IP in relief as of this morning, so the average score on this list is closer to 0.10 and the inherited runner threshold has been increased from 5 to 8. SOEFA is a rate stat not a counting stat. Should you wish to know the SOEFA for any other reliever, or on a day that isn’t Sunday, hit us on Twitter or in the comments section. Also, as we look to improve SOEFA for next season, let us know if you have any suggestions!
| Rank | Player | Team | SOEFA |
| 1 | Koji Uehara | Red Sox | 0.95 |
| 2 | Greg Holland | Royals | 0.94 |
| 3 | Kenley Jansen | Dodgers | 0.91 |
| 4 | Neal Cotts | Rangers | 0.89 |
| 5 | Kevin Siegrist | Cardinals | 0.80 |
| 6 | Mark Melancon | Pirates | 0.80 |
| 7 | Drew Smyly | Tigers | 0.78 |
| 8 | Jesse Crain | White Sox | 0.78 |
| 9 | Craig Kimbrel | Braves | 0.77 |
| 10 | Javier Lopez | Giants | 0.77 |
| 11 | Will Smith | Royals | 0.76 |
| 12 | Louis Coleman | Royals | 0.73 |
| 13 | Luke Hochevar | Royals | 0.73 |
| 14 | Joaquin Benoit | Tigers | 0.70 |
| 15 | Sergio Romo | Giants | 0.70 |
| 16 | Chris Withrow | Dodgers | 0.66 |
| 17 | Alex Torres | Rays | 0.65 |
| 18 | Nick Vincent | Padres | 0.64 |
| 19 | Sean Doolittle | Athletics | 0.63 |
| 20 | Sam LeCure | Reds | 0.62 |
| 21 | Edward Mujica | Cardinals | 0.61 |
| 22 | Jose Veras | – – – | 0.61 |
| 23 | Jordan Walden | Braves | 0.59 |
| 24 | Trevor Rosenthal | Cardinals | 0.59 |
| 25 | Tanner Roark | Nationals | 0.57 |
| 26 | Jason Grilli | Pirates | 0.56 |
| 27 | David Huff | – – – | 0.54 |
| 28 | Glen Perkins | Twins | 0.54 |
| 29 | Jim Henderson | Brewers | 0.54 |
| 30 | Paco Rodriguez | Dodgers | 0.54 |
| 31 | Brian Matusz | Orioles | 0.53 |
| 32 | Casey Fien | Twins | 0.52 |
| 33 | Carlos Torres | Mets | 0.51 |
| 34 | Jake Diekman | Phillies | 0.51 |
| 35 | Tommy Hunter | Orioles | 0.51 |
| 36 | Antonio Bastardo | Phillies | 0.50 |
| 37 | Dan Otero | Athletics | 0.50 |
| 38 | Juan Perez | Blue Jays | 0.50 |
| 39 | Josh Collmenter | Diamondbacks | 0.48 |
| 40 | Shawn Kelley | Yankees | 0.48 |
| 41 | Andrew Miller | Red Sox | 0.47 |
| 42 | Brett Cecil | Blue Jays | 0.47 |
| 43 | Jason Frasor | Rangers | 0.47 |
| 44 | Manny Parra | Reds | 0.47 |
| 45 | Randy Choate | Cardinals | 0.46 |
| 46 | Brandon Kintzler | Brewers | 0.45 |
| 47 | Bobby Parnell | Mets | 0.44 |
| 48 | Seth Maness | Cardinals | 0.43 |
| 49 | Chad Qualls | Marlins | 0.42 |
| 50 | J.P. Howell | Dodgers | 0.42 |
| 51 | Junichi Tazawa | Red Sox | 0.42 |
| 52 | Matt Reynolds | Diamondbacks | 0.42 |
| 53 | Jonathan Papelbon | Phillies | 0.41 |
| 54 | Luis Avilan | Braves | 0.41 |
| 55 | Francisco Rodriguez | – – – | 0.40 |
| 56 | Joel Peralta | Rays | 0.40 |
| 57 | Brad Ziegler | Diamondbacks | 0.39 |
| 58 | Steve Cishek | Marlins | 0.39 |
| 59 | Tanner Scheppers | Rangers | 0.39 |
| 60 | Aroldis Chapman | Reds | 0.38 |
| 61 | Donovan Hand | Brewers | 0.38 |
| 62 | Joe Thatcher | – – – | 0.38 |
| 63 | Vin Mazzaro | Pirates | 0.38 |
| 64 | David Carpenter | Braves | 0.37 |
| 65 | Rob Scahill | Rockies | 0.37 |
| 66 | Tony Watson | Pirates | 0.37 |
| 67 | Tyler Clippard | Nationals | 0.37 |
| 68 | Darren O’Day | Orioles | 0.36 |
| 69 | Casey Janssen | Blue Jays | 0.35 |
| 70 | Will Harris | Diamondbacks | 0.35 |
| 71 | Ernesto Frieri | Angels | 0.34 |
| 72 | Joe Smith | Indians | 0.34 |
| 73 | Scott Downs | – – – | 0.34 |
| 74 | Addison Reed | White Sox | 0.32 |
| 75 | Carlos Villanueva | Cubs | 0.32 |
| 76 | Jean Machi | Giants | 0.32 |
| 77 | Josh Outman | Rockies | 0.32 |
| 78 | Nate Jones | White Sox | 0.32 |
| 79 | Ross Ohlendorf | Nationals | 0.32 |
| 80 | Jerome Williams | Angels | 0.31 |
| 81 | Tom Gorzelanny | Brewers | 0.31 |
| 82 | Luke Gregerson | Padres | 0.30 |
| 83 | Neil Wagner | Blue Jays | 0.30 |
| 84 | Santiago Casilla | Giants | 0.30 |
| 85 | Aaron Loup | Blue Jays | 0.29 |
| 86 | Robbie Ross | Rangers | 0.29 |
| 87 | Grant Balfour | Athletics | 0.27 |
| 88 | Jamey Wright | Rays | 0.27 |
| 89 | Luke Putkonen | Tigers | 0.27 |
| 90 | Steve Delabar | Blue Jays | 0.27 |
| 91 | Tim Collins | Royals | 0.27 |
| 92 | Anthony Varvaro | Braves | 0.26 |
| 93 | Caleb Thielbar | Twins | 0.26 |
| 94 | Craig Stammen | Nationals | 0.26 |
| 95 | Jared Burton | Twins | 0.25 |
| 96 | David Robertson | Yankees | 0.24 |
| 97 | Luis Ayala | – – – | 0.24 |
| 98 | Mariano Rivera | Yankees | 0.24 |
| 99 | Boone Logan | Yankees | 0.23 |
| 100 | Matt Belisle | Rockies | 0.23 |
| 101 | Chad Gaudin | Giants | 0.22 |
| 102 | Charlie Furbush | Mariners | 0.22 |
| 103 | Craig Breslow | Red Sox | 0.22 |
| 104 | Dan Jennings | Marlins | 0.22 |
| 105 | Alfredo Simon | Reds | 0.20 |
| 106 | Blake Parker | Cubs | 0.20 |
| 107 | Fernando Rodney | Rays | 0.20 |
| 108 | Mike Dunn | Marlins | 0.20 |
| 109 | Cody Allen | Indians | 0.19 |
| 110 | Danny Farquhar | Mariners | 0.19 |
| 111 | David Purcey | White Sox | 0.19 |
| 112 | Preston Claiborne | Yankees | 0.19 |
| 113 | Rafael Betancourt | Rockies | 0.17 |
| 114 | Anthony Swarzak | Twins | 0.16 |
| 115 | Dale Thayer | Padres | 0.16 |
| 116 | J.C. Gutierrez | – – – | 0.16 |
| 117 | Rex Brothers | Rockies | 0.16 |
| 118 | J.J. Putz | Diamondbacks | 0.15 |
| 119 | Tim Stauffer | Padres | 0.15 |
| 120 | Rafael Soriano | Nationals | 0.14 |
| 121 | Carter Capps | Mariners | 0.13 |
| 122 | Kevin Gregg | Cubs | 0.12 |
| 123 | Sandy Rosario | Giants | 0.12 |
| 124 | Alfredo Figaro | Brewers | 0.11 |
| 125 | Matt Lindstrom | White Sox | 0.11 |
| 126 | Scott Rice | Mets | 0.11 |
| 127 | Bryan Shaw | Indians | 0.10 |
| 128 | Justin Wilson | Pirates | 0.10 |
| 129 | LaTroy Hawkins | Mets | 0.10 |
| 130 | Oliver Perez | Mariners | 0.10 |
| 131 | Adam Ottavino | Rockies | 0.09 |
| 132 | Ryan Cook | Athletics | 0.09 |
| 133 | Andrew Bailey | Red Sox | 0.08 |
| 134 | Brian Duensing | Twins | 0.08 |
| 135 | Brandon Workman | Red Sox | 0.07 |
| 136 | Bruce Rondon | Tigers | 0.07 |
| 137 | Joe Nathan | Rangers | 0.07 |
| 138 | Matt Thornton | – – – | 0.07 |
| 139 | Ryan Webb | Marlins | 0.07 |
| 140 | Wilton Lopez | Rockies | 0.07 |
| 141 | Fernando Abad | Nationals | 0.06 |
| 142 | Heath Bell | Diamondbacks | 0.06 |
| 143 | J.J. Hoover | Reds | 0.06 |
| 144 | Jesse Chavez | Athletics | 0.06 |
| 145 | Joe Kelly | Cardinals | 0.06 |
| 146 | Kelvin Herrera | Royals | 0.06 |
| 147 | Burke Badenhop | Brewers | 0.05 |
| 148 | Gonzalez Germen | Mets | 0.05 |
| 149 | Jim Johnson | Orioles | 0.05 |
| 150 | Yoervis Medina | Mariners | 0.05 |
| 151 | Darren Oliver | Blue Jays | 0.04 |
| 152 | Jeanmar Gomez | Pirates | 0.04 |
| 153 | Tyson Ross | Padres | 0.04 |
| 154 | Dane de la Rosa | Angels | 0.02 |
| 155 | Matt Guerrier | – – – | 0.01 |
| 156 | Michael Kohn | Angels | 0.01 |
| 157 | Ross Wolf | Rangers | 0.00 |
| 158 | Josh Edgin | Mets | -0.01 |
| 159 | Ronald Belisario | Dodgers | -0.01 |
| 160 | Edgmer Escalona | Rockies | -0.02 |
| 161 | Huston Street | Padres | -0.02 |
| 162 | Manuel Corpas | Rockies | -0.02 |
| 163 | Kevin Jepsen | Angels | -0.03 |
| 164 | Jerry Blevins | Athletics | -0.04 |
| 165 | Pat Neshek | Athletics | -0.04 |
| 166 | Ryan Pressly | Twins | -0.04 |
| 167 | Jake McGee | Rays | -0.05 |
| 168 | Tyler Thornburg | Brewers | -0.05 |
| 169 | Dustin McGowan | Blue Jays | -0.06 |
| 170 | Logan Ondrusek | Reds | -0.06 |
| 171 | James Russell | Cubs | -0.07 |
| 172 | Chris Perez | Indians | -0.08 |
| 173 | David Aardsma | Mets | -0.08 |
| 174 | Rob Wooten | Brewers | -0.09 |
| 175 | Tom Wilhelmsen | Mariners | -0.10 |
| 176 | Darin Downs | Tigers | -0.12 |
| 177 | Joe Ortiz | Rangers | -0.12 |
| 178 | Marc Rzepczynski | – – – | -0.12 |
| 179 | Matt Albers | Indians | -0.12 |
| 180 | Jared Hughes | Pirates | -0.13 |
| 181 | Josh Fields | Astros | -0.13 |
| 182 | Tony Sipp | Diamondbacks | -0.13 |
| 183 | Troy Patton | Orioles | -0.13 |
| 184 | Aaron Crow | Royals | -0.14 |
| 185 | Cesar Ramos | Rays | -0.14 |
| 186 | Wesley Wright | – – – | -0.14 |
| 187 | Drew Storen | Nationals | -0.15 |
| 188 | Josh Zeid | Astros | -0.15 |
| 189 | Kyle Farnsworth | – – – | -0.15 |
| 190 | Nick Hagadone | Indians | -0.16 |
| 191 | Phil Coke | Tigers | -0.16 |
| 192 | Brad Brach | Padres | -0.18 |
| 193 | Fernando Salas | Cardinals | -0.18 |
| 194 | Zach Duke | – – – | -0.18 |
| 195 | Cory Gearrin | Braves | -0.19 |
| 196 | Donnie Veal | White Sox | -0.19 |
| 197 | Raul Valdes | Phillies | -0.19 |
| 198 | A.J. Ramos | Marlins | -0.20 |
| 199 | Jake Dunning | Giants | -0.20 |
| 200 | Ramon Troncoso | White Sox | -0.20 |
| 201 | Evan Scribner | Athletics | -0.21 |
| 202 | George Kontos | Giants | -0.21 |
| 203 | Jose Mijares | Giants | -0.21 |
| 204 | Bryan Morris | Pirates | -0.22 |
| 205 | David Hernandez | Diamondbacks | -0.22 |
| 206 | Pedro Strop | – – – | -0.23 |
| 207 | Rich Hill | Indians | -0.23 |
| 208 | Jonathan Broxton | Reds | -0.24 |
| 209 | Blake Beavan | Mariners | -0.26 |
| 210 | Mike Adams | Phillies | -0.26 |
| 211 | Josh Roenicke | Twins | -0.27 |
| 212 | Vinnie Pestano | Indians | -0.27 |
| 213 | Brad Lincoln | Blue Jays | -0.30 |
| 214 | Justin De Fratus | Phillies | -0.30 |
| 215 | Lucas Luetge | Mariners | -0.30 |
| 216 | Garrett Richards | Angels | -0.31 |
| 217 | Michael Bowden | Cubs | -0.33 |
| 218 | T.J. McFarland | Orioles | -0.33 |
| 219 | Al Alburquerque | Tigers | -0.35 |
| 220 | John Axford | – – – | -0.35 |
| 221 | Scott Atchison | Mets | -0.36 |
| 222 | Adam Warren | Yankees | -0.37 |
| 223 | Dylan Axelrod | White Sox | -0.37 |
| 224 | Paul Clemens | Astros | -0.37 |
| 225 | Ryan Mattheus | Nationals | -0.39 |
| 226 | Travis Blackley | – – – | -0.40 |
| 227 | Clayton Mortensen | Red Sox | -0.41 |
| 228 | Esmil Rogers | Blue Jays | -0.42 |
| 229 | Alex Wilson | Red Sox | -0.45 |
| 230 | Brandon Lyon | Mets | -0.48 |
| 231 | Carlos Marmol | – – – | -0.49 |
| 232 | Greg Burke | Mets | -0.49 |
| 233 | Joba Chamberlain | Yankees | -0.49 |
| 234 | Michael Gonzalez | Brewers | -0.49 |
| 235 | Brandon Maurer | Mariners | -0.50 |
| 236 | Bruce Chen | Royals | -0.54 |
| 237 | Jose Cisnero | Astros | -0.58 |
| 238 | Jeremy Horst | Phillies | -0.59 |
| 239 | Dallas Keuchel | Astros | -0.63 |
| 240 | Hector Ambriz | Astros | -0.63 |
| 241 | Ian Krol | Nationals | -0.67 |
| 242 | Jeremy Affeldt | Giants | -0.67 |
| 243 | Hector Rondon | Cubs | -0.71 |
| 244 | Henry Rodriguez | – – – | -0.71 |
| 245 | Michael Kirkman | Rangers | -0.74 |
| 246 | Lucas Harrell | Astros | -0.81 |
| 247 | Luis Garcia | Phillies | -0.83 |
| 248 | Anthony Bass | Padres | -0.87 |
| 249 | Brandon League | Dodgers | -0.93 |
| 250 | Shawn Camp | Cubs | -1.03 |
| 251 | Curtis Partch | Reds | -1.42 |
Jim Leyland and Knowing When To Break Your Rules
I’ve long since come to terms with the fact that Jim Leyland is not a very good on-field tactician. He routinely misuses his relievers and bunts at weird times. On Saturday night, he made a very critical mistake that cost his team a chance to win. It wasn’t a mistake because of the result, it was a mistake because of the process. Let’s walk through it.
The Tigers entered the 9th inning down 1-0 with Greg Holland on the mound. Prince Fielder led off the inning with a walk. The tying run is on first base in the 9th inning and it’s Prince Fielder who is a below average runner. I love Prince, but he’s not a good baserunner. I know that, you know that, he probably knows that, and his manager knows that.
But Leyland didn’t pinch run. Martinez flied out and Dirks struck out to set up Infante. Prince Fielder stood on first while Hernan Perez and Danny Worth stood on the bench. Infante doubled and Prince was gunned down by a great relay by a step or two. The difference in this game was Leyland failing to run for Fielder. It’s obvious to see that this decision was costly, but it was a mistake long before it actually came to fruition.
Here’s the logic behind the mistake. First, Leyland has long said he won’t run for Fielder or (healthy) Cabrera. The basic premise is right. You shouldn’t pull your best hitters for pinch runners in most situations because the potential value of their later at bats is very high. However, this situation is the exact situation in which you must run for your slugger.
Down one in the 9th inning at home, you have to score at least once or you lose the game. That run is everything. You have to do everything you can to score that run and you worry about what might happen later, later. You have to maximize your odds of winning and you do that by putting the much faster Perez on first base. Whether or not Infante gets the hit doesn’t matter, it’s the right decision 10 times out of 10.
If it was a tie game, you leave Fielder in because you know you’re getting another at bat, but down a run you have to pinch run. The problem here isn’t this particular mistake it’s that an MLB manager should be ready for this situation. He’s clearly thought about the merits of pinch running for Fielder, but somehow he didn’t come to the conclusion that there is a single, glaring exception to the rule. You pinch run if that run is the difference between playing on and the game ending.
Leyland’s response to the postgame question was that he doesn’t pinch run for Fielder. (Note: I will update if one of the reporters posts more detailed comments,but so far I haven’t seen him display regret). The absolute nature of that statement is very concerning because while that rule is right most of the time, it isn’t right in this particular situation. Leyland should have been prepared for this. We aren’t talking about him deciding he liked a particular pinch hitter matchup that might involve intuition. This is pure, rational logic. There isn’t a case to be made for not pinch running, especially once we got to two outs and the chance at the two run inning was much smaller.
I don’t know how to properly weigh tactical skills and leadership skills in managerial evaluation, but this kind of mistake isn’t acceptable. And this isn’t the only mistake he’s made this year because he’s unwilling to break his rules. On multiple occasions he’s refused to go to Benoit in a tie game on the road because it wasn’t a save situation and the Tigers have been worse off for it.
The Tigers are still going to make the playoffs, but two weeks from now, the value of individual games is going to sky rocket and Jim Leyland’s poor decisions are going to be much more costly. Maybe his personal skills in the clubhouse make up for it, but that doesn’t excuse it. This isn’t a personal criticism. I have loads of affection for Leyland, but he needs to be better prepared for these situations or the Tigers are going to be disadvantaged in October. The occasional mistake is easy to overlook, but this is a pattern and it doesn’t appear as if he understands where he went wrong.
It’s not his fault the Tigers didn’t score in the first 8 innings, but when he was a given a chance to help the team win, he didn’t do it. Managers don’t often have a chance to make a big difference and you can’t let those opportunities slip away because you don’t know when to break the rules.
Updated 10:40pm: Via Matthew Mowery, Leyland had this to say:
“I’m not taking Prince Fielder out of the game. I’m not going to do it. It’s just the way it is. I’m not going to run for him….That’s the way I do it.”
So, that confirms that he doesn’t see the issue and the bad outcome tonight did not cause him to reflect on why this situation calls for him to break his rule.
How Was The Game? (September 14, 2013)
Brisk, but without success.
Royals 1, Tigers 0 (Magic # = 10)
To no one’s surprise, Doug Fister (30 GS, 193.2 IP, 3.67 ERA, 3.30 FIP, 4.2 WAR) and Ervin Santana hooked up for a pitchers’ duel tonight featuring very little offense and a pretty quick pace. Fister allowed a run on two hits in the first but was stingy the rest of the way giving the Tigers 7.2 innings of 1 run baseball featuring 6 K an 3 BB. The Tigers bats couldn’t do much against Santana and his pen despite an Infante double with a man on first in the 9th. The Tigers failed to score, however, as Leyland elected not to run for Fielder – who was on first – and it was the difference in the game as he was thrown out at home by about a step – a step that a pinch runner would have had on Fielder. It’s hard to quantify the effect managers have on games, but this was a clear time in which Leyland is squarely to blame. It makes sense not to lose Fielder in a tie game in the 9th or any time earlier, but if you don’t score the tying run in the 9th, the game ends. You have to pinch run. It’s bad strategy, pure and simple, and it’s a situation an MLB manager should be ready for from the first day of the season. Especially with expanded rosters. The Tigers will look to take the series Sunday afternoon with Max Scherzer (29 GS, 194.1 IP, 3.01 ERA, 2.71 FIP, 5.9 WAR) on the hill.
The Moment: Hunter guns down Getz at third in the 7th inning.
The Nine Worst Wins of 2013
If you’re here, you’ve likely been exposed to our series on pitcher wins and why we want to kill them. It’s become a pretty big topic of conversation around baseball and some people are calling for a cease fire because the win has been repeatedly slaughtered to the point that we’ve probably violated the Geneva Convention. So, I’ll make sure to avoid overdoing it because apparently #KillTheWin is sabr-bullying. If you’re new to the cause, check out the groundwork for why wins are a terrible statistic and then enjoy The Nine Worst Wins from 2013 (as of Sept 13th).
- You Can Have A Great Season and Not Win
- You Can Have A Bad Season and Win A Lot
- Wins Don’t Even Out in Big Samples
- A Case Study in Wins
- 12 Assorted Facts About Wins from 2013
- Dissecting the Case for Wins
- A Replacement for Wins
So the methodology is quite simple. Below are the pitchers in 2013 who have earned a “win” sorted by the lowest Win Probability Added (WPA). What WPA does is measure how much the team’s likelihood of winning changed as a result of every play and assigns that value to the pitcher and batter who took part. It’s not a perfect stat for measuring a player’s performance but it works for our purposes here for a simple reason. If a pitcher’s team scores 10 runs in the first inning, that pitcher can pitch poorly and get a win, but most of the pro-win alliance thinks that’s okay. They believe in something called “pitching to the score” which has been shown to be fiction. So in order to make the point clearly, I’ll use WPA which is entirely dependent on context. If you’re up 10, you’re allowed to give up 5. If you’re up 1, you better not give up two.
There are other ways to do this, but I think this is the most valuable way to do it given the audience still in need of persuasion.
| Rk | Player | Date | Tm | Opp | Rslt | App,Dec |
| 9 | Randall Delgado | 2-Aug | ARI | BOS | W 7-6 | GS-6 ,W |
| 8 | Brandon League | 31-May | LAD | COL | W 7-5 | 9-9 ,BW |
| 7 | CC Sabathia | 18-Aug | NYY | BOS | W 9-6 | GS-6 ,W |
| 6 | Alfredo Simon | 22-Apr | CIN | CHC | W 5-4 | 13-13f,W |
| 5 | Rafael Soriano | 17-May | WSN | SDP | W 6-5 | 9-9 ,BW |
| 4 | Matt Belisle | 28-Jul | COL | MIL | W 6-5 | 8-8 ,BW |
| 3 | Joe Smith | 26-Jun | CLE | BAL | W 4-3 | 8-8 ,BW |
| 2 | Michael Wacha | 19-Aug | STL | MIL | W 8-5 | 7-7 ,BW |
| 1 | Kyuji Fujikawa | 12-Apr | CHC | SFG | W 4-3 | 9-9f ,BW |
| Rk | Player | IP | H | R | ER | BB | SO | HR | Pit |
| 9 | Randall Delgado | 6 | 6 | 6 | 4 | 1 | 7 | 2 | 97 |
| 8 | Brandon League | 1 | 2 | 2 | 2 | 0 | 1 | 1 | 26 |
| 7 | CC Sabathia | 5.1 | 7 | 6 | 6 | 5 | 5 | 1 | 103 |
| 6 | Alfredo Simon | 1 | 1 | 2 | 1 | 0 | 1 | 1 | 15 |
| 5 | Rafael Soriano | 1 | 4 | 2 | 2 | 0 | 0 | 0 | 19 |
| 4 | Matt Belisle | 1 | 2 | 2 | 2 | 0 | 2 | 1 | 23 |
| 3 | Joe Smith | 1 | 3 | 2 | 2 | 1 | 0 | 0 | 21 |
| 2 | Michael Wacha | 1 | 4 | 3 | 3 | 0 | 1 | 1 | 30 |
| 1 | Kyuji Fujikawa | 1 | 3 | 3 | 3 | 0 | 0 | 0 | 30 |
| Rk | Player | ERA | RE24 | WPA |
| 9 | Randall Delgado | 6.00 | -2.939 | -0.392 |
| 8 | Brandon League | 18.00 | -1.479 | -0.404 |
| 7 | CC Sabathia | 10.12 | -3.472 | -0.410 |
| 6 | Alfredo Simon | 9.00 | -1.537 | -0.417 |
| 5 | Rafael Soriano | 18.00 | -1.594 | -0.430 |
| 4 | Matt Belisle | 18.00 | -1.479 | -0.431 |
| 3 | Joe Smith | 18.00 | -1.490 | -0.528 |
| 2 | Michael Wacha | 27.00 | -2.537 | -0.557 |
| 1 | Kyuji Fujikawa | 27.00 | -2.537 | -0.745 |
To date, there have been 282 wins in which the pitcher had a negative WPA in 2013. Above you’ve seen the nine worst including Fujikawa having just about the worst performance I could imagine in a win using this method. In fact, as far back as we have WPA data, it’s the 14th worst such win.
It looked like this! That’s pretty bad.

This is all by way of saying that wins aren’t a useful statistic and that even if we allow for the idea of pitching to the score, we still have a ton of ridiculous wins every season. If every win was handed out perfectly the rest of the season, we would still have seen 11.6% of the wins in 2013 go to pitchers who hurt their team’s chance to win.
#KillTheWinButDoItWithoutBeingSoDramatic
How Was The Game? (September 13, 2013)
The reckoning of Bruce Chen.
Tigers 6, Royals 3 (Magic # = 10)
The top of the order gave Justin Verlander (31 GS, 199.2 IP, 3.66 ERA, 3.41 FIP, 4.6 WAR) plenty of runs to work with thanks to good nights from Jackson, Hunter, Cabrera, and Fielder against the Bruce Chen. Verlander didn’t dazzle in any sort of Cy Young caliber way, but he gave the Tigers 6.2 solid innings of 3 run baseball featuring 7 strikeouts and no walks and continues to have the best “down year” anybody has probably ever had. The story of this one was the bullpen as Smyly came on and got the final out of the 7th and the first in the 8th before giving way to Veras who got one out but added two baserunners. It was Benoit who entered with four outs left, defying all logic. Somehow, a closer managed to finagle his way into a game earlier than the 9th inning out of Jim Leyland’s bullpen – and somehow – he didn’t blow it! He K’d Lough and then went through the 9th to close it out. The Tigers will try to take the series behind the vertically gifted Doug Fister (29 GS, 186 IP, 3.77 ERA, 3.31 FIP, 4.0 WAR).
The Moment: Benoit comes in with the bases loaded and two outs in the eighth inning and strikes out David Lough.
Austin Jackson’s Southpaw Problem

Austin Jackson is a pretty great baseball player. He’s not Miguel Cabrera or Mike Trout great, but he does a lot of things well. He’s averaged 3.4 WAR (what’s WAR?) per 600 plate appearances and has been as high as 5.2 in a season and never lower than 2.4. He plays excellent center field, runs the bases well and is something better than league average at the plate before you consider his position.
But unless you’re Austin Jackson’s mother or his dog, you don’t think he’s perfect. He used to strikeout a lot and he improved in that department and now just strikes out a bit more than average. If you look across the stat line, he’s a pretty good all-around player. If you look inside the numbers, there’s a very strange split developing this season. Let’s take a look:
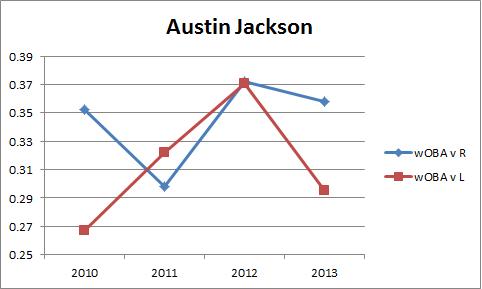
Remember that Austin Jackson hits right-handed. In his rookie season, he displayed a dramatic reverse platoon split. In 2011, it was a small and normal split. In 2012, it didn’t exist. In 2013, it’s back to being a crazy-big reverse platoon split. What’s going on here?
Let’s forget that 2010 happened, not because it didn’t, but because four years is a long time and it’s pretty likely that Jackson has grown as a player and isn’t the same hitter he was back then. Let’s just look at 2012 and 2013 in order to look for differences. What moved Jackson to struggle so much against southpaws this year?
First some basics:
| Split | PA |
| 2012 v R | 432 |
| 2012 v L | 185 |
| 2013 v R | 375 |
| 2013 v L | 167 |
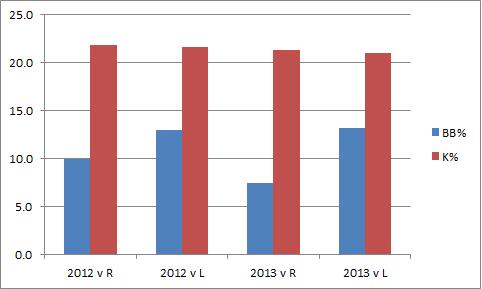

So first, the plate appearance distribution isn’t funky and he’s walking less against righties this year. Strikeouts are remarkably consistent. When you drop down to the second figure you can see how similar his production was across the board in 2012 and how different it is in 2013. If you notice the purple column, you’ll recognize that this issue is BABIP driven. So now the question is if this is luck or a problem?


You’ll notice a fairly even split in batted ball data in 2012 and in 2013 we see a drop off in line drives against lefties in favor of fly balls. So, Austin Jackson is hitting the ball in the air more often in against lefties in 2013 – and hitting fly balls instead of line drives will drop your BABIP. And a lower BABIP will hurt your production. Therefore, this is a real thing. What’s behind it?
If we hop over to Brooks Baseball, we can derive an interesting lesson. I won’t present all of the numbers because there are too many, but I’ll pull out the relevant data. First, he’s hitting fastballs and sinkers in the air more often this year against lefties and he’s putting a lot fewer sliders in play. And when he puts those sliders in play, they are all on the ground. He also hasn’t hit a single homerun on a fourseam, sinker, or slider against lefties this year.
So he’s putting more fastballs in play and he’s putting them in the air without leaving the yard and he’s putting fewer sliders in play and they’re all on the ground. That’s not a good combination.
To me, it says his timing is off and he’s out in front. If you’re out in front on a fastball, you’ll hit it in the air. If you’re out in front on a slider breaking toward you’re more likely to hit it into the ground. If you run a query for LHP throwing sliders to Austin Jackson that he hit on the ground – most are down and in. I’m not a master of GIFs, so I can’t show you clips or anything, but it will be something I’m looking for as the season winds down.
Jackson famously lost his big leg kick last year so it’s not outrageous to think some little mechanical issue could be messing with his ability to turn fastballs around rather than hit them in the air and the same mechanical issue could be getting him to roll over some sliders and swing through others. Hitting is about timing and pitching is about interrupting timing.
Jackson doesn’t seem to be having much of an issue with righties and it should be easier to pick up pitchers from lefites, so it seems logical that there’s something about lefties this year that he’s miss-timing. When you’re dealing with fewer than 200 PA against southpaws, you only need a few fly balls to turn into line drive hits for this to even out. Jackson needs to be better against lefties, but there’s also no reason to think he can’t be better against them.
He hit them last year with no problem and if he had a serious problem with his health or swing it would show up against righties. I’m not worried about him long term. This looks like a short term issue that he will have the ability to correct with a little bit of work. He’s having a good season overall and has hit well over the last 30 days (.311/.393/.443) so this isn’t some terribly detrimental problem that’s ruining the Tigers. It just catches your eye because it’s surprising that a player this good would have such a funky platoon split, but he does. Now why have some understanding of why that might be the case.
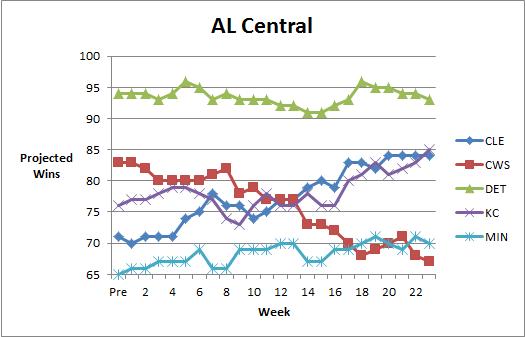
Dynamic Standings Projection (September 12, 2013)
In case you missed it, in April we launched our Dynamic Standings Projection feature on New English D. A full explanation of the methodology can be found here or by clicking the tab at the top of the page. This project seeks to provide a reasoned and cautious approach to updating our beliefs about the baseball future. You can find a summarization of the original projections here. You’ll notice a column on the far right that indicates the difference in projected wins from the preseason prediction. Positive numbers mean teams are now projected to win more games and negative numbers mean a team is now projected to win fewer games. You’ll notice a series of graphs below the standings section that track how the projections have evolved over the course of the year.
This Dynamic Standings Projection is updated through the September 11th games. Note that DSP posts have been moved to Thursday accommodate something that won’t interest you.
| 12-Sep | W | L | PreDiff | |
| BOS | 96 | 66 | 0.593 | 19 |
| TB | 88 | 74 | 0.543 | -3 |
| NYY | 86 | 76 | 0.531 | 1 |
| BAL | 86 | 76 | 0.531 | 4 |
| TOR | 76 | 86 | 0.469 | -11 |
| W | L | PreDiff | ||
| DET | 93 | 69 | 0.574 | -1 |
| KC | 85 | 77 | 0.525 | 9 |
| CLE | 84 | 78 | 0.519 | 13 |
| MIN | 70 | 92 | 0.432 | 5 |
| CWS | 67 | 95 | 0.414 | -16 |
| W | L | PreDiff | ||
| OAK | 93 | 69 | 0.574 | 9 |
| TEX | 91 | 71 | 0.562 | 0 |
| LAA | 78 | 84 | 0.481 | -10 |
| SEA | 72 | 90 | 0.444 | -3 |
| HOU | 56 | 106 | 0.346 | -4 |
| W | L | PreDiff | ||
| ATL | 96 | 66 | 0.593 | 6 |
| WSH | 86 | 76 | 0.531 | -9 |
| PHI | 76 | 86 | 0.469 | -8 |
| NYM | 73 | 89 | 0.451 | -5 |
| MIA | 61 | 101 | 0.377 | -2 |
| W | L | PreDiff | ||
| STL | 94 | 68 | 0.580 | 6 |
| PIT | 93 | 69 | 0.574 | 11 |
| CIN | 92 | 70 | 0.568 | 0 |
| MIL | 71 | 91 | 0.438 | -8 |
| CHC | 69 | 93 | 0.426 | 1 |
| W | L | PreDiff | ||
| LAD | 94 | 68 | 0.580 | 6 |
| ARZ | 82 | 80 | 0.506 | 0 |
| SF | 75 | 87 | 0.463 | -16 |
| SD | 75 | 87 | 0.463 | -3 |
| COL | 73 | 89 | 0.451 | 10 |


How Was The Game? (September 11, 2013)
Another great one from Sanchez.
Tigers 1, White Sox 0 (Magic # = 11)
Anibal Sanchez (26 GS, 165.2 IP, 2.50 ERA, 2.47 FIP, 5.6 WAR) followed Rick Porcello’s lead and gave the Tigers 7.1 great innings of shutout baseball featuring 10 strikeouts and 3 walks as he continued to roll passed AL offenses and into the back end of the Cy Young race with a couple of starts left. The Tigers bats had some chances in this one but it took them 8 innings to push across their first and only run thanks to an Infante RBI single that plated Prince Fielder. Veras, Smyly, and Benoit held serve in the 8th and 9th and the Tigers jumped back up to 6.5 ahead of the Cleveland Indians with Justin Verlander (30 GS, 192.2 IP, 3.64 ERA, 3.49 FIP, 4.1 WAR) getting the ball to start the final homestand on Friday.
The Moment: Infante pushes across the Tigers only run with a single through the left side.
How Was The Game? (September 10, 2013)
Finally a chance for Porcello to finish what he started.
Tigers 9, White Sox 1
After a disappointing game on Monday, the Tigers struck back and struck back hard with a great performance by Rick Porcello (27 GS, 162 IP, 4.56 ERA, 3.72 FIP, 2.5 WAR) and some big hits that capitalized on some horrible White Sox defense. Fielder was on base four times and Avila made it to first five times while eight different Tigers touched home plate en route to the big win than included three errors from Conor Gillaspie and one more from Paul Konerko for good measure. But the story on this night was the man on the mound. Porcello gave the Tigers 9, 1 run innings with one walk and 4 strikeouts while retiring the final 17 he faced as he notched his first career complete game in his 147th career start. It was just the third for the Tigers this year, courtesy of Jim Leyland’s personal vendetta against allowing a starter to pitch the ninth inning. Win number 83 leaves the Tigers 5.5 games up in the AL Central with 17 to play and Anibal Sanchez (25 GS, 158.1 IP, 2.61 ERA, 2.49 FIP, 5.2 WAR) on the mound trying to take the series on Wednesday.
The Moment: Rick Porcello gets a chance to go the distance and doesn’t disappoint.
