How Was The Game? (July 11, 2013)

Wild.
White Sox 6, Tigers 3
This game was quite something. The particulars are that the Tigers gave up an early run, came back with two homers to take a 3-1 lead, then allowed a grand slam and solo homerun to give back the lead. Anibal Sanchez (7-6, 92 IP, 2.93 ERA, 2.31 FIP, 3.3 WAR) in sum, was a bit uneven allowing 5 runs (4 earned) across 5.1 innings, but he did strikeout six. However, the story of this game was a bit more than the above information, which could easily be gleaned from the box score. Let’s take a look:
- Immediately following Cabrera’s homerun, Chris Sale threw a pitch up and in to Prince Fielder.
- Prince was upset, but not confrontational. Leyland yelled at the umpire from his seat in the dugout.
- No warnings were issued.
- After Sanchez gave up some runs in the 6th, Putkonen came in and threw behind Ramirez, the second batter he faced.
- Ramirez started coming to the mound, pointing and yelling.
- Putkonen was ejected.
- The benches cleared.
- Leyland was ejected.
- Everyone went back to their benches.
- Leyland kept arguing.
- The benches were warned.
- Leyland finally realized he was ejected.
- The fans booed Ramirez during the rest of the at bat.
- Ramirez hurt himself running to first base.
So while the 14 lines above can nicely summarize it for anyone who missed it, it’s also important to evaluate the situation. I think Sale’s pitch was intentional and I don’t advocate throwing at anyone or fighting in baseball. However, the umpires have a responsibility to warn the benches to prevent further issues. Also, Putkonen did a nice job making sure the pitch was behind Ramirez and down near his backside, assuring there would be no injury. If the umpires want to effectively police this stuff, which they should, you have to issue warnings earlier and you can’t eject someone for throwing behind a guy when you haven’t issued warnings. Basically, Sale shouldn’t have done that, the umpires handled it like idiots, Putkonen did a nice job not to make his pitch dangerous, and the players on both sides did a nice job by not resulting to punches and whatnot. All in all, the Tigers lost 2 of 3 to the Sox, but Chris Sale is a legitimate ace, so you can’t be too upset about this one. They’ll have 15 more chances to beat the Sox, but they’ll turn their attention to the Rangers, who will see Doug Fister (6-5, 115 IP, 4.07 ERA, 3.30 FIP, 2.6 WAR) Friday at Comerica Park.
The Moment: Jim Leyland gets his money’s worth arguing the umpire’s terrible game management.
Victor Martinez Returns Despite Never Leaving
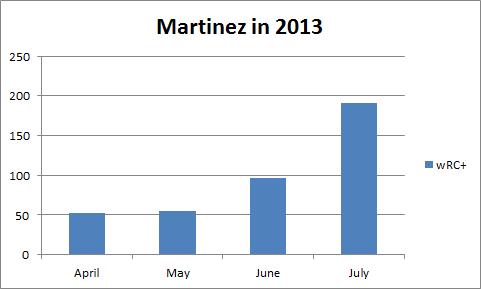
Victor Martinez’s early season statistics weren’t good. Most were pretty bad. He wasn’t getting on base, he wasn’t hitting for power, and because he plays a position that doesn’t utilize a glove, he wasn’t adding value on defense in the way Andy Dirks has done during his own offensive struggles.
But seemingly all of a sudden, Martinez is crushing the baseball. In the last 30 days, Martinez has a very respectable 112 wRC+ (what’s wRC+?). In the last 14 days he has a 170 wRC+. In the last 7 days, it’s 209. That is what the average person would describe as a trend, or perhaps a hot streak. Regardless of the cause or the sustainability of this performance, anyone can look at his numbers and recognize that Martinez’s performance is getting better.
I wrote earlier this year that Victor Martinez was having a particularly extreme case of terrible luck on hard hit balls. He was among the top handful of players in the game at making hard contact, but his batting average and power numbers didn’t reflect that. In fact, he was the only one near the top of the list who wasn’t hitting well above league average.
It made no logical sense that Martinez would make so much hard contact and not reap the rewards. It wasn’t really happening to any other hitter and it doesn’t really happen all that often in general. Hard contact is very highly correlated, and likely the cause of success in the batter’s box. But it wasn’t happening for Martinez?
Why?
The answer is actually so simple that it’s hard to grasp. Nothing was happening. Victor Martinez was doing nothing wrong. He wasn’t chasing bad pitches, he wasn’t hitting a dramatic number of popups or anything. Victor Martinez was the victim, if you can call it that, of something we statisticians call random variation.
Think of it this way. If a player’s true talent level is a .300 batting average, that means that over the course of the season, he’ll get 3 hits for every 10 at bats. But it doesn’t mean that he’ll get 3 hits in EVERY 10 at bats (that would mean performance uniformly distributed). Sometimes he’ll get 2, sometimes he’ll get 4. Sometimes he’ll get 8 and sometimes he’ll go 0 for 15.
Statistics are excellent and wonderful and we love to use them to measure things, but they have to be used properly. You have to understand what they mean. When Martinez was hitting .210, it meant to date he had gotten about 2 hits in every 10, but it didn’t mean that was his true talent level. He’s a .300 hitter in his career, this window was just a low point. A period of “bad luck” if you want to call it that.
Random variation means, in a simple sense and nontechnical sense, that the smaller a sample you look at the higher the likelihood is that you’re observing something that doesn’t reflect reality. Miguel Cabrera gets a hit around 33% of the time in his career, but if you look at any 3 at bats, you’re likely to see him have 0, 2, or 3 hits. That’s how sample size works.
This relates to Martinez because the underlying information about Martinez went unchanged during the slump. He wasn’t chasing pitches and he was making hard contact. The walk and strikeout rate looked fine. Good swings were turning into outs way more frequently than they usually do for him or for anyone.
And then all of a sudden it stopped. Somewhere in the last four to five weeks, Martinez just started getting those swings to turn into hits and he’s climbed all the way up to a .254/.311/.367 line after a .221/.290/.274 line in April. He’s not a different player, he’s just getting his hits to drop now and he wasn’t then. He’s taken two and half months of bad stats and is slowly erasing them.
His numbers were awful. Now they are amazing. Only two things can be responsible for that. One is a change in skill, health, or approach – none of which are evident. The other is a change in fortune – which appears likely. Victor Martinez is the poster child for a concept called “regression to the mean.”
Regression to the mean is an idea that suggests, in baseball, that when a player does something much better or worse than his previous career average it’s likely that he’s going to regress toward the previous average more often than he moves further into the extremes. You can think of regression to the mean as the correction in random variation over large samples.
In a small sample, anything can happen, but if you give something enough time, it will show its true colors. I’m boiling down a complex statistical concept, so well-versed statisticians shouldn’t analyze the wording too literally, but the amazing tear Martinez is on is essentially like the universe balancing out the really unlucky stretch he had.
It really is that simple. Take a look at his monthly performance:
It’s getting much better, sure. But there is something in the batted ball data I want you to see. This is a bit cluttered, but take a look.
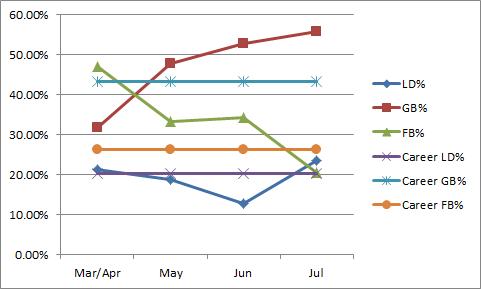
He was hitting fewer groundballs than normal in April, and now he is hitting more to compensate. He was hitting fewer than normal line drives for the first three months, now his is hitting more. He was hitting way more flyballs that normal to start the year, now he’s hitting fewer. Everything is correcting itself. It’s not that he is now hitting like the career averages he set for himself, it’s that he’s now playing at the other extreme to balance out what happened before. The process for Martinez was good, but the results we all out of whack. Now the process is the same and the results are good.
This is a simple case of regression to the mean. There wasn’t anything wrong with Martinez that time couldn’t fix. The Tigers did just fine while he was “struggling” and now they’re getting the hot-hitting version of him as the race gets going.
In general, this should be a lesson to you that surface statistics can be deceiving. If you thought Martinez was a good hitter entering the season, you shouldn’t change your opinion so quickly when he has a low batting average for six or eight weeks. Almost always, unless a player is hurt (he never looked hurt), he will regress to the mean. He may not ever have the season he had in 2011, as that was likely his career year as a hitter, but he will look very much the player you expected. He’s been a 120 or so wRC+ hitter for most of his career and there is no reason not to expect something around 110 now that he is entering the downswing of his career.
Enjoy Victor’s hitting streak and power explosion now because you certainly earned it while he wasn’t getting hits. It’s often hard to take a step back and see the world with a wide angle lens, but it’s something we should do a lot more often.
The Morning Edition (July 11, 2013)
From Last Night:
- Wheeler great, Cain awful in a big Mets win
- Another great start for Turner in Miami
- The Angels unload on the Cubs, get a good start from Wilson
- Lee gives up four solo homeruns in a loss to the Nationals
- Toronto tops Cleveland after a wild 9th
- Nova and the Yanks handle the Royals easily
- Twins and Rays play deep into the night, Zobrist walks off
What I’m Watching Today:
- Sale and Sanchez in Detroit (1p Eastern)
- Zimmermann goes against the Phils (7p Eastern)
- Bumgarner (underrated) and Marquis (overrated) face off in Petco (10p Eastern)
The Big Question:
- How should we pick the ASG starter?
There’s been some debate, as there always is regarding ASG stuff, as to who should start for each side. Harvey is the frontrunner in the NL because he is having one of the best seasons and the game is at his home park. It’s not a lock that he should start on merit, but he’s in the conversation and the hometown thing probably pushes him over. I think it’s safe to say Harvey, Wainwright, and Kershaw are the contenders, but depending on what stats you like, you can make a case that any of them are the best starter so far. But should it be about the best starter so far this season? Should it be about the best starter for the last calendar year? The biggest star? The guy who we judge to be the best, because the game does count? It’s not a clear formula. For what it’s worth, Wainwright is schedule to pitch Sunday so he’s probably out. Kershaw and Harvey are both “stop what you’re doing and watch guys” who are having elite years and are top 10 guys since the last ASG. If you’re asking for six outs, they can both get them with the best of them. Is there really a way to separate who should get the start if we don’t have a fixed definition. If Kershaw was far and away having a better season, it might be different, but they’re pretty even, so it just makes sense to go with Harvey…I think. Kershaw’s about to get $200 million. Harvey could have that in his future, but he has more work to do. Let’s go with Harvey.
How Was The Game? (July 10, 2013)
A nice response.
Tigers 8, White Sox 5
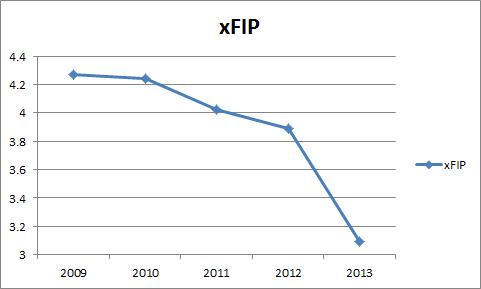
After Tuesday’s disastrous final two innings, the Tigers put together a much better game on all fronts. They got a solid outing from Rick Porcello (6-6, 99.1 IP, 4.80 ERA, 3.53 FIP, 1.8 WAR) who allowed 3 runs in 6 innings while striking out six batters and walking none to make his season long transformation look even better by the numbers we’ve been tracking here at New English D. Here’s currently 7th among MLB starters in xFIP (learn about xFIP) and is joined only by Felix Hernandez and John Lackey as starters with more than 7 K/9, fewer than 2 BB/9 and a GB% higher than 50%.:

But it wasn’t just Porcello who carried the Tigers. They also got tons of production from the middle of the order as Jackson, Hunter, Cabrera, Fielder, and Martinez all had multi hit games that helped the Tigers score in 4 separate innings. It was an all-around solid attack save for an iffy inning from Rondon who somehow managed to produce an inning with a K, BB, 1B, 2B, HR, GO (2), and WP (2). That’s almost everything that can happen!
Rondon’s inning wouldn’t be too costly as he held the Sox to two runs and Drew Smyly came in for the 8th inning and made very quick work of the three batters he faced, giving way to Benoit who handled the 9th. It was a nice game all-around and gives the Tigers their 50th win and a shot to take the series behind Anibal Sanchez (7-5, 86.2 IP, 2.70 ERA, 2.11 FIP, 3.4 WAR) on Thursday afternoon.
The Moment: Porcello freezes Gillaspie on a curveball for his final strikeout.
A Case Study in Wins
To bring you up to speed I’ve been laying out evidence over the last few weeks in an effort to help banish the pitcher win as a method for measuring individual performance. I’ve covered a number of topics such as:
- Pitchers who had great seasons and didn’t win
- Pitchers who had below average seasons and won a ton
- These numbers not balancing out over an entire career
The simple complaint with the win statistic is that it doesn’t measure individual performance but is used by people to reflect the quality of an individual. Wins are about pitchers, but they are also about run support, defense, the other team, and luck. We shouldn’t use such a blunt tool when measuring performance when we have better ones. I’ve provided a lot of evidence in the links above supporting this claim, but those have posts about the best and worst and about career long samples. Today, I’d like to offer a simple case study from 2012 to illustrated the problem with wins.
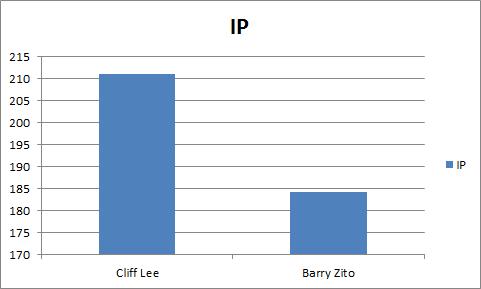
The faces I’ll put on this issue are Cliff Lee and Barry Zito, both of whom appeared on the lists above.
Let’s start with some simple numbers from their 2012 campaigns to get you up to speed. Lee threw more than 25 more inning than Zito and performed better across the board:
Lee had a much higher strikeout rate and much lower walk rate.

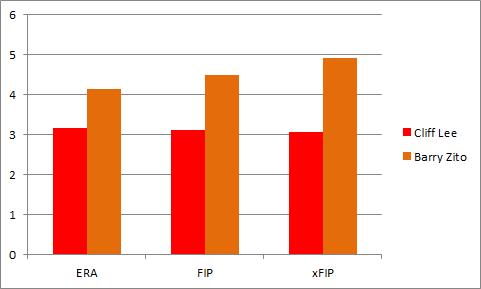
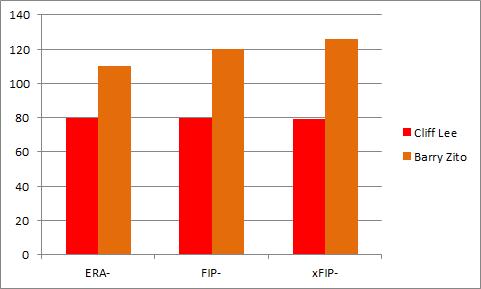
Lee had a lower ERA, FIP, and xFIP and if you prefer those numbers park and league adjusted, they tell the same story:
If you’re someone who likes Wins Above Replacement (WAR) or Win Probability Added (WPA) it all points in Lee’s favor as well:

By every reasonable season long statistic, Cliff Lee had a better season than Barry Zito. If you look more closely, you can see that Lee had a great year and Zito had a below average, but not terrible season. There is simply no case to be made that Barry Zito was a better pitcher than Cliff Lee during the 2012 season. None.
But I’m sure you can see where this is going. Cliff Lee’s Won-Loss record was 6-9 and Barry Zito’s was 15-8. Lee threw more innings, allowed fewer runs per 9, struck out more batters, walked fewer batters, and did just about everything a pitcher can do to prevent runs better than Barry Zito and he had a much worse won-loss record. Something is wrong with that. Let’s dig a bit deeper and consider their performances in Wins, Losses, and No Decisions.
Let’s start with something as simple as ERA. In Wins, Losses, and ND, Cliff Lee allowed fewer runs than Zito despite pitching his home games in a park that skews toward hitters and Zito in a park that skews toward pitchers:

In fact, Lee’s ERA in Losses is almost identical to Zito’s in No Decisions. He allowed the same number of runs when he pitched “poorly” enough to lose as when Zito pitched in a “neutral” way. If we take a look at strikeout to walk ratio, it looks even more lopsided:
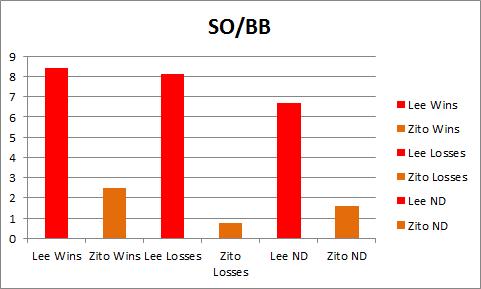
Lee way outperforms Zito in the measure even if you put Lee’s “worst” starts up against Zito’s “best” ones. Let’s take a look at OPS against in these starts, and remember, Lee pitches in a hitters’ park and Zito in a pitchers’ park:
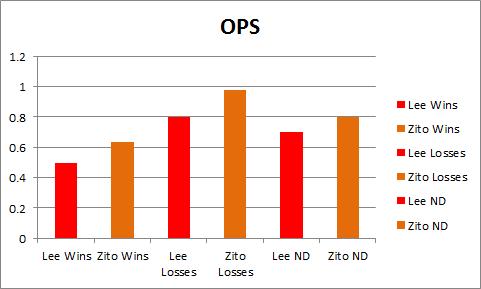
Again we find that Lee pitches as well in Losses and Zito does in No Decisions and performs much better across the board. Not only does Lee allow fewer runs in each type of decision, he has a better K/BB rate, and a lower OPS against in pitching environments that should favor Zito.
Everything about their individual seasons indicates that Cliff Lee had a much better season than Barry Zito and when you break it down by Wins, Losses, and Decisions, it is very clear that Lee performed better in all of these types of events. Lee was unquestionably better. No doubt. But Lee was 6-9 and Zito was 15-8. Zito won more games and lost fewer.
If we look at the earned run distribution, you can clearly see that Lee was better overall, on average, and by start:

You likely don’t need more convincing that Lee was better than Zito, in fact, you probably knew that from the start. Lee was better in every way, but Zito’s record was better. How can wins and losses be useful for measuring a player when they can be so wrong about such an obvious case?
Cliff Lee prevented runs better than Zito last season. He went deeper into games. More strikeouts, fewer walks, lower OPS against in a tougher park. He was better than Zito in Wins, Losses, and ND and often better in Losses than Zito was in ND. How can this be? It’s very simple. Wins and Losses aren’t just about the quality of the pitcher, not by a long shot. Even ignoring potential differences in defensive quality (Giants were slightly better) and assuming pitchers can control every aspect of run prevention it still isn’t enough. Lee was better and had a worse record. What good is a pitching statistic if it is this dependent on your offense? It isn’t any good.
Here friends, are their run support per 9 numbers. This should tell you the whole story:

The Giants got Zito 6 runs a game on average and the Phillies got Lee 3.2. It didn’t matter that Lee way out pitched Zito, he still had no shot to win as many games because the Giants scored runs for Zito and the Phillies didn’t score for Lee. The Giants during the entire season scored 4.4 runs per game. The Phillies scored 4.2. This isn’t as easy as saying that pitchers on better teams win more often. Lee’s team scored much less for him on average and the Giants scored much more for Zito on average.
You can’t just say that a pitcher with a great offense will win more often, it comes down to the precise moments in which they score. How can that possibly have anything to do with the pitchers this statistic hopes to measure? It can’t.
If my global evidence about the subjectivity and uselessness of wins didn’t get you, I hope that this has. There is no justification for using wins to measure pitchers when something like this can happen. Lee was much better than Zito in every way, but if you’re using wins and losses, you wouldn’t know it.
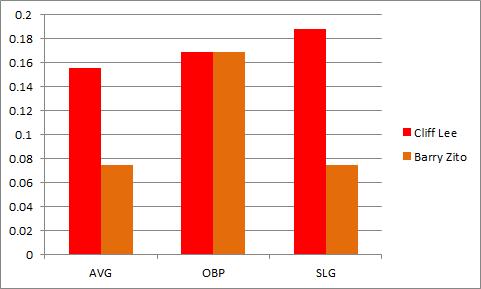
And, just in case you were wondering, Lee was a better hitter too.
The Morning Edition (July 10, 2013)
From Last Night:
- Hamels twirls a gem against the Nats
- CC goes the distance, but Shields and the Royals hold off the Yanks
- Josh Johnson has a good day, but the Tribe shut out his Jays
- Machado homers, but the Rangers beat the O’s 8-4
What I’m Watching Today:
- Jacob Turner takes the hill (1230p Eastern)
- Wheeler and Cain (330p Eastern)
- Gio and Lee from the left side (7p Eastern)
- Miller faces the Astros, strikeout warning in effect (8p Eastern)
The Big Question:
- How much should we care about pitcher-hitting?
Dave Cameron threw out some tweets today regarding the (false) perception that the Pirates can’t hit citing that they are 11th in MLB in non-pitcher wRC+. However, their pitchers are comically and historically bad, as Jeff Sullivan noted earlier this year. So while the Pirates non-pitchers are almost in the top 3rd in wRC+, they fall off a bit when you add in their pitchers and are in the bottom third in runs scored. PNC is a pitchers park, but not in an extreme way. All told, it got me thinking. We don’t really think of pitchers as part of the offense, but they get 2-3 PA a game and can have a meaningful impact on the outcome of a game. I think it might be time to either add the DH to the NL or start seriously considering how much a team can benefit from pitchers who are good at hitting. We tend to brush it off, but might their be something to paying attention to how well a pitcher can hit? I don’t know, but it got me thinking.
Dynamic Standings Projection (July 10, 2013)
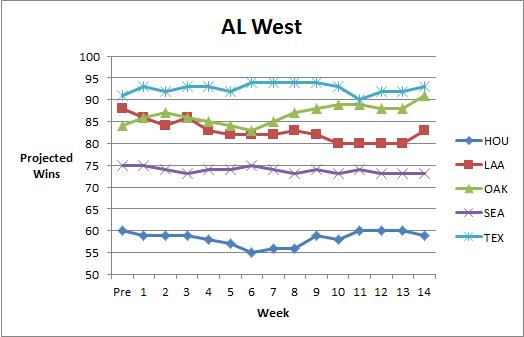
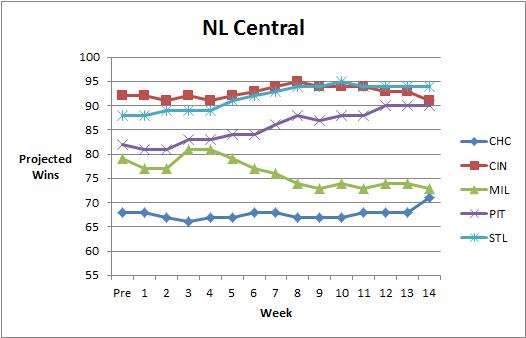
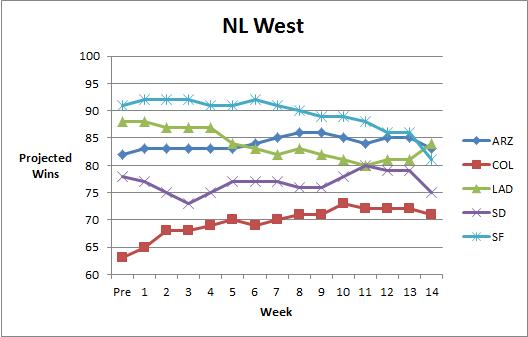
In case you missed it, in April we launched our Dynamic Standings Projection feature on New English D. A full explanation of the methodology can be found here or by clicking the tab at the top of the page. This project seeks to provide a reasoned and cautious approach to updating our beliefs about the baseball future. You can find a summarization of the original projections here. You’ll notice a column on the far right that indicates the difference in projected wins from the preseason prediction. Positive numbers mean teams are now projected to win more games and negative numbers mean a team is now projected to win fewer games. You’ll notice a series of graphs below the standings section that track how the projections have evolved over the course of the year.
This Dynamic Standings Projection is updated through the July 9 games.
| 10-Jul | W | L | PreDiff | |
| TB | 91 | 71 | 0.562 | 0 |
| BOS | 88 | 74 | 0.543 | 11 |
| NYY | 86 | 76 | 0.531 | 1 |
| BAL | 85 | 77 | 0.525 | 3 |
| TOR | 82 | 80 | 0.506 | -5 |
| W | L | PreDiff | ||
| DET | 91 | 71 | 0.562 | -3 |
| CLE | 79 | 83 | 0.488 | 8 |
| KC | 78 | 84 | 0.481 | 2 |
| CWS | 73 | 89 | 0.451 | -10 |
| MIN | 67 | 95 | 0.414 | 2 |
| W | L | PreDiff | ||
| TEX | 93 | 69 | 0.574 | 2 |
| OAK | 91 | 71 | 0.562 | 7 |
| LAA | 83 | 79 | 0.512 | -5 |
| SEA | 73 | 89 | 0.451 | -2 |
| HOU | 59 | 103 | 0.364 | -1 |
| W | L | PreDiff | ||
| ATL | 92 | 70 | 0.568 | 2 |
| WSH | 88 | 74 | 0.543 | -7 |
| PHI | 82 | 80 | 0.506 | -2 |
| NYM | 75 | 87 | 0.463 | -3 |
| MIA | 60 | 102 | 0.370 | -3 |
| W | L | PreDiff | ||
| STL | 94 | 68 | 0.580 | 6 |
| CIN | 91 | 71 | 0.562 | -1 |
| PIT | 90 | 72 | 0.556 | 8 |
| MIL | 73 | 89 | 0.451 | -6 |
| CHC | 71 | 91 | 0.438 | 3 |
| W | L | PreDiff | ||
| LAD | 84 | 78 | 0.519 | -4 |
| ARZ | 83 | 79 | 0.512 | 1 |
| SF | 81 | 81 | 0.500 | -10 |
| SD | 75 | 87 | 0.463 | -3 |
| COL | 71 | 91 | 0.438 | 8 |


How Was The Game? (July 9, 2013)
Good, until it got weird.
White Sox 11, Tigers 4
After a forty minute rain delay, the Tigers got under way and the first 7 innings were a nice, breezy pitchers’ duel between Justin Verlander (9-6, 119 IP, 3.71 ERA, 3.22 FIP, 2.9 WAR) and Jose Quintana, but the 8th inning wasn’t. The Sox would send 13 men to the plate, chasing Verlander after the first 5 and obscuring what looked to be a very solid start. He finished with 7 IP, 12 H, 5 R, 1 BB, and 3 K, but it easily could have been much cleaner if not for the 8th. The Tigers put up 2 more of their own in the 8th on a Cabrera homerun to left center and a Kelly homerun in the 9th, and made it a little closer, but the cats couldn’t claw all the way back against the solid White Sox staff and then watched the Sox scratch across a few more in the 9th. It’s not a surprise that the Sox limited the Tigers offense, it’s a surprise that they scored themselves (they’re the AL’s worst offense). Not to fear, as the Tigers send Rick Porcello (5-6, 93.1 IP, 4.82 ERA, 3.55 FIP, 1.7 WAR) to the mound on Wednesday to even the series.
The Moment: The Tigers double up De Aza on a popup…in foul territory.
Why You Should Give Sabermetrics A Try
A lot of ink has been spilled over the old-school versus new school debate in baseball analysis and while I’m decidedly on the new school side of things, I firmly believe that the reasons we have a difficult time winning converts is because we’re often too quick to act like our views are obviously the right ones. This isn’t a matter of sabermetricians getting the wrong answers, but we don’t often do enough to make our findings clear to the public. Sometimes we get caught up talking to each other and not talking to everyone.
Don’t get me wrong, I love Fangraphs and other sabermetric heavy sites, but we don’t always do the best job of making the basic principles clear. When someone writes a great post at Fangraphs, they don’t explain why they use wOBA instead of OPS or batting average, they take it as a given and expect the reader to know why or to look it up. Which makes less informed baseball fans weary. It’s not that they’re stupid, I don’t think that at all, it’s that they haven’t been given a proper explanation for why we think what we think on this side of the debate.
The sabermetric community offers a lot of resources that explain statistics, but we leave the curious fan with little guidance. It’s not hard to tell why some people here us talking about Wins Above Replacement and start thinking we’re nuts. It’s out job to explain what we’re doing and it’s our job to sell the message correctly. We’ve done so much groundwork in baseball research that we often forget that a new person is learning about the value of walks everyday, and that’s something we just take as a given.
Which is why it’s important for baseball analytics to have a public relations aspect of it too. Brian Kenny from MLB Network and NBC Sports Radio is a great voice for that part of the task. He’s done excellent work bringing sabermetrics into the mainstream of sports coverage. Plenty of others do excellent work on the matter, but he’s made it a mission.
At New English D, we’d like to be a part of that, and often publish basic explanations of sabermetric stats and principles while also pointing out some flaws in the basic stats. Today, I’d like to do something different. Today, I’d like to explain why you should give sabermetrics a try, period. I don’t care how skeptical you are, give me the next 5 minutes.
Here are 5 reasons:
1) The basic statistics were crafted during another era.
Batting average, runs, RBI, SB, wins, ERA, and the other statistics you’re familiar with quite readily were invented in the 1920s to keep track of what happened on the field. They are scoring statistics to record exactly how the game progressed. They’re descriptive and that is great. You can look at a box score and see exactly who was on base and who was at the plate when each run scored, but you can’t always tell which players were most responsible for the win or loss. These stats don’t tell you that much about value. It’s not because these stats are stupid, it’s because they didn’t have calculators and computers to do calculations when these numbers were invented. When you’re using a slide rule or pen and paper to track stats, things have to be simple. They don’t have to be simple anymore because we have the power to compute more information. It doesn’t mean getting a hit with a runner on second isn’t important, it means RBI is a crude way to measure that skill.
2) Progress is good.
Sabermetricians have introduced many new statistics into the world in the last couple decades, and while that might seem unseemly and cluttered, it’s actually no different than anything else. We didn’t use to fly on airplanes or drive cars, we didn’t used to be able to watch any baseball game on the internet. Heck, we didn’t even have the internet until the 1990s. No one is running around telling everyone to write more letters and put them in mailboxes, we have all pretty much embraced e-mail, texting, and instant messaging. Communication got better and more efficient. We’re better off. Baseball analysis is the same way. These new stats tell us more about baseball than we used to know. Players who walk a lot used to be really undervalued until someone with a computer looked at a lot of baseball games and realized that getting on base is really good, whether you get on via a hit or a walk. Things get better when we develop new technologies. You wouldn’t disable your internet connection, don’t immediately shut out new stats.
3) We’re asking the same questions.
Sabermetricians and traditional analysts both care about what leads to wins. Traditional analysts tend to just focus on who wins and loses and reverse engineer the explanations, but sabermetrics is just breaking it down a different way. Let’s go through a little thought experiment:
- How do you win? You score more runs than the other team.
- How do you score more runs than the other team? You score runs and you prevent runs.
- How do you score runs? You get on base.
- How do you get on base? You get a hit or you walk.
- How do you prevent runs? You don’t let the other team get on base.
- How do you keep them off the bases? You don’t allow hits or walks.
- How do you prevent hits? Don’t let them put the ball in play or hit homeruns, so strikeouts are good. You can also induce groundballs and use your defense if they are good.
When you think about the question like that, you realize we’re all asking the same thing. Sabermetricians break it down into how you score and prevent runs and they look for what leads to both of those outcomes. It’s nothing devious or nerdy. It’s 100% about scoring runs and preventing them. We’ve just looked at enough data to know which actions lead to both and which actions don’t. Sometimes there is luck involved and you can’t predict luck. We’re all about playing the odds. That’s no different from anything else, it just looks different because we’re using numbers instead of intuition.
4) More information is good.
Even if you like the old statistics, that doesn’t mean the new ones are wrong. If a player has a high batting average, that tells you something about their performance. But so does their on base percentage. So does their slugging percentage. So does Weighted On Base Average (wOBA). So does Wins Above Replacement (WAR). It’s all information about the players and teams. Sabermetricians like these new stats for a reason. The reason is that they tell us something the other statistics do not. Batting average is fine, but it doesn’t tell you if the player is getting on base via a walk. You might not think walks are as good as hits (we don’t either!), but walks are WAY BETTER than outs. Batting average pretends walks don’t exist and we think that’s silly. RBI tells you how many runs a batter has driven in, but it doesn’t tell you how many opportunities that batter has to drive someone in. It’s not fair to Joey Votto that he hits behind Zack Cozart and Prince Fielder gets to hit behind Miguel Cabrera. Those two players are in different contexts. Sabermetrics likes to provide context neutral information. Players can only control certain aspects of the game and we don’t think it’s right to judge a player on things outside of his control. This is especially true for pitchers, who can’t control how much run support they get, how well their defense plays, or which pitcher is on the mound for the other team. Sabermetrics looks at that and says, wins aren’t a great way to measure a pitcher’s performance because most of what leads to a win is out of their control. Let’s look at what is in their control and see how well they do at that.
5) The logic is exactly the same.
When you look at RBI or Wins or Batting Average to judge a player, you’re using statistical information to make an inference about how good that guy is. You’re taking information recorded in the past to make a claim about the present and future. It doesn’t matter if you’re using your eyes during an at bat or a spreadsheet in January, the logic is the same. Past behavior informs predictions about the future. For sabermetricians, we’re just using a lot more information because we have found that using more information and certain kinds of information tends to help make better inferences. For example, this is where the tired phrase “small sample size” comes into play. We’ve looked at a ton of data and see that a really good batting average over a ten day stretch doesn’t predict what the player will do on day 11 very well. For statistics to reflect true talent, you needs bigger samples. It’s simple logic and you use it every day. If you think a player is about average and then they have two great days, how much do you change your mind? Not much. If you think a player is average and they have six great months, how much? Probably a lot more. Sabermetrics isn’t any different than that, it’s merely crunching the numbers to give us a better estimate about when information starts to become meaningful.
—
If you think about it like that, sabermetrics aren’t that foreign or nerdy. You might need to be a nerd to program a computer to spit out an answer to a question, but you don’t have to be anything but curious to understand what the answer is telling you. It’s isn’t that the old stats are terrible, it’s that they were developed when they had limited power to make sense of a complex game. You wouldn’t want a surgeon trained in the 1920s to operate on you, why let a statistic from 100 years ago inform you. Progress is good. Progress leads to more information and better understanding. You can absolutely disagree with a new stat, but you absolutely cannot disagree with a stat because it’s new. We’re asking the same questions and using the same logic, it’s just about being willing to expand the data you’re willing to use to evaluate those questions. You judge players by batting average, why wouldn’t you look at on base percentage too?
Ultimately, sabermetrics are a way to learn more about baseball and I can’t imagine not wanting to do that. I challenge you to learn more or to help others do the same. We have lots of information on this site under out “Stat of the Week” section and other sites offer much of the same. I’ll even make you a guarantee because I love baseball and learning that much. I will answer any question you have about baseball stats. Hit me on Twitter, in the comments, or on e-mail (See “About” above) and I will explain why I like one stat over another or what the best way is to measure something. Anything. That’s my offer. There’s no excuse not to give it a try, I’m pretty sure you’ll like it.
The Morning Edition (July 9, 2013)
From Last Night:
- Lannan sharp before Papelbon tries to give it away to the Nats
- 6 run 6th inning helps the Rangers and Holland top Feldman and the O’s
- Colon out duels Locke
- Gomez robs a Votto homerun to end the game in Milwaukee
- Braves score 6 in the 14th to beat the Fish
- Good starts on the west coast
What I’m Watching Today:
- Shields and CC hook up in NY (7p Eastern)
- Norris faces Wainwright in St. Louis (8p Eastern)
- Nolasco makes his first start with LA (930p Eastern)
The Big Question:
- Do you care about the homerun derby?
The HR Derby picks came out yesterday and NL features Wright, Cuddyer, Harper, and CarGo while the AL offers Cano, Fielder, Davis, and TBA (because apparently Cano can’t even get that right). A lot of people were upset with some of the picks because their hometown guy didn’t get picked or because someone strange (Cuddyer) or someone who was hurt (Harper) got picked. I don’t really care too much about the Derby, but someone people really seem to. It’s always seemed like a really weird publicity stunt that didn’t quite make sense. I’d like to see a reformatting. Thoughts?
