The Nine Pitchers Who Slowed Their Pace The Most in 2013

That’s a long headline but a simple topic. Which pitchers have increased their average time between pitches the most this year? Below I will present the The Nine pitchers with the largest increases from 2012 to 2013 among those who have thrown 100 innings in both seasons. I will also provide some descriptive stats about the entire sample because for whatever reason, I find “Pace” to be very interesting. Pace is housed over at FanGraphs and here is a link to the current rankings. For 2013, the slowest qualifying starter is Jeremy Hellickson who takes 25.7 seconds between pitches. RA Dickey is the quickest at 17.8, with league average at 22.6.
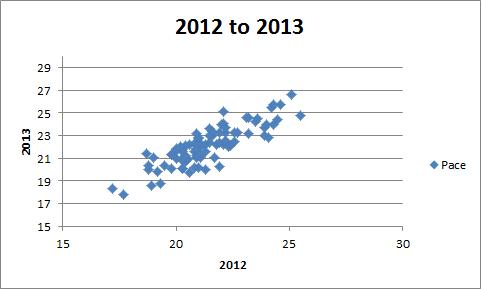
You can see that Pace is pretty consistent and that last year’s pace is a pretty good predictor of this year’s pace with an r squared of .72, meaning that about 72% of the variation in 2013 Pace can be explained by 2012 pace. Below are the players who most buck that trend.
| Rank | Name | Pace Diff | K/9 d | BB/9 d | ERA d | FIP d |
| 9 | Jerome Williams | 1.8 | -0.6 | 0.9 | 0.22 | 0.69 |
| 8 | Dillon Gee | 1.9 | -1.2 | -0.1 | -0.50 | 0.25 |
| 7 | Kyle Kendrick | 2.0 | -1.4 | -0.7 | 0.55 | -0.34 |
| 6 | Madison Bumgarner | 2.0 | 0.3 | 0.7 | -0.53 | -0.26 |
| 5 | Adam Wainwright | 2.1 | -0.1 | -1.2 | -1.36 | -0.77 |
| 4 | Anibal Sanchez | 2.1 | 2.1 | 0.4 | -1.41 | -1.19 |
| 3 | Jarrod Parker | 2.3 | -0.6 | -0.2 | 0.24 | 0.82 |
| 2 | Joe Blanton | 2.7 | -0.5 | 0.5 | 1.41 | 1.21 |
| 1 | David Price | 3.0 | -1.5 | -1.2 | 0.73 | 0.26 |
Positive numbers indicated an increase in 2013 over 2012. For example, Anibal Sanchez’s K/9 is up 2.1 and his FIP is down 1.19. What’s interesting is some pitchers who have slowed down have improved and some have gotten worse. Some have added Ks and BBs, some have cut both, and some have gone in opposite directions. Pretty much, this doesn’t seem very useful in predicting performance.
It’s interesting, though, that on this list we have some elite pitchers and some back end guys. I’m not sure if there is a clear take away from this other than that Pace probably doesn’t correlate that much with anything that has to do with performance on a broad scale and that it matters a lot to each pitcher but it matters in different ways. Let’s just take a quick look at FIP- up against Pace for 2013 qualifiers to illustrate that point:

Oh well, I’m still going to pretend it matters. It matters to fans, at least.
Dynamic Standings Projection (August 22, 2013)
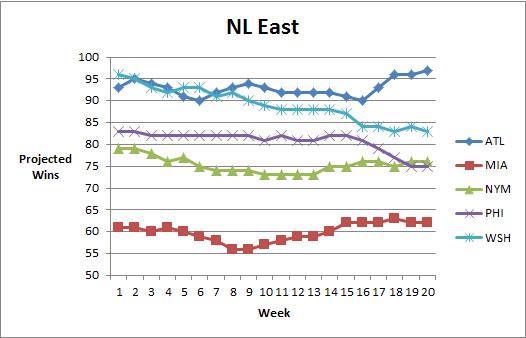
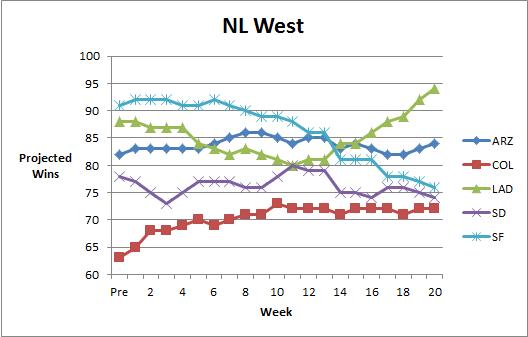
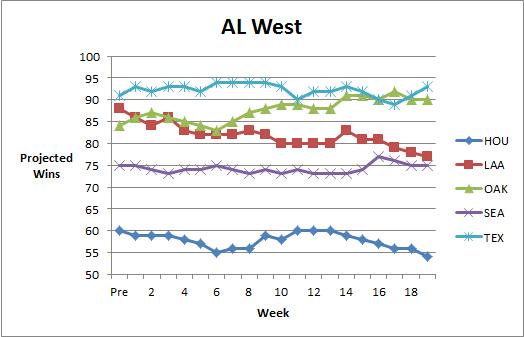
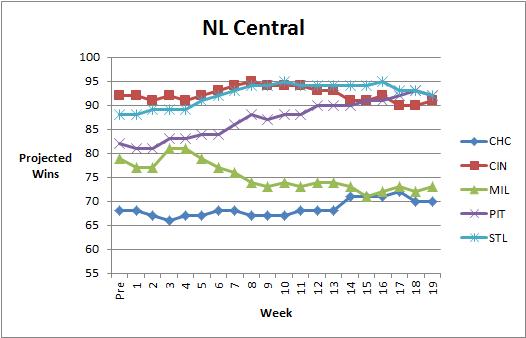
In case you missed it, in April we launched our Dynamic Standings Projection feature on New English D. A full explanation of the methodology can be found here or by clicking the tab at the top of the page. This project seeks to provide a reasoned and cautious approach to updating our beliefs about the baseball future. You can find a summarization of the original projections here. You’ll notice a column on the far right that indicates the difference in projected wins from the preseason prediction. Positive numbers mean teams are now projected to win more games and negative numbers mean a team is now projected to win fewer games. You’ll notice a series of graphs below the standings section that track how the projections have evolved over the course of the year.
This Dynamic Standings Projection is updated through the August 21 games. Note that DSP posts have been moved to Thursday accommodate something that won’t interest you.
| 22-Aug | W | L | PreDiff | |
| TB | 93 | 69 | 0.574 | 2 |
| BOS | 91 | 71 | 0.562 | 14 |
| NYY | 86 | 76 | 0.531 | 1 |
| BAL | 86 | 76 | 0.531 | 4 |
| TOR | 76 | 86 | 0.469 | -11 |
| W | L | PreDiff | ||
| DET | 95 | 67 | 0.586 | 1 |
| CLE | 84 | 78 | 0.519 | 13 |
| KC | 81 | 81 | 0.500 | 5 |
| CWS | 70 | 92 | 0.432 | -13 |
| MIN | 70 | 92 | 0.432 | 5 |
| W | L | PreDiff | ||
| TEX | 94 | 68 | 0.580 | 3 |
| OAK | 90 | 72 | 0.556 | 6 |
| SEA | 76 | 86 | 0.469 | 1 |
| LAA | 75 | 87 | 0.463 | -13 |
| HOU | 54 | 108 | 0.333 | -6 |
| W | L | PreDiff | ||
| ATL | 97 | 65 | 0.599 | 7 |
| WSH | 83 | 79 | 0.512 | -12 |
| NYM | 76 | 86 | 0.469 | -2 |
| PHI | 75 | 87 | 0.463 | -9 |
| MIA | 62 | 100 | 0.383 | -1 |
| W | L | PreDiff | ||
| STL | 93 | 69 | 0.574 | 5 |
| CIN | 92 | 70 | 0.568 | 0 |
| PIT | 92 | 70 | 0.568 | 10 |
| MIL | 72 | 90 | 0.444 | -7 |
| CHC | 69 | 93 | 0.426 | 1 |
| W | L | PreDiff | ||
| LAD | 94 | 68 | 0.580 | 6 |
| ARZ | 84 | 78 | 0.519 | 2 |
| SF | 76 | 86 | 0.469 | -15 |
| SD | 74 | 88 | 0.457 | -4 |
| COL | 72 | 90 | 0.444 | 9 |


The Cy Young Case For and Against Max Scherzer

Let’s get the basics out of the way early. We love Max Scherzer. He’s one of our favorites. We like his stuff and his work ethic and his intelligence. He’s one of us and his eyes are different colors. We’re rooting for him to help the Tigers win and for him to be individually successful. He’s awesome. In fact, we’ve written of his awesomeness quite often:
- Three Reasons He Dominated
- Two Reasons He Got Better
- On Becoming an Ace
- On Falling in Love with Max
- And Why You Can Believe in Him (via Gammons Daily)
But here are New English D, we don’t put a lot of stock in wins and losses for pitchers. In fact, we put exactly zero stock in them, so the fact that Max is 18-1 means nothing to us in terms of postseason awards. I’m glad the Tigers win a lot in Max’s starts and it’s nice that he gets credit, but it’s a useless statistic when it comes to actually evaluating individual performance. Which means we need to consider more accurate stats when considering who the Cy Young should be in the AL. Let’s start with the candidates. To do so, I’m going to use Wins Above Replacement (what’s WAR?) as a starting point. I’m going to look at WAR only to determine who should be in the conversation.
Eight AL pitchers currently have 3.5 WAR or higher while the leader has 5.3. WAR isn’t precise, but I don’t believe there is a case to be made that it’s more than win off the mark. Like I always do on the site, those numbers come from FanGraphs WAR because I think it is a better reflection of performance than something like Baseball-Reference’s WAR (rWAR) or a basic runs allowed WAR (RA9-WAR). Remember, I’m only using WAR to draw the boundaries, not to make a decision.
The candidates are:
| Name | Team | WAR |
| Felix Hernandez | Mariners | 5.3 |
| Max Scherzer | Tigers | 5.3 |
| Derek Holland | Rangers | 4.8 |
| Chris Sale | White Sox | 4.6 |
| Anibal Sanchez | Tigers | 4.5 |
| Yu Darvish | Rangers | 4.3 |
| Hiroki Kuroda | Yankees | 3.8 |
| Justin Verlander | Tigers | 3.6 |
It’s worth noting that each starter has a different number of starts and innings based on their current spot in the rotation and how many games their team has played, in addition to any injuries. I will not penalize a pitcher because of his team’s schedule, but they will lose credit for injury time. Let’s see starts, innings, innings per start, and WAR per 200 innings:
| Name | Team | GS | IP | IP/GS | WAR/200IP |
| Anibal Sanchez | Tigers | 21 | 133 | 6.33 | 6.77 |
| Max Scherzer | Tigers | 25 | 172.1 | 6.89 | 6.15 |
| Felix Hernandez | Mariners | 26 | 178.2 | 6.86 | 5.94 |
| Derek Holland | Rangers | 25 | 168 | 6.72 | 5.71 |
| Chris Sale | White Sox | 23 | 165.1 | 7.19 | 5.56 |
| Yu Darvish | Rangers | 24 | 161 | 6.71 | 5.34 |
| Hiroki Kuroda | Yankees | 25 | 160.1 | 6.41 | 4.74 |
| Justin Verlander | Tigers | 26 | 166.2 | 6.40 | 4.33 |
Sanchez is clearly the best pitcher inning for inning by WAR and Sale is easily going the deepest into games. Scherzer and Felix are currently tied in WAR despite Scherzer being a start behind based on his team’s schedule and Scherzer leads in WAR/200 IP while having nearly identical IP/GS. WAR gives us these 8 candidates, and the early returns look good for Scherzer. Let’s go deeper.
Here are their ERA, FIP, and xFIP (what’s FIP and xFIP?):
| Name | Team | ERA | FIP | xFIP |
| Hiroki Kuroda | Yankees | 2.41 | 3.17 | 3.47 |
| Felix Hernandez | Mariners | 2.47 | 2.55 | 2.72 |
| Anibal Sanchez | Tigers | 2.50 | 2.39 | 2.95 |
| Yu Darvish | Rangers | 2.68 | 3.05 | 2.67 |
| Chris Sale | White Sox | 2.78 | 2.86 | 2.91 |
| Max Scherzer | Tigers | 2.82 | 2.67 | 3.08 |
| Derek Holland | Rangers | 2.95 | 2.99 | 3.49 |
| Justin Verlander | Tigers | 3.51 | 3.43 | 3.73 |
Kuroda, Felix, and Sanchez are all basically allowing the same number of earned runs per nine innings. Sanchez, Felix, and Max are clear the leaders in FIP. Darvish and Felix are your leaders in xFIP. But as you all know, park adjustments are really important. So let’s check out ERA/FIP/xFIP- stats that adjust for ballpark. Remember that 100 is average and everything below that is a percent better than average (ex. 85 ERA- is 15% better than average):
| Name | Team | ERA- | FIP- | xFIP- |
| Anibal Sanchez | Tigers | 61 | 59 | 74 |
| Felix Hernandez | Mariners | 62 | 65 | 68 |
| Max Scherzer | Tigers | 69 | 66 | 77 |
| Chris Sale | White Sox | 66 | 69 | 73 |
| Derek Holland | Rangers | 69 | 70 | 87 |
| Yu Darvish | Rangers | 63 | 72 | 67 |
| Hiroki Kuroda | Yankees | 59 | 77 | 87 |
| Justin Verlander | Tigers | 86 | 84 | 93 |
With park adjustments, we have a whole lot of guys between 59 and 70 for ERA-. Remember, this doesn’t even factor in defense. Only Verlander is outside of this window. By FIP-, we have Darvish and Kuroda falling back. By xFIP-, Darvish, Felix, Anibal, and Sale are your leaders.
Let’s now take a look at K and BB%, just for some added context:
| Name | Team | K% | BB% |
| Yu Darvish | Rangers | 33.20% | 8.50% |
| Max Scherzer | Tigers | 28.10% | 5.80% |
| Anibal Sanchez | Tigers | 26.60% | 7.20% |
| Chris Sale | White Sox | 26.20% | 5.40% |
| Felix Hernandez | Mariners | 25.70% | 5.40% |
| Derek Holland | Rangers | 22.60% | 7.10% |
| Justin Verlander | Tigers | 22.50% | 8.30% |
| Hiroki Kuroda | Yankees | 18.20% | 4.60% |
And I won’t take the time to break these stats down, but if you care about Win Probability Added and Run Expectancy 24, here you go:
| Name | Team | WPA | RE24 |
| Hiroki Kuroda | Yankees | 4.19 | 34.56 |
| Chris Sale | White Sox | 2.87 | 29.45 |
| Max Scherzer | Tigers | 2.84 | 26.63 |
| Derek Holland | Rangers | 2.81 | 29.75 |
| Yu Darvish | Rangers | 2.69 | 34.62 |
| Felix Hernandez | Mariners | 2.36 | 20.61 |
| Anibal Sanchez | Tigers | 0.83 | 23.83 |
| Justin Verlander | Tigers | 0.28 | 11.89 |
So let’s make first cuts. It’s obvious we can get rid of Verlander. I’m also getting rid of Holland because he isn’t a leader in anything. That leaves us with six choices. All of which could win the award based on the final month and a half, but who is in the lead right now? That depends on what you value in a pitcher. Since this is a Tigers site, we’re going to look at this through the prism of #37.
The Case for Scherzer
Pitchers can only control certain aspects of the game. They can’t control their defense. They can’t control their run support. They have some control over where the ball is hit, but only in broad terms. They can induce ground balls, but they can’t decide if it’s directly at a player or ten feet to his right. They control strikeouts, walks, and homeruns. Their ballpark matters.
Scherzer is tied for the league lead in fWAR which is based on FIP. Adjusting for park and league average, based on Scherzer’s Ks, BBs, HRs, and innings, he’s tied with Felix for the best WAR in the AL. If we assume that they would both pitch at this level over the course of an entire season, Scherzer is on a better pace, as seen through WAR/200 IP. Only Sale goes deeper into games than Scherzer. Max and Felix are essentially tied in FIP- and Scherzer throws more innings per start just barely. Only Sanchez is above them in FIP- and he missed starts due to injury, so he takes that hit. Looking at which pitchers induce the fewest hard hit balls, Scherzer and Sale are the two leaders among AL starters on this list at about 13%.
If you care about what a pitcher can actually control, the award belongs to Scherzer. He has a higher K% and is only a touch behind in BB%. His WPA and RE24 are higher as well. Batters hit fewer balls hard against him. Right now, the worst you could say about Scherzer is that he and Felix are basically even when it comes to the FIP side of things. In my mind, it’s razor thin, but I’m voting for Scherzer if I’m voting based on what a pitcher can control.
The Case Against Scherzer
Five pitchers on this list have lower ERAs. Including Felix, and including the leader, Kuroda. We should at least adjust for park using ERA-, but the message is the same. Scherzer allows more earned runs. Let’s take that a step further, because if we’re talking about earned runs, let’s just talk about all runs. If you’re arguing that a pitcher is responsible for his earned runs, then they are responsible for their unearned runs as well. The argument for FIP is the argument that defense and batted balls are fluky. If you don’t buy that, you have to accept errors too. Let’s see Runs Allowed Per 9 and then let’s convert it to a WAR number based on innings and park.
| Name | Team | RAA |
| Hiroki Kuroda | Yankees | 2.58 |
| Anibal Sanchez | Tigers | 2.77 |
| Yu Darvish | Rangers | 2.80 |
| Felix Hernandez | Mariners | 2.82 |
| Max Scherzer | Tigers | 2.92 |
| Chris Sale | White Sox | 3.16 |
| Derek Holland | Rangers | 3.27 |
| Justin Verlander | Tigers | 3.94 |
| Name | Team | RA9-WAR |
| Hiroki Kuroda | Yankees | 5.7 |
| Felix Hernandez | Mariners | 5.5 |
| Yu Darvish | Rangers | 5.5 |
| Max Scherzer | Tigers | 5.3 |
| Derek Holland | Rangers | 4.7 |
| Chris Sale | White Sox | 4.7 |
| Anibal Sanchez | Tigers | 4.3 |
| Justin Verlander | Tigers | 2.9 |
| Name | Team | RA9-WAR/200 IP |
| Hiroki Kuroda | Yankees | 7.1 |
| Yu Darvish | Rangers | 6.8 |
| Anibal Sanchez | Tigers | 6.5 |
| Felix Hernandez | Mariners | 6.2 |
| Max Scherzer | Tigers | 6.2 |
| Chris Sale | White Sox | 5.7 |
| Derek Holland | Rangers | 5.6 |
| Justin Verlander | Tigers | 3.5 |
So if you care about runs allowed, other numbers be damned, the case for Kuroda gets pretty strong. Darvish shows up too. Max and Felix are still in the conversation, but a step down. If you just care about the outcomes and not the process, Kuroda has a solid case.
My Vote
I’m not saying this because I’m a Tigers fan, but at this moment, Scherzer has my vote over Felix by an eyelash. You can’t go wrong with either. Everything you’ve seen at this site supports a FIP style approach that factors out defense and luck. We only care about what a pitcher controls and those two guys are the class of the AL based on that. Sanchez falls out because he missed time with an injury, otherwise he’d likely be the guy. The case against Max is also a case against Felix. If you are going to talk about his ERA or RAA, you have to then credit Kuroda. The argument for Max is that he’s limited walks and homeruns while striking out a lot of guys across a lot of innings and going deep in games. He’s allowing more runs, but runs are a team stat. The pitcher takes some responsibility, but not all of it. Some is luck, some is defense.
Today, I would vote for Scherzer, but with 7-8 starts left, lots of these guys have a shot. Max is going to win because he’s 18-1, but I couldn’t care less. His record doesn’t tell you anything of value. He’s the Cy Young for me in spite of his record, not because of it.
SOEFA Sunday: Reliever Rankings Update (August 18, 2013)
You’ll recall earlier this year we introduced our very own reliever rankings called SOEFA, which you can read about in detail here. For a brief refresher, it combines inherited runner strand rate, expected OBP against, ERA-, and FIP- into a deviation from league average. This is a measure of performance, not necessarily ability, and seeks to provide a single number to judge relievers that balances context neutral and context dependent numbers. Certain pitchers, such as Craig Kimbrel, cannot be credited for stranding runners because they are never put into those situations. They are not penalized either, however. Zero is average, and will generally range between -2.5 to 2.5 with -1 to 1 being most common. This includes all pitchers who have thrown at least 20 IP in relief as of this morning, so the average score on this list is closer to 0.11. Should you wish to know the SOEFA for any other reliever, or on a day that isn’t Sunday, hit us on Twitter or in the comments section.
| Rank | Player | Team | SOEFA |
| 1 | Kenley Jansen | Dodgers | 0.94 |
| 2 | Neal Cotts | Rangers | 0.93 |
| 3 | Greg Holland | Royals | 0.92 |
| 4 | Drew Smyly | Tigers | 0.92 |
| 5 | Chris Withrow | Dodgers | 0.90 |
| 6 | Carlos Torres | Mets | 0.87 |
| 7 | Nick Vincent | Padres | 0.86 |
| 8 | Joaquin Benoit | Tigers | 0.81 |
| 9 | Mark Melancon | Pirates | 0.80 |
| 10 | Jesse Crain | White Sox | 0.78 |
| 11 | Koji Uehara | Red Sox | 0.77 |
| 12 | Alex Torres | Rays | 0.74 |
| 13 | Craig Kimbrel | Braves | 0.72 |
| 14 | Kevin Siegrist | Cardinals | 0.72 |
| 15 | Jason Grilli | Pirates | 0.71 |
| 16 | Jim Henderson | Brewers | 0.70 |
| 17 | Edward Mujica | Cardinals | 0.68 |
| 18 | Javier Lopez | Giants | 0.68 |
| 19 | Shawn Kelley | Yankees | 0.67 |
| 20 | Sergio Romo | Giants | 0.66 |
| 21 | Sam LeCure | Reds | 0.65 |
| 22 | Sean Doolittle | Athletics | 0.63 |
| 23 | Jordan Walden | Braves | 0.63 |
| 24 | Manny Parra | Reds | 0.62 |
| 25 | Brandon Kintzler | Brewers | 0.62 |
| 26 | Jose Veras | – – – | 0.59 |
| 27 | Matt Belisle | Rockies | 0.58 |
| 28 | Paco Rodriguez | Dodgers | 0.57 |
| 29 | Glen Perkins | Twins | 0.57 |
| 30 | Casey Fien | Twins | 0.55 |
| 31 | Randy Choate | Cardinals | 0.54 |
| 32 | Casey Janssen | Blue Jays | 0.54 |
| 33 | Andrew Bailey | Red Sox | 0.52 |
| 34 | Preston Claiborne | Yankees | 0.52 |
| 35 | Luke Hochevar | Royals | 0.51 |
| 36 | Joe Thatcher | – – – | 0.51 |
| 37 | Dan Otero | Athletics | 0.51 |
| 38 | Brian Matusz | Orioles | 0.51 |
| 39 | Trevor Rosenthal | Cardinals | 0.50 |
| 40 | Caleb Thielbar | Twins | 0.50 |
| 41 | Juan Perez | Blue Jays | 0.50 |
| 42 | Antonio Bastardo | Phillies | 0.49 |
| 43 | Seth Maness | Cardinals | 0.49 |
| 44 | J.P. Howell | Dodgers | 0.47 |
| 45 | Andrew Miller | Red Sox | 0.47 |
| 46 | David Carpenter | Braves | 0.46 |
| 47 | Ryan Cook | Athletics | 0.46 |
| 48 | David Robertson | Yankees | 0.45 |
| 49 | Junichi Tazawa | Red Sox | 0.45 |
| 50 | Tommy Hunter | Orioles | 0.45 |
| 51 | Scott Downs | – – – | 0.45 |
| 52 | Bobby Parnell | Mets | 0.44 |
| 53 | Brad Ziegler | Diamondbacks | 0.44 |
| 54 | Joel Peralta | Rays | 0.44 |
| 55 | Josh Collmenter | Diamondbacks | 0.43 |
| 56 | Neil Wagner | Blue Jays | 0.43 |
| 57 | Robbie Ross | Rangers | 0.42 |
| 58 | Matt Reynolds | Diamondbacks | 0.42 |
| 59 | Darren O’Day | Orioles | 0.42 |
| 60 | Brett Cecil | Blue Jays | 0.40 |
| 61 | Luis Avilan | Braves | 0.40 |
| 62 | Chad Gaudin | Giants | 0.40 |
| 63 | Aroldis Chapman | Reds | 0.39 |
| 64 | Will Harris | Diamondbacks | 0.39 |
| 65 | Addison Reed | White Sox | 0.39 |
| 66 | Dale Thayer | Padres | 0.39 |
| 67 | Jason Frasor | Rangers | 0.39 |
| 68 | Jared Burton | Twins | 0.37 |
| 69 | Vin Mazzaro | Pirates | 0.37 |
| 70 | Josh Outman | Rockies | 0.36 |
| 71 | J.J. Hoover | Reds | 0.35 |
| 72 | Boone Logan | Yankees | 0.34 |
| 73 | Jonathan Papelbon | Phillies | 0.34 |
| 74 | Tom Gorzelanny | Brewers | 0.34 |
| 75 | Tanner Scheppers | Rangers | 0.32 |
| 76 | Chad Qualls | Marlins | 0.32 |
| 77 | Francisco Rodriguez | – – – | 0.31 |
| 78 | Craig Breslow | Red Sox | 0.31 |
| 79 | Rafael Betancourt | Rockies | 0.31 |
| 80 | Tyler Clippard | Nationals | 0.30 |
| 81 | Alfredo Figaro | Brewers | 0.30 |
| 82 | Steve Cishek | Marlins | 0.30 |
| 83 | Cody Allen | Indians | 0.30 |
| 84 | Heath Bell | Diamondbacks | 0.29 |
| 85 | Steve Delabar | Blue Jays | 0.28 |
| 86 | Alfredo Simon | Reds | 0.28 |
| 87 | Kevin Gregg | Cubs | 0.27 |
| 88 | Tony Watson | Pirates | 0.27 |
| 89 | James Russell | Cubs | 0.25 |
| 90 | Jerome Williams | Angels | 0.24 |
| 91 | Nate Jones | White Sox | 0.22 |
| 92 | Tim Collins | Royals | 0.22 |
| 93 | Anthony Varvaro | Braves | 0.21 |
| 94 | Jamey Wright | Rays | 0.20 |
| 95 | Joe Smith | Indians | 0.17 |
| 96 | Santiago Casilla | Giants | 0.17 |
| 97 | Ernesto Frieri | Angels | 0.16 |
| 98 | Aaron Loup | Blue Jays | 0.16 |
| 99 | Fernando Abad | Nationals | 0.16 |
| 100 | J.C. Gutierrez | – – – | 0.16 |
| 101 | Jake Diekman | Phillies | 0.15 |
| 102 | Matt Thornton | – – – | 0.15 |
| 103 | Danny Farquhar | Mariners | 0.14 |
| 104 | Jim Johnson | Orioles | 0.14 |
| 105 | Jean Machi | Giants | 0.13 |
| 106 | Craig Stammen | Nationals | 0.12 |
| 107 | Charlie Furbush | Mariners | 0.12 |
| 108 | Justin Wilson | Pirates | 0.12 |
| 109 | Ross Wolf | Rangers | 0.11 |
| 110 | Rex Brothers | Rockies | 0.11 |
| 111 | Jeanmar Gomez | Pirates | 0.11 |
| 112 | Luke Gregerson | Padres | 0.10 |
| 113 | Mike Dunn | Marlins | 0.10 |
| 114 | Sandy Rosario | Giants | 0.10 |
| 115 | Pat Neshek | Athletics | 0.09 |
| 116 | Anthony Swarzak | Twins | 0.09 |
| 117 | Wilton Lopez | Rockies | 0.09 |
| 118 | Yoervis Medina | Mariners | 0.08 |
| 119 | Brad Lincoln | Blue Jays | 0.08 |
| 120 | Jesse Chavez | Athletics | 0.08 |
| 121 | Bruce Rondon | Tigers | 0.07 |
| 122 | Aaron Crow | Royals | 0.07 |
| 123 | Kevin Jepsen | Angels | 0.07 |
| 124 | Bryan Shaw | Indians | 0.06 |
| 125 | LaTroy Hawkins | Mets | 0.06 |
| 126 | Fernando Rodney | Rays | 0.06 |
| 127 | Luis Ayala | – – – | 0.06 |
| 128 | Joe Kelly | Cardinals | 0.06 |
| 129 | Dan Jennings | Marlins | 0.05 |
| 130 | Scott Rice | Mets | 0.05 |
| 131 | Oliver Perez | Mariners | 0.05 |
| 132 | Cesar Ramos | Rays | 0.05 |
| 133 | Burke Badenhop | Brewers | 0.04 |
| 134 | Tyson Ross | Padres | 0.04 |
| 135 | Darren Oliver | Blue Jays | 0.04 |
| 136 | Rafael Soriano | Nationals | 0.04 |
| 137 | Joe Nathan | Rangers | 0.04 |
| 138 | Jared Hughes | Pirates | 0.03 |
| 139 | Edgmer Escalona | Rockies | 0.03 |
| 140 | Brian Duensing | Twins | 0.02 |
| 141 | Ryan Webb | Marlins | 0.02 |
| 142 | Jose Mijares | Giants | 0.01 |
| 143 | Troy Patton | Orioles | 0.01 |
| 144 | Matt Guerrier | – – – | 0.00 |
| 145 | Carter Capps | Mariners | 0.00 |
| 146 | Dane de la Rosa | Angels | 0.00 |
| 147 | Josh Edgin | Mets | -0.01 |
| 148 | Kelvin Herrera | Royals | -0.01 |
| 149 | Ryan Pressly | Twins | -0.02 |
| 150 | Jerry Blevins | Athletics | -0.02 |
| 151 | Adam Ottavino | Rockies | -0.02 |
| 152 | Chris Perez | Indians | -0.03 |
| 153 | Blake Parker | Cubs | -0.04 |
| 154 | Michael Kohn | Angels | -0.04 |
| 155 | Joe Ortiz | Rangers | -0.04 |
| 156 | J.J. Putz | Diamondbacks | -0.05 |
| 157 | Mariano Rivera | Yankees | -0.05 |
| 158 | Josh Roenicke | Twins | -0.05 |
| 159 | Matt Lindstrom | White Sox | -0.05 |
| 160 | Ronald Belisario | Dodgers | -0.06 |
| 161 | David Aardsma | Mets | -0.07 |
| 162 | Phil Coke | Tigers | -0.08 |
| 163 | Bryan Morris | Pirates | -0.09 |
| 164 | Greg Burke | Mets | -0.09 |
| 165 | Brad Brach | Padres | -0.10 |
| 166 | Tony Sipp | Diamondbacks | -0.10 |
| 167 | Darin Downs | Tigers | -0.12 |
| 168 | Logan Ondrusek | Reds | -0.12 |
| 169 | Jake McGee | Rays | -0.13 |
| 170 | Rich Hill | Indians | -0.14 |
| 171 | Ross Ohlendorf | Nationals | -0.14 |
| 172 | Wesley Wright | – – – | -0.16 |
| 173 | Luke Putkonen | Tigers | -0.17 |
| 174 | Huston Street | Padres | -0.18 |
| 175 | Tim Stauffer | Padres | -0.18 |
| 176 | Ramon Troncoso | White Sox | -0.19 |
| 177 | Cory Gearrin | Braves | -0.19 |
| 178 | Nick Hagadone | Indians | -0.21 |
| 179 | A.J. Ramos | Marlins | -0.23 |
| 180 | Raul Valdes | Phillies | -0.23 |
| 181 | Manuel Corpas | Rockies | -0.25 |
| 182 | Jonathan Broxton | Reds | -0.25 |
| 183 | Drew Storen | Nationals | -0.26 |
| 184 | Matt Albers | Indians | -0.27 |
| 185 | Vinnie Pestano | Indians | -0.27 |
| 186 | Blake Beavan | Mariners | -0.28 |
| 187 | Joba Chamberlain | Yankees | -0.29 |
| 188 | Al Alburquerque | Tigers | -0.29 |
| 189 | Tom Wilhelmsen | Mariners | -0.30 |
| 190 | Garrett Richards | Angels | -0.30 |
| 191 | Justin De Fratus | Phillies | -0.31 |
| 192 | Scott Atchison | Mets | -0.31 |
| 193 | John Axford | Brewers | -0.32 |
| 194 | Fernando Salas | Cardinals | -0.33 |
| 195 | Pedro Strop | – – – | -0.34 |
| 196 | Grant Balfour | Athletics | -0.34 |
| 197 | David Hernandez | Diamondbacks | -0.35 |
| 198 | Paul Clemens | Astros | -0.36 |
| 199 | George Kontos | Giants | -0.36 |
| 200 | Michael Gonzalez | Brewers | -0.37 |
| 201 | Michael Bowden | Cubs | -0.37 |
| 202 | Kyle Farnsworth | Rays | -0.39 |
| 203 | Mike Adams | Phillies | -0.40 |
| 204 | T.J. McFarland | Orioles | -0.41 |
| 205 | Clayton Mortensen | Red Sox | -0.41 |
| 206 | Travis Blackley | Astros | -0.44 |
| 207 | Ian Krol | Nationals | -0.44 |
| 208 | Alex Wilson | Red Sox | -0.45 |
| 209 | Josh Fields | Astros | -0.46 |
| 210 | Dallas Keuchel | Astros | -0.48 |
| 211 | Brandon Lyon | Mets | -0.49 |
| 212 | Esmil Rogers | Blue Jays | -0.50 |
| 213 | Ryan Mattheus | Nationals | -0.51 |
| 214 | Bruce Chen | Royals | -0.54 |
| 215 | Adam Warren | Yankees | -0.55 |
| 216 | Jose Cisnero | Astros | -0.57 |
| 217 | Jeremy Horst | Phillies | -0.60 |
| 218 | Hector Ambriz | Astros | -0.62 |
| 219 | Jeremy Affeldt | Giants | -0.65 |
| 220 | Carlos Marmol | – – – | -0.66 |
| 221 | Lucas Luetge | Mariners | -0.71 |
| 222 | Henry Rodriguez | – – – | -0.71 |
| 223 | Michael Kirkman | Rangers | -0.73 |
| 224 | Hector Rondon | Cubs | -0.78 |
| 225 | Brandon League | Dodgers | -0.84 |
| 226 | Anthony Bass | Padres | -0.91 |
| 227 | Shawn Camp | Cubs | -1.05 |
The Nine Most Underrated Baserunners of 2013
Here are New English D we like to dig below surface stats and discover the complete value of players. This post will illustrate that using a player’s value on the bases. Earlier this year we published a piece on the Tigers’ value on the bases that explained a number of baserunning statistics, most notably for our purposes here, UBR and wSB. wSB is a very simple stat that calculates the run value of stealing a base and getting caught. To calculate it you multiple a player’s SB by .2 and their CS by about -.38 and then scale that number based on league average so that a wSB of 0 is set to league average. Here’s the full formula from FanGraphs. UBR is a little more complicated but carries the same principles of turning advancing on the bases into run values that deviate from a league average of 0. Here’s how FanGraphs explains it.
The basic premise of both stats is that taking an extra base is almost always less valuable than getting thrown out is costly. You want to advance on the bases, but you REALLY don’t want to be thrown out. Below are The Nine Best Baserunners from 2013 who have negative value when it comes to stealing bases and positive value when it comes to running the bases when the ball is in play. For me, these are the most underrated baserunners because their stolen bases numbers aren’t good, but the rest of their numbers are great. Stats are for qualifying players entering games on August 17th.
| Rank | Name | Team | PA | UBR | wSB | SB | CS |
| 9 | Gregor Blanco | Giants | 388 | 2.4 | -0.1 | 11 | 5 |
| 8 | Yoenis Cespedes | Athletics | 434 | 2.4 | -1.8 | 6 | 7 |
| 7 | Marlon Byrd | Mets | 426 | 2.6 | -1.5 | 2 | 4 |
| 6 | Matt Carpenter | Cardinals | 534 | 2.8 | -1.5 | 1 | 3 |
| 5 | Brandon Crawford | Giants | 433 | 2.9 | -0.9 | 1 | 2 |
| 4 | Michael Bourn | Indians | 415 | 3.0 | -0.5 | 17 | 9 |
| 3 | Joey Votto | Reds | 547 | 3.2 | -0.4 | 5 | 2 |
| 2 | Brian Dozier | Twins | 443 | 3.2 | -0.9 | 9 | 6 |
| 1 | Austin Jackson | Tigers | 433 | 5.3 | -0.7 | 6 | 4 |
This list has a variety of different players on it. First, we have a couple of players who steal a decent number of bases but get caught too often for it to be worth it (Blance, Bourn, Dozier). We also have players who have decent speed but don’t run very often for a number of reasons (Cespedes, Crawford, Jackson). But we also have guys who aren’t know for their wheels but do a great job taking extra bases (Byrd, Carpenter, and Votto).
Votto and Carpenter really stand out to be because you would never think of them as good baserunners, in fact, some might call them “base-cloggers” because they get on base a lot and aren’t fleet of foot. It turns out they are very good baserunners who simply don’t get any credit because they don’t steal bases. Carpenter and Votto are actually above average baserunners overall despite their inability to steal. They also happen to be great hitters and fielders, so that’s a nice combination.
What this list tells you is that baserunning is not as simple as speed and stolen bases. Slow guys who don’t steal can add a lot of value if they have good instincts and read the ball well off the bat. Additionally, this is a good example of why advanced stats can be helpful. The basic baserunning stat (SB) would completely ignore most of these players and we would have no idea that they are so valuable.
If nothing else, this should cement how fantastic Joey Votto is at baseball.
Dynamic Standings Projection (August 14, 2013)
In case you missed it, in April we launched our Dynamic Standings Projection feature on New English D. A full explanation of the methodology can be found here or by clicking the tab at the top of the page. This project seeks to provide a reasoned and cautious approach to updating our beliefs about the baseball future. You can find a summarization of the original projections here. You’ll notice a column on the far right that indicates the difference in projected wins from the preseason prediction. Positive numbers mean teams are now projected to win more games and negative numbers mean a team is now projected to win fewer games. You’ll notice a series of graphs below the standings section that track how the projections have evolved over the course of the year.
This Dynamic Standings Projection is updated through the August 13 games.
| 14-Aug | W | L | PreDiff | |
| TB | 91 | 71 | 0.562 | 0 |
| BOS | 91 | 71 | 0.562 | 14 |
| BAL | 87 | 75 | 0.537 | 5 |
| NYY | 84 | 78 | 0.519 | -1 |
| TOR | 77 | 85 | 0.475 | -10 |
| W | L | PreDiff | ||
| DET | 95 | 67 | 0.586 | 1 |
| KC | 83 | 79 | 0.512 | 7 |
| CLE | 82 | 80 | 0.506 | 11 |
| MIN | 71 | 91 | 0.438 | 6 |
| CWS | 69 | 93 | 0.426 | -14 |
| W | L | PreDiff | ||
| TEX | 93 | 69 | 0.574 | 2 |
| OAK | 90 | 72 | 0.556 | 6 |
| LAA | 77 | 85 | 0.475 | -11 |
| SEA | 75 | 87 | 0.463 | 0 |
| HOU | 54 | 108 | 0.333 | -6 |
| W | L | PreDiff | ||
| ATL | 96 | 66 | 0.593 | 6 |
| WSH | 84 | 78 | 0.519 | -11 |
| NYM | 76 | 86 | 0.469 | -2 |
| PHI | 75 | 87 | 0.463 | -9 |
| MIA | 62 | 100 | 0.383 | -1 |
| W | L | PreDiff | ||
| STL | 92 | 70 | 0.568 | 4 |
| PIT | 92 | 70 | 0.568 | 10 |
| CIN | 91 | 71 | 0.562 | -1 |
| MIL | 73 | 89 | 0.451 | -6 |
| CHC | 70 | 92 | 0.432 | 2 |
| W | L | PreDiff | ||
| LAD | 92 | 70 | 0.568 | 4 |
| ARZ | 83 | 79 | 0.512 | 1 |
| SF | 77 | 85 | 0.475 | -14 |
| SD | 75 | 87 | 0.463 | -3 |
| COL | 72 | 90 | 0.444 | 9 |


SOEFA Sunday: Reliever Rankings Update (August 11, 2013)
You’ll recall earlier this year we introduced our very own reliever rankings called SOEFA, which you can read about in detail here. For a brief refresher, it combines inherited runner strand rate, expected OBP against, ERA-, and FIP- into a deviation from league average. This is a measure of performance, not necessarily ability, and seeks to provide a single number to judge relievers that balances context neutral and context dependent numbers. Certain pitchers, such as Craig Kimbrel, cannot be credited for stranding runners because they are never put into those situations. They are not penalized either, however. Zero is average, and will generally range between -2.5 to 2.5 with -1 to 1 being most common. This includes all pitchers who have thrown at least 20 IP in relief as of this morning, so the average score on this list is closer to 0.11. Should you wish to know the SOEFA for any other reliever, or on a day that isn’t Sunday, hit us on Twitter or in the comments section.
| Rank | Player | Team | SOEFA |
| 1 | Carlos Torres | Mets | 1.14 |
| 2 | Neal Cotts | Rangers | 0.99 |
| 3 | Drew Smyly | Tigers | 0.97 |
| 4 | Alex Torres | Rays | 0.95 |
| 5 | Greg Holland | Royals | 0.91 |
| 6 | Kenley Jansen | Dodgers | 0.90 |
| 7 | Joaquin Benoit | Tigers | 0.82 |
| 8 | Mark Melancon | Pirates | 0.81 |
| 9 | Nick Vincent | Padres | 0.79 |
| 10 | Casey Fien | Twins | 0.78 |
| 11 | Jesse Crain | White Sox | 0.78 |
| 12 | Koji Uehara | Red Sox | 0.76 |
| 13 | Jordan Walden | Braves | 0.72 |
| 14 | Craig Kimbrel | Braves | 0.71 |
| 15 | Jose Veras | – – – | 0.71 |
| 16 | Kevin Siegrist | Cardinals | 0.71 |
| 17 | Jason Grilli | Pirates | 0.71 |
| 18 | Edward Mujica | Cardinals | 0.68 |
| 19 | Joe Thatcher | – – – | 0.67 |
| 20 | Sean Doolittle | Athletics | 0.67 |
| 21 | Casey Janssen | Blue Jays | 0.66 |
| 22 | David Robertson | Yankees | 0.65 |
| 23 | Javier Lopez | Giants | 0.64 |
| 24 | Will Harris | Diamondbacks | 0.64 |
| 25 | Sergio Romo | Giants | 0.63 |
| 26 | Shawn Kelley | Yankees | 0.62 |
| 27 | Glen Perkins | Twins | 0.59 |
| 28 | Sam LeCure | Reds | 0.58 |
| 29 | Jim Henderson | Brewers | 0.56 |
| 30 | Brandon Kintzler | Brewers | 0.56 |
| 31 | Manny Parra | Reds | 0.54 |
| 32 | Brian Matusz | Orioles | 0.54 |
| 33 | Dan Otero | Athletics | 0.52 |
| 34 | Andrew Bailey | Red Sox | 0.52 |
| 35 | Matt Belisle | Rockies | 0.52 |
| 36 | Luke Hochevar | Royals | 0.51 |
| 37 | Darren O’Day | Orioles | 0.51 |
| 38 | Juan Perez | Blue Jays | 0.51 |
| 39 | Trevor Rosenthal | Cardinals | 0.50 |
| 40 | Boone Logan | Yankees | 0.50 |
| 41 | Paco Rodriguez | Dodgers | 0.49 |
| 42 | Preston Claiborne | Yankees | 0.49 |
| 43 | Antonio Bastardo | Phillies | 0.49 |
| 44 | Seth Maness | Cardinals | 0.49 |
| 45 | Junichi Tazawa | Red Sox | 0.48 |
| 46 | Tommy Hunter | Orioles | 0.48 |
| 47 | Brett Cecil | Blue Jays | 0.47 |
| 48 | David Carpenter | Braves | 0.47 |
| 49 | Andrew Miller | Red Sox | 0.47 |
| 50 | Ryan Cook | Athletics | 0.45 |
| 51 | Brad Ziegler | Diamondbacks | 0.44 |
| 52 | Bobby Parnell | Mets | 0.44 |
| 53 | Joel Peralta | Rays | 0.44 |
| 54 | J.P. Howell | Dodgers | 0.44 |
| 55 | Matt Reynolds | Diamondbacks | 0.42 |
| 56 | Scott Downs | – – – | 0.41 |
| 57 | Chad Gaudin | Giants | 0.41 |
| 58 | Robbie Ross | Rangers | 0.41 |
| 59 | Randy Choate | Cardinals | 0.40 |
| 60 | Caleb Thielbar | Twins | 0.39 |
| 61 | Luis Avilan | Braves | 0.38 |
| 62 | Jason Frasor | Rangers | 0.38 |
| 63 | Aroldis Chapman | Reds | 0.36 |
| 64 | Vin Mazzaro | Pirates | 0.36 |
| 65 | Addison Reed | White Sox | 0.36 |
| 66 | Dale Thayer | Padres | 0.35 |
| 67 | Josh Collmenter | Diamondbacks | 0.35 |
| 68 | Jonathan Papelbon | Phillies | 0.34 |
| 69 | Tom Gorzelanny | Brewers | 0.34 |
| 70 | Sandy Rosario | Giants | 0.34 |
| 71 | Josh Outman | Rockies | 0.32 |
| 72 | Oliver Perez | Mariners | 0.32 |
| 73 | Tanner Scheppers | Rangers | 0.32 |
| 74 | Fernando Abad | Nationals | 0.32 |
| 75 | Jared Burton | Twins | 0.31 |
| 76 | Nate Jones | White Sox | 0.31 |
| 77 | Chad Qualls | Marlins | 0.31 |
| 78 | Dan Jennings | Marlins | 0.30 |
| 79 | Alfredo Figaro | Brewers | 0.30 |
| 80 | Francisco Rodriguez | – – – | 0.30 |
| 81 | J.C. Gutierrez | – – – | 0.30 |
| 82 | Tyler Clippard | Nationals | 0.29 |
| 83 | Alfredo Simon | Reds | 0.29 |
| 84 | Steve Delabar | Blue Jays | 0.28 |
| 85 | Steve Cishek | Marlins | 0.27 |
| 86 | Heath Bell | Diamondbacks | 0.27 |
| 87 | Tony Watson | Pirates | 0.26 |
| 88 | Rafael Betancourt | Rockies | 0.25 |
| 89 | Santiago Casilla | Giants | 0.25 |
| 90 | Jerome Williams | Angels | 0.25 |
| 91 | J.J. Hoover | Reds | 0.24 |
| 92 | Rafael Soriano | Nationals | 0.24 |
| 93 | Kevin Gregg | Cubs | 0.24 |
| 94 | Neil Wagner | Blue Jays | 0.24 |
| 95 | Craig Breslow | Red Sox | 0.23 |
| 96 | Cody Allen | Indians | 0.22 |
| 97 | Jim Johnson | Orioles | 0.21 |
| 98 | Jose Mijares | Giants | 0.20 |
| 99 | Tim Collins | Royals | 0.20 |
| 100 | Luke Gregerson | Padres | 0.19 |
| 101 | James Russell | Cubs | 0.19 |
| 102 | Aaron Loup | Blue Jays | 0.18 |
| 103 | Pat Neshek | Athletics | 0.16 |
| 104 | Aaron Crow | Royals | 0.15 |
| 105 | Matt Thornton | – – – | 0.15 |
| 106 | Jamey Wright | Rays | 0.15 |
| 107 | Michael Kohn | Angels | 0.15 |
| 108 | Danny Farquhar | Mariners | 0.15 |
| 109 | David Aardsma | Mets | 0.14 |
| 110 | Jean Machi | Giants | 0.14 |
| 111 | Rex Brothers | Rockies | 0.13 |
| 112 | Kevin Jepsen | Angels | 0.12 |
| 113 | Jeanmar Gomez | Pirates | 0.12 |
| 114 | Anthony Varvaro | Braves | 0.12 |
| 115 | Mike Dunn | Marlins | 0.12 |
| 116 | Bryan Morris | Pirates | 0.11 |
| 117 | LaTroy Hawkins | Mets | 0.11 |
| 118 | Darren Oliver | Blue Jays | 0.10 |
| 119 | Justin Wilson | Pirates | 0.10 |
| 120 | Ross Wolf | Rangers | 0.10 |
| 121 | Charlie Furbush | Mariners | 0.10 |
| 122 | Yoervis Medina | Mariners | 0.08 |
| 123 | Anthony Swarzak | Twins | 0.08 |
| 124 | Joe Smith | Indians | 0.08 |
| 125 | Mariano Rivera | Yankees | 0.07 |
| 126 | Ernesto Frieri | Angels | 0.06 |
| 127 | Adam Ottavino | Rockies | 0.06 |
| 128 | Joe Kelly | Cardinals | 0.06 |
| 129 | Wilton Lopez | Rockies | 0.05 |
| 130 | Craig Stammen | Nationals | 0.04 |
| 131 | Tyson Ross | Padres | 0.04 |
| 132 | J.J. Putz | Diamondbacks | 0.04 |
| 133 | Burke Badenhop | Brewers | 0.04 |
| 134 | Bryan Shaw | Indians | 0.04 |
| 135 | A.J. Ramos | Marlins | 0.04 |
| 136 | Jesse Chavez | Athletics | 0.04 |
| 137 | Carter Capps | Mariners | 0.02 |
| 138 | Fernando Rodney | Rays | 0.02 |
| 139 | Joe Nathan | Rangers | 0.01 |
| 140 | Dane de la Rosa | Angels | 0.01 |
| 141 | Matt Guerrier | – – – | 0.00 |
| 142 | Scott Rice | Mets | 0.00 |
| 143 | Cesar Ramos | Rays | 0.00 |
| 144 | Ryan Webb | Marlins | 0.00 |
| 145 | Josh Edgin | Mets | -0.01 |
| 146 | Jared Hughes | Pirates | -0.02 |
| 147 | Ryan Pressly | Twins | -0.03 |
| 148 | Joe Ortiz | Rangers | -0.04 |
| 149 | Brian Duensing | Twins | -0.06 |
| 150 | Troy Patton | Orioles | -0.06 |
| 151 | Edgmer Escalona | Rockies | -0.06 |
| 152 | Blake Parker | Cubs | -0.06 |
| 153 | Matt Lindstrom | White Sox | -0.06 |
| 154 | Chris Perez | Indians | -0.07 |
| 155 | Jerry Blevins | Athletics | -0.07 |
| 156 | Rich Hill | Indians | -0.08 |
| 157 | Greg Burke | Mets | -0.09 |
| 158 | Jake Diekman | Phillies | -0.09 |
| 159 | Brad Lincoln | Blue Jays | -0.09 |
| 160 | Brad Brach | Padres | -0.10 |
| 161 | Tony Sipp | Diamondbacks | -0.10 |
| 162 | Darin Downs | Tigers | -0.11 |
| 163 | Josh Roenicke | Twins | -0.12 |
| 164 | Logan Ondrusek | Reds | -0.13 |
| 165 | Ross Ohlendorf | Nationals | -0.14 |
| 166 | Phil Coke | Tigers | -0.15 |
| 167 | Luke Putkonen | Tigers | -0.17 |
| 168 | Tim Stauffer | Padres | -0.18 |
| 169 | Jake McGee | Rays | -0.18 |
| 170 | Wesley Wright | Astros | -0.19 |
| 171 | Cory Gearrin | Braves | -0.19 |
| 172 | Ronald Belisario | Dodgers | -0.20 |
| 173 | Nick Hagadone | Indians | -0.21 |
| 174 | Jonathan Broxton | Reds | -0.21 |
| 175 | Ian Krol | Nationals | -0.21 |
| 176 | Ramon Troncoso | White Sox | -0.21 |
| 177 | Huston Street | Padres | -0.22 |
| 178 | Manuel Corpas | Rockies | -0.24 |
| 179 | Ryan Mattheus | Nationals | -0.25 |
| 180 | Kelvin Herrera | Royals | -0.25 |
| 181 | Vinnie Pestano | Indians | -0.26 |
| 182 | Blake Beavan | Mariners | -0.27 |
| 183 | Grant Balfour | Athletics | -0.27 |
| 184 | Tom Wilhelmsen | Mariners | -0.29 |
| 185 | Michael Gonzalez | Brewers | -0.29 |
| 186 | John Axford | Brewers | -0.30 |
| 187 | Raul Valdes | Phillies | -0.30 |
| 188 | Garrett Richards | Angels | -0.30 |
| 189 | Fernando Salas | Cardinals | -0.33 |
| 190 | Scott Atchison | Mets | -0.34 |
| 191 | T.J. McFarland | Orioles | -0.35 |
| 192 | David Hernandez | Diamondbacks | -0.35 |
| 193 | Pedro Strop | – – – | -0.36 |
| 194 | Drew Storen | Nationals | -0.36 |
| 195 | Paul Clemens | Astros | -0.36 |
| 196 | George Kontos | Giants | -0.36 |
| 197 | Michael Bowden | Cubs | -0.37 |
| 198 | Kyle Farnsworth | Rays | -0.38 |
| 199 | Matt Albers | Indians | -0.38 |
| 200 | Joba Chamberlain | Yankees | -0.38 |
| 201 | Al Alburquerque | Tigers | -0.39 |
| 202 | Mike Adams | Phillies | -0.40 |
| 203 | Clayton Mortensen | Red Sox | -0.41 |
| 204 | Justin De Fratus | Phillies | -0.43 |
| 205 | Travis Blackley | Astros | -0.44 |
| 206 | Alex Wilson | Red Sox | -0.45 |
| 207 | Dallas Keuchel | Astros | -0.48 |
| 208 | Brandon Lyon | Mets | -0.49 |
| 209 | Esmil Rogers | Blue Jays | -0.49 |
| 210 | Bruce Chen | Royals | -0.54 |
| 211 | Jose Cisnero | Astros | -0.57 |
| 212 | Jeremy Horst | Phillies | -0.60 |
| 213 | Hector Ambriz | Astros | -0.62 |
| 214 | Jeremy Affeldt | Giants | -0.65 |
| 215 | Josh Fields | Astros | -0.66 |
| 216 | Lucas Luetge | Mariners | -0.66 |
| 217 | Adam Warren | Yankees | -0.68 |
| 218 | Henry Rodriguez | – – – | -0.71 |
| 219 | Michael Kirkman | Rangers | -0.73 |
| 220 | Carlos Marmol | – – – | -0.81 |
| 221 | Hector Rondon | Cubs | -0.82 |
| 222 | Brandon League | Dodgers | -0.88 |
| 223 | Anthony Bass | Padres | -0.91 |
| 224 | Shawn Camp | Cubs | -1.04 |
More Exciting News From New English D
So I know we just went through this three days ago, but I’m excited to announce that I’ve joined Gammons Daily as a regular contributor, which is a site surrounding Peter Gammons’ baseball writing and devoted to unfiltered analysis from some of the country’s best. It’s only a couple weeks old and is a partnership between Gammons and TruMedia that should eventually feature some of their analytic tools. I’ll be writing there once or twice a week in addition to my weekly work at Beyond The Box Score. Like I said on Thursday, none of New English D’s Tigers coverage will be affected and you’ll only notice a slight reduction in MLB coverage here to accommodate the transition.
I hope you’ll check out Gammons Daily, follow my work around the web, and continue to engage with me on Twitter. Check out my first piece for the site, on the Tigers own Max Scherzer.
Exciting Announcement About Baseball Writing
I am excited to announce that I will be joining SB Nation’s saber-slanted baseball community Beyond The Box Score as a staff writer starting this week. If you’re not familiar with Beyond The Box Score, you like what I do here, and have a baseball interest outside of just the Detroit Tigers, check it out. You can find us on Twitter @BtBScore and all other places the internet is available.
If you a regular reader of New English D, fear not! There will be absolutely no change to our Tigers coverage and no change to our writing about the use of advanced statistics in baseball. If you read us for Tigers coverage, The Nine, Stat of the Week, and all sorts of other stuff, you’ll hardly notice a change. The only difference is a slight reduction in our MLB coverage at large. If I have something to say about another team or player, I’ll now be writing about it at Beyond The Box Score. To facilitate this shift, I will be axing our daily MLB recap series, The Morning Edition. Generally, this has been one of the less popular features on the site and I was planning to wrap it up after this season regardless of my other projects. If you’re broken up about it, I’m sure some sort of begging would get me to bring it back. As far as I can tell, you come to New English D for Tigers analysis and posts about why certain stats are bad and certain stats are good. That’s mostly what we do here.
So that’s it. No more Morning Edition, and no other changes. I’m looking forward to joining BtBS and am just as happy to interact with readers here, there, and on Twitter (@NeilWeinberg44). If you have questions and ideas you want to see researched and discussed, I welcome requests regarding the Tigers and any other MLB team or player.
Finally, thanks for reading. New English D started as something personal for me. I missed writing and it was therapeutic in my first year far away from the Comerica Park (and I guess my family and friends?). I started this site during the 2012 ALCS and for about eight months, it was pretty small and more or less just something I did for myself. And then I wrote about Rick Porcello’s big breakout and a few well-timed plugs from people much more established than me helped us take off. So New English D grew. Tigers fans and baseball fans started coming back and coming in higher numbers. More people visited New English D in July than had visited in total up to that point and it continues to trend up. I didn’t start New English D for fame or page views and that still remains a very, very peripheral goal. I write about baseball because I enjoy it and it’s rewarding. I’m happy you like it and I’m happy it makes you think. Life isn’t always easy, and baseball and baseball writing makes me feel better. I hope it does the same for you.
It’s been fun and I’m certain it will continue to be. If you like New English D, keep coming back and tell your friends. I’ll keep churning out high quality content. If you’re interested in baseball outside of Detroit, check me and my new colleagues out at Beyond The Box Score. As always, Go Tigers.
Dynamic Standings Projection (August 7, 2013)
In case you missed it, in April we launched our Dynamic Standings Projection feature on New English D. A full explanation of the methodology can be found here or by clicking the tab at the top of the page. This project seeks to provide a reasoned and cautious approach to updating our beliefs about the baseball future. You can find a summarization of the original projections here. You’ll notice a column on the far right that indicates the difference in projected wins from the preseason prediction. Positive numbers mean teams are now projected to win more games and negative numbers mean a team is now projected to win fewer games. You’ll notice a series of graphs below the standings section that track how the projections have evolved over the course of the year.
This Dynamic Standings Projection is updated through the August 6 games.
| 7-Aug | W | L | PreDiff | |
| TB | 94 | 68 | 0.580 | 3 |
| BOS | 91 | 71 | 0.562 | 14 |
| BAL | 87 | 75 | 0.537 | 5 |
| NYY | 83 | 79 | 0.512 | -2 |
| TOR | 79 | 83 | 0.488 | -8 |
| W | L | PreDiff | ||
| DET | 96 | 66 | 0.593 | 2 |
| CLE | 83 | 79 | 0.512 | 12 |
| KC | 81 | 81 | 0.500 | 5 |
| MIN | 70 | 92 | 0.432 | 5 |
| CWS | 68 | 94 | 0.420 | -15 |
| W | L | PreDiff | ||
| TEX | 91 | 71 | 0.562 | 0 |
| OAK | 90 | 72 | 0.556 | 6 |
| LAA | 78 | 84 | 0.481 | -10 |
| SEA | 75 | 87 | 0.463 | 0 |
| HOU | 56 | 106 | 0.346 | -4 |
| W | L | PreDiff | ||
| ATL | 96 | 66 | 0.593 | 6 |
| WSH | 83 | 79 | 0.512 | -12 |
| PHI | 77 | 85 | 0.475 | -7 |
| NYM | 75 | 87 | 0.463 | -3 |
| MIA | 63 | 99 | 0.389 | 0 |
| W | L | PreDiff | ||
| STL | 93 | 69 | 0.574 | 5 |
| PIT | 93 | 69 | 0.574 | 11 |
| CIN | 90 | 72 | 0.556 | -2 |
| MIL | 72 | 90 | 0.444 | -7 |
| CHC | 70 | 92 | 0.432 | 2 |
| W | L | PreDiff | ||
| LAD | 89 | 73 | 0.549 | 1 |
| ARZ | 82 | 80 | 0.506 | 0 |
| SF | 78 | 84 | 0.481 | -13 |
| SD | 76 | 86 | 0.469 | -2 |
| COL | 71 | 91 | 0.438 | 8 |


