The Nine Worst Sacrifice Bunts of 2013

So now that we have sufficiently killed the win, bunting seems to be the topic of the day. Last week there were many examples of managers employing the sacrifice bunt at silly times and it seemed to set off a fervor among those wishing to debate new ideas and old tradition. I got into some debates with followers – and you all know Brian Kenny did the same.
The basic argument against the sacrifice bunt is that giving up and out to gain a base is a bad percentage play. The facts are pretty clear on the matter. You have to consider who is batting and the exact situation of the game, but it’s usually always a bad idea to bunt with a reasonably competent position player. Below I’ve presented The Nine Worst Sacrifice Bunt Attempts of 2013. This requires some definition, but first I want to lay out the basic argument for when bunting might be a good idea because some often taking anti-bunting comments as absolute:
When To Bunt
- When a pitcher is batting OR
- When a very low quality hitter is up AND
- There are zero outs AND
- There are men on first and second AND
- The batter has a high probability of striking out based on his skills or the opposing pitcher AND
- One run is sufficient (i.e., you’re down one run late or tied)
The Odds Against Bunting
Here’s my post from earlier this year that outlines Run Expectancy. If you don’t like the way I explain it, just Google it. Lots of smart people have explained it.
The Rules
So the following are The Nine Worst Bunt Attempts of the year as defined like this. First, these are all bunts that have been put in play. I can’t examine the times a batter failed to get a bunt down and then the bunt sign was taken off. Second, this does not include bunts that went for hits. Bunting for a hit is great, this is about bunts in which an out was made – which is the goal of a bunt. Get on base and we don’t have a problem. Third, this is judged by Win Probability Added (WPA), which considers the game situation and the result of the play. So, if you call a bunt in a 10-0 game, who cares. If you call for a bunt in a 5-3 game with your two hitter, that’s probably silly. Finally, no pitchers. Pitchers can’t hit, so it’s fine to use them to bunt. Let’s see what happens!
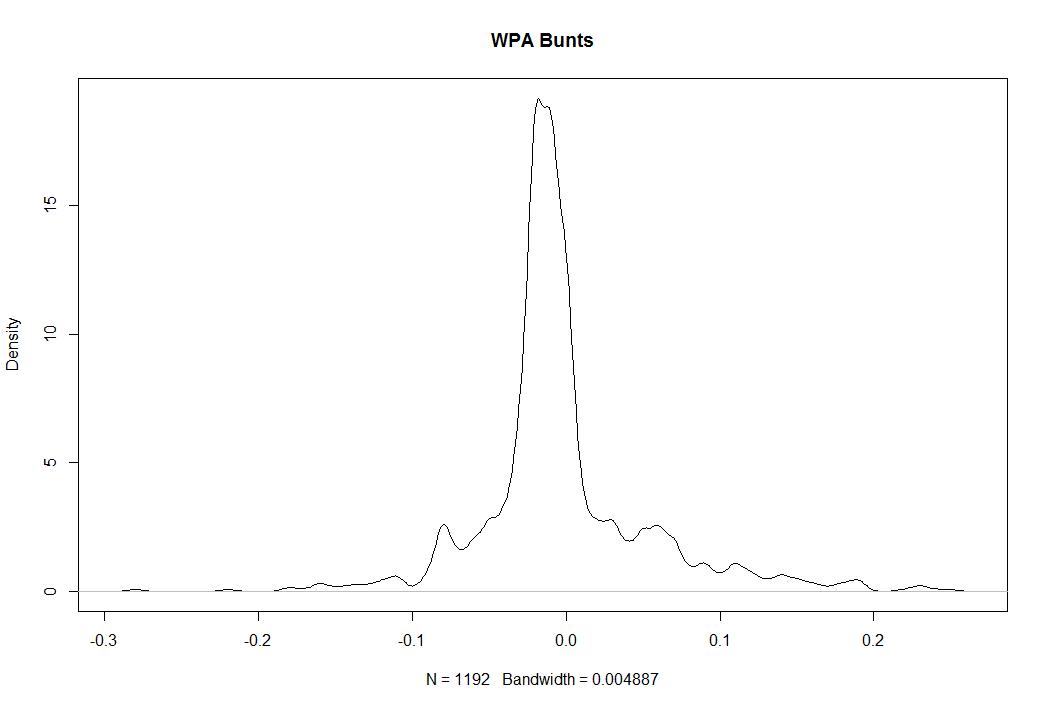
There have been 1,192 sacrifice bunt attempts this season by non-pitchers. 174 have gone for hits and 39 have been turned into errors, so that’s 979 bunt attempts that resulted in at least one out. In sum, they have been worth -2.7 WPA. Here are the worst.
Let’s start with some data that sets the stage.
| Rank | Date | Batter | Tm |
| 9 | 9/16/2013 | Juan Uribe | LAD |
| 8 | 8/14/2013 | Alberto Callaspo | OAK |
| 7 | 8/14/2013 | Martin Prado | ARI |
| 6 | 8/10/2013 | Stephen Vogt | OAK |
| 5 | 9/9/2013 | Jonathan Herrera | COL |
| 4 | 9/18/2013 | Munenori Kawasaki | TOR |
| 3 | 4/25/2013 | Juan Pierre | MIA |
| 2 | 4/11/2013 | Brendan Ryan | SEA |
| 1 | 4/9/2013 | Rob Brantly | MIA |
There we have the date and hitters. Now the opponent and situation:
| Rank | Opp | Pitcher | Score | Inn | RoB | Out |
| 9 | @ARI | Brad Ziegler | down 2-1 | t9 | -12 | 0 |
| 8 | HOU | Josh Fields | down 2-1 | b11 | -2- | 0 |
| 7 | BAL | Jim Johnson | down 4-3 | b9 | -2- | 0 |
| 6 | @TOR | Casey Janssen | down 5-4 | t9 | -12 | 0 |
| 5 | @SFG | Javier Lopez | tied 2-2 | t10 | 1– | 0 |
| 4 | NYY | Mariano Rivera | down 4-3 | b9 | -12 | 0 |
| 3 | CHC | Carlos Marmol | down 4-3 | b9 | -12 | 0 |
| 2 | TEX | Robbie Ross | down 4-3 | b8 | 3 | 1 |
| 1 | ATL | Craig Kimbrel | down 3-2 | b9 | 1– | 0 |
All but one feature no outs and the hitting team has been trailing late or tied in each.
| Rank | Batter | WPA | RE24 | LI | Play Description |
| 9 | Juan Uribe | -0.16 | -0.56 | 5.6 | Bunt Groundout: P-3B/Forceout at 3B (Front of Home); Schumaker to 2B |
| 8 | Alberto Callaspo | -0.16 | -0.42 | 4.38 | Bunt Popfly: P (Front of Home) |
| 7 | Martin Prado | -0.16 | -0.42 | 4.38 | Bunt Groundout: P-1B (Front of Home) |
| 6 | Stephen Vogt | -0.16 | -0.58 | 5.48 | Bunt Groundout: P-3B/Forceout at 3B (Front of Home); Crisp to 2B |
| 5 | Jonathan Herrera | -0.17 | -0.68 | 3.51 | Bunt Ground Ball Double Play: Bunt C-SS-2B (Front of Home) |
| 4 | Munenori Kawasaki | -0.18 | -0.58 | 6.13 | Bunt Groundout: 1B-3B/Forceout at 3B (Front of Home); Rasmus to 2B |
| 3 | Juan Pierre | -0.18 | -0.56 | 6.21 | Bunt Groundout: C-3B/Forceout at 3B (Front of Home); Kearns to 2B |
| 2 | Brendan Ryan | -0.22 | -0.69 | 4.33 | Fielder’s Choice P; Chavez out at Hm/P-C; Ryan to 1B |
| 1 | Rob Brantly | -0.28 | -0.74 | 5.4 | Bunt Pop Fly Double Play: Bunt 3B (Short 3B Line); Solano out at 1B/3B-1B |
Alright, so a few notes. The very worst bunts are almost always the ones that include double plays or a runner getting thrown out at home somehow. Which makes sense, any time a bunt goes horribly wrong, it’s going to be more costly than a normal bunt. Martin Prado’s at #7 is the worst true sac bunt of the lot because the runner didn’t advance and Prado made an out.
So it’s perfectly reasonable to say these are poorly executed bunts. That’s true. But it’s not interesting to show you 9 very similar bunts that are all in the -4% range in the same situations. There are just so many of them. But, let me provide some summary stats to give you a better idea about the whole dataset. Of the 979 bunts that didn’t result in a hit or error, 722 resulted in a decrease in WPA, 160 resulted in no change, and 97 increased the team’s odds of winning. In other words, only 26% of sac bunts in the sample are good for the team.
So 18% of the time a batter attempts to sac bunt, he gets a hit or induces and error. That’s good. And 26% of the remaining 82% helps anyway. All told, about one quarter of position player bunts turn out to be a good idea based on WPA. Let’s go further.
Even including all of the bunts that ended in hits and errors, 276 resulted in more than one run, 339 resulted in one run exactly, and 577 resulted in zero runs. There are good bunts, but bunting is usually a bad idea. There are bunts that mess up the defense and open the door, but they are rare. Usually when you bunt, you don’t score.

You’re welcome to keep bunting, but the odds are not in your favor.
How Was The Game? (September 20, 2013)
A complete domination.
Tigers 12, White Sox 5 (Magic # = 3)
Max Scherzer (31 GS, 207.1 IP, 3.00 ERA, 2.74 FIP, 6.2 WAR) had a bit of a mundane, 6 inning, 3 run start with just three strikeouts, but that hardly mattered. He could have had the worst start of his career and the Tigers still would have won this one as the offense absolutely unloaded on Dylan Axerold and the White Sox. They scored 2 in the 1st, 1 in the 2nd, 4 in the 3rd, and 5 in the 5th as every starter reached base at least once. It was a complete team effort as the Tigers annihilated the White Sox. The Indians waited through rain, but won, leaving the Tigers’ magic number at three with Rick Porcello (28 GS, 168 IP, 4.45 ERA, 3.70 FIP, 2.6 WAR) on the mound Saturday looking to knock it down another step.
The Moment: All of them?
The Best Tigers Team Ever
What I’m about to say might make some of you do a spit take and/or faint. If you’re prone to either of those, have a beverage in your mouth, or are a baseball fan prone to negativity, please sit down, swallow the most recent sip, and get ready. The 2013 Tigers are the best Tigers team ever.
I’ll obviously make a couple of qualifications. I’m only talking about the regular season and I’m comparing each team to its own era. I feel pretty confident that even the hapless 2003 Tigers could probably destroy the wonderful 1935 team, but we’re talking about each team in relation to its context. And by that measure, the 2013 club ranks at the top. Sort of. Technically they’re going to roll the odometer over into first place sometime this weekend, but I wanted to get a jump on it because I’m really into preparation.
This is a simple construct. I’m not counting wins and losses for a couple of reasons. First, wins or winning percentage don’t control for their competition. Winning 100 games when there were fewer teams and less reliever specialization is impressive, but I really don’t know how it compares to the modern day. We need to use numbers that control for the era, so we’re going to start with Wins Above Replacement (what’s WAR?), but I’ll run through some other numbers as well. Second, wins are tied to some aspect of randomness. Is a 98 win team better than a 95 win team just because the 95 win team lost some games at the end that didn’t mean anything? What I present below are each Tigers team’s total WAR (i.e. pitching + hitting + baserunning + defense). Please keep in mind the defensive and baserunning data from the past is an approximation and can’t be taken too seriously. That said, it’s the best information we have about those teams and we shouldn’t ignore it. Let’s take a look at the best Tigers teams by total WAR (cWAR) and also by WAR per Game because some teams played fewer games in a season.
| Rank | Season | cWAR | cWAR/G |
| 10 | 1909 | 47.2 | 0.311 |
| 9 | 1968 | 48.7 | 0.301 |
| 8 | 1946 | 48.7 | 0.316 |
| 7 | 1940 | 49.5 | 0.321 |
| 6 | 1915 | 50.2 | 0.326 |
| 5 | 1961 | 51.0 | 0.315 |
| 4 | 1935 | 51.0 | 0.338 |
| 3 | 1984 | 51.9 | 0.320 |
| 2 | 2013 | 52.6 | 0.344 |
| 1 | 1934 | 53.3 | 0.346 |
So the current Tigers trail the leader by 0.7 WAR and are averaging about .35 WAR per game, meaning that they are expected to accumulate something close to 3.1 wins over the remaining 9 games. It’s hard to imagine they will fall short of taking the overall record and need just 3.6 WAR to lead the per game pace. Maybe they fall short of the record, but they’re already 2nd and have a great shot to be first.
WAR isn’t perfect, but it’s the best way to discuss total, cumulative value. We can break it down into individual components to understand how the team ranks a little bit better. First, the pitching staff, which as you know has been working on one of the best pitching seasons of all time as a starting staff. They rank pretty well among Tigers teams:
| Rank | Season | pWAR | pWAR/G |
| 5 | 1942 | 23.9 | 0.155 |
| 4 | 2012 | 24.5 | 0.151 |
| 3 | 1940 | 25.1 | 0.163 |
| 2 | 1946 | 25.4 | 0.165 |
| 1 | 2013 | 26.2 | 0.171 |
They currently rank 25th in positional player WAR, but if you look only at what they do at the plate instead of defense and baserunning, you get a different picture.
| Rank | Season | AVG | OBP | SLG | wOBA | wRC+ |
| 10 | 1990 | 0.259 | 0.337 | 0.409 | 0.335 | 109 |
| 9 | 2011 | 0.277 | 0.340 | 0.434 | 0.337 | 109 |
| 8 | 1983 | 0.274 | 0.335 | 0.427 | 0.339 | 110 |
| 7 | 1986 | 0.263 | 0.338 | 0.424 | 0.338 | 110 |
| 6 | 1921 | 0.316 | 0.385 | 0.434 | 0.379 | 110 |
| 5 | 1915 | 0.268 | 0.357 | 0.358 | 0.350 | 111 |
| 4 | 1987 | 0.272 | 0.349 | 0.451 | 0.348 | 113 |
| 3 | 1993 | 0.275 | 0.362 | 0.434 | 0.354 | 114 |
| 2 | 2013 | 0.285 | 0.348 | 0.438 | 0.343 | 115 |
| 1 | 1984 | 0.271 | 0.342 | 0.432 | 0.345 | 115 |
This year’s team ranks 2nd, but only by the difference of a rounding error. Controlling for league and park effect, the 2013 Tigers and the 1984 Tigers are essentially offensive equals while the 2013 Tigers are easily the best pitching staff. Put that together and you have yourselves the best Tigers team of all time.
Now there are imperfections, but there are always such imperfections. Many believe this team has under-performed, but with a 5-4 final week, they’re headed for a 94 win season. That sounds pretty great to me. Maybe they haven’t punished the division like they did in 2011, but it’s important to remember to see your team in context. They’re the best hitting and pitching Tigers team ever. How much more could you ask of a team during the regular season?
The only reason they’re not blowing away the previous WAR record is that they don’t play great defense or run the bases too well, but even considering that they’re going to pass the record sometime very soon.
The World Series is the goal, but the season is the first step in that process. They could lose in the first round and the season would be a disappointment for sure, but to this point, this has been the best Tigers team we’ve ever seen. No matter what happens, that’s worth celebrating as the Tigers lock up the AL Central this week.
How Was The Game? (September 19, 2013)
Another step closer.
Tigers 5, Mariners 4 (Magic # = 4)
Doug Fister (31 GS, 201.1 IP, 3.71 ERA, 3.27 FIP, 4.4 WAR) was one pitch away from having a phenomenal start but will have to settle for a strong one as he went 7.2 innings, gave up 4 runs (3 on a HR), while walking one and striking out 10. Aside from the 5th inning bomb by Ackley, Fister handled the Mariners easily and kept his team in the game while they charged back. The Tigers had jumped out to a 3-1 lead on a Hunter HR, Martinez double, and Infante bases loaded walk across the first three innings, but the Ackley dinger left them trailing 4-3. Hunter, Fielder, Martinez, and Infante all registered hits in the 7th to push across two runs in the inning and the Tigers took the lead for good. Smyly and Benoit grabbed the final four outs and earned the club its 89th win with three against the White Sox coming this weekend. Also of note, Jose Iglesias was struck on the hand but X-Rays were negative. Prince Fielder also ate a fan’s nacho, so…yeah. Max Scherzer (30 GS, 201.1 IP, 2.95 ERA, 2.68 FIP, 6.1 WAR) will take the ball for the first of the set.
The Moment: Martinez doubles home Fielder in the 7th to take the lead – although Fielder didn’t exactly beat the tag.
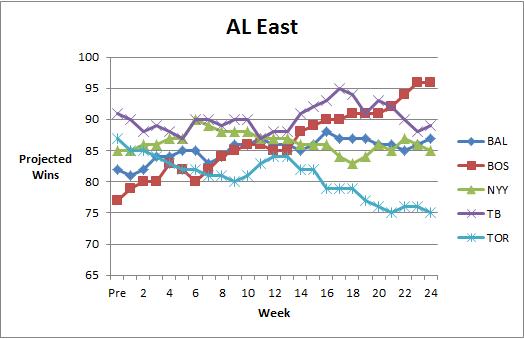
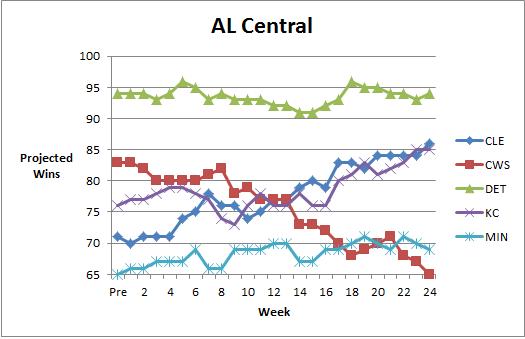
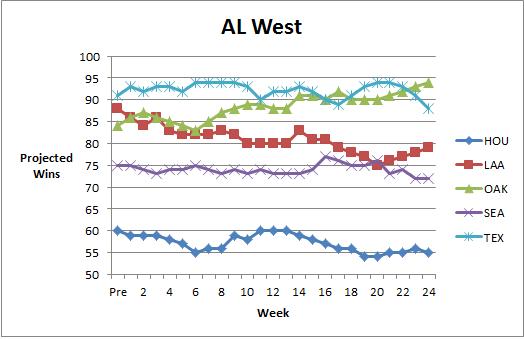
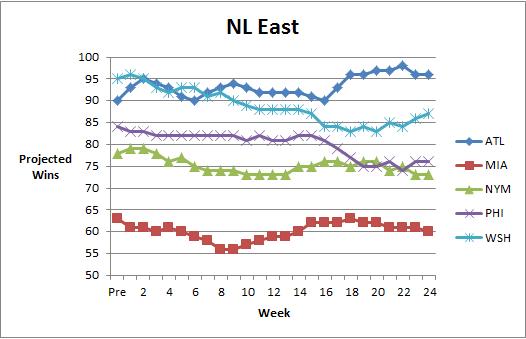
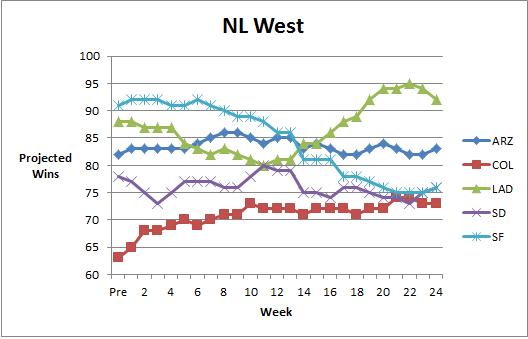
Dynamic Standings Projection (September 19, 2013)
In case you missed it, in April we launched our Dynamic Standings Projection feature on New English D. A full explanation of the methodology can be found here or by clicking the tab at the top of the page. This project seeks to provide a reasoned and cautious approach to updating our beliefs about the baseball future. You can find a summarization of the original projections here. You’ll notice a column on the far right that indicates the difference in projected wins from the preseason prediction. Positive numbers mean teams are now projected to win more games and negative numbers mean a team is now projected to win fewer games. You’ll notice a series of graphs below the standings section that track how the projections have evolved over the course of the year.
This Dynamic Standings Projection is updated through the September 18th games. Note that DSP posts have been moved to Thursday accommodate something that won’t interest you.
| 19-Sep | W | L | PreDiff | |
| BOS | 96 | 66 | 0.593 | 19 |
| TB | 89 | 73 | 0.549 | -2 |
| BAL | 87 | 75 | 0.537 | 5 |
| NYY | 85 | 77 | 0.525 | 0 |
| TOR | 75 | 87 | 0.463 | -12 |
| W | L | PreDiff | ||
| DET | 94 | 68 | 0.580 | 0 |
| CLE | 86 | 76 | 0.531 | 15 |
| KC | 85 | 77 | 0.525 | 9 |
| MIN | 69 | 93 | 0.426 | 4 |
| CWS | 65 | 97 | 0.401 | -18 |
| W | L | PreDiff | ||
| OAK | 94 | 68 | 0.580 | 10 |
| TEX | 88 | 74 | 0.543 | -3 |
| LAA | 79 | 83 | 0.488 | -9 |
| SEA | 72 | 90 | 0.444 | -3 |
| HOU | 55 | 107 | 0.340 | -5 |
| W | L | PreDiff | ||
| ATL | 96 | 66 | 0.593 | 6 |
| WSH | 87 | 75 | 0.537 | -8 |
| PHI | 76 | 86 | 0.469 | -8 |
| NYM | 73 | 89 | 0.451 | -5 |
| MIA | 60 | 102 | 0.370 | -3 |
| W | L | PreDiff | ||
| STL | 94 | 68 | 0.580 | 6 |
| CIN | 92 | 70 | 0.568 | 0 |
| PIT | 92 | 70 | 0.568 | 10 |
| MIL | 73 | 89 | 0.451 | -6 |
| CHC | 67 | 95 | 0.414 | -1 |
| W | L | PreDiff | ||
| LAD | 92 | 70 | 0.568 | 4 |
| ARZ | 83 | 79 | 0.512 | 1 |
| SF | 76 | 86 | 0.469 | -15 |
| SD | 76 | 86 | 0.469 | -2 |
| COL | 73 | 89 | 0.451 | 10 |

How Was The Game? (September 18, 2013)
Not one to put on the highlight tape.
Mariners 8, Tigers 0 (Magic # = 6)
Justin Verlander (32 GS, 206.1 IP, 3.66 ERA, 3.45 FIP, 4.5 WAR) pitched in a lot of traffic during the first three innings of tonight’s game and allowed two runs while doing so, but allowed just one baserunner in the game’s final four innings on a Justin Smoak homerun. It looked like he wasn’t on his game early, but straightened out as the game went on and was cruising at the end. In sum, he allowed 3 runs across 7 innings that included 3 walks and 6 strikeouts. On most nights, that would suffice for the Tigers lineup but they struggled a great deal against Iwakuma despite a couple of bases loaded chances, to say nothing of the extra five runs the bullpen allowed. With two already in the hopper against the Mariners, the Tigers won’t sweat the loss with Doug Fister (30 GS, 193.2 IP, 3.67 ERA. 3.30 FIP, 4.1 WAR) going Thursday afternoon looking to snag the series.
The Moment: FSD shows O-Swing% for the first time in recorded history. Wikipedia citations can refer to the following exchange:
How Was The Game? (September 17, 2013)
A night for the sluggers – Cabrera and Kelly.
Tigers 6, Mariners 2 (Magic # = 6)
Anibal Sanchez (27 GS, 172 IP, 2.51 ERA, 2.49 FIP, 5.7 WAR) continued his Cy Young push tonight with 6.1 innings of 2 run baseball that featured two walks and ten strikeouts. Sanchez was his typical brilliant self and was backed by solo homeruns from Don Kelly and Miguel Cabrera and aided by a sac fly from Torii Hunter that scored Jose Iglesias in the 7th inning to put the Tigers ahead for good before they padded the lead in the 8th. On a night in which the Tigers’ wives were collecting donations for the Tigers Foundation, the Tigers collected their 88th win of the season, tying their 2012 mark with 11 games left to play. They’ll look to lock up the series on Wednesday with Justin Verlander (31 GS, 199.1 IP, 3.66 ERA, 3.41 FIP, 4.5 WAR) looking to remind his manager that he’d like to start game one of a playoff series.
The Moment: Don Kelly puts the Tigers on the board first with a solo shot.
Prince Fielder’s Streaky Season

Prince Fielder isn’t having a great season compared to the bar he’s set for himself. I covered the issues a couple of months ago and chalked it up to a whole host of things. Primarily he wasn’t making as much contact as the previous two seasons and he wasn’t hitting for the same kind of power he had during the seasons prior to that. In other words, as he matured into a more well-rounded hitter he started to rely more on contact and his contact numbers were down. Mix that with some BABIP luck and you’re stuck with a graph that looks like this (From the original post):

Since I wrote the post he had a a rough couple weeks and then snapped out of it. His wRC+ is only up to 126 for the season, but he’s hit a lot better since early August and is putting up the kind of numbers you would expect from him over his last 39 games. Let’s take a look at his season in four parts:
| Date | Games | PA | AVG | OBP | SLG |
| 4/1 – 5/10 | 33 | 154 | 0.298 | 0.422 | 0.573 |
| 5/11 – 6/21 | 39 | 171 | 0.263 | 0.339 | 0.395 |
| 6/22 – 8/6 | 39 | 169 | 0.219 | 0.302 | 0.351 |
| 8/7 – 9/16 | 39 | 170 | 0.344 | 0.400 | 0.539 |
The cutoffs are arbitrary to some extent, but every cutoff is arbitrary if you really think about it. Fielder started hot, slumped, slumped hard, and then caught fire. These are four roughly equal collections.
In the first act, Fielder was excellent as he hit for high average, walked plenty, and hit for power. That’s the Prince Fielder who signed a $200 million contract! Act two is a drop in batting average and a drop in power. Act three is a loss of average but no drop in power. To demonstrate, he are his ISOs from the four acts (ISO = SLG – AVG):
| Date | ISO |
| 4/1 – 5/10 | 0.275 |
| 5/11 – 6/21 | 0.132 |
| 6/22 – 8/6 | 0.132 |
| 8/7 – 9/16 | 0.195 |
You can see quite clearly that when Fielder got a hit in the third act, the odds it was for extra bases was pretty consistent with act two, he just got many fewer hits period. But then his season started to turn around and while he hasn’t recovered his power from April, he’s hitting for more power, and a way higher average since August 7th.
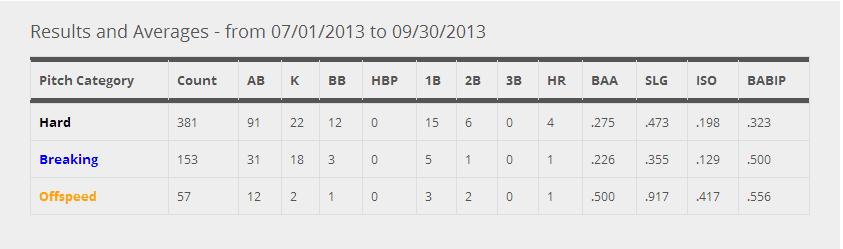
It’s actually kind of remarkable if you separate it out by hard, breaking, and offspeed pitches. Let’s look at batting average and slugging percentage for each.
HARD
| Date | BA | SLG |
| 4/1 – 5/10 | 0.297 | 0.676 |
| 5/11 – 6/21 | 0.225 | 0.348 |
| 6/22 – 8/6 | 0.200 | 0.278 |
| 8/7 – 9/16 | 0.364 | 0.560 |
BREAKING
| Date | BA | SLG |
| 4/1 – 5/10 | 0.353 | 0.500 |
| 5/11 – 6/21 | 0.343 | 0.600 |
| 6/22 – 8/6 | 0.293 | 0.659 |
| 8/7 – 9/16 | 0.349 | 0.698 |
OFFSPEED
| Date | BA | SLG |
| 4/1 – 5/10 | 0.188 | 0.250 |
| 5/11 – 6/21 | 0.296 | 0.296 |
| 6/22 – 8/6 | 0.200 | 0.200 |
| 8/7 – 9/16 | 0.192 | 0.308 |
If the pattern doesn’t jump out to you, allow me to demonstrate. He was still hitting breaking balls well and he was pretty consistent against offspeed pitches. Look at the fastballs, my god, look a the fastballs. His batting average and slugging percentage against fastballs plummeted between act one and two and the average dropped off a little more into act three. Now he’s back in business, but man, that thing cratered.
Fielder couldn’t get around on a fastball to save his life for about 80 games and now he’s doing it again. I’m not going to make any connections between issues he’s having in his personal life and his performance. There could have been an injury or a mechanical adjustment that needed to be worked out. But the evidence is pretty clear and pretty stark.
Prince Fielder couldn’t hit fastballs. He didn’t slump the same way against the other pitches and obviously batters see more fastballs than anything else so it’s going to drive a lot of their performance. There’s certainly a game theory/sequencing thing about what pitches are used when that we can’t really untangle right now, but it certainly appears as if Fielder just went through a period of time – for whatever reason – in which he couldn’t catch up with a fastball. That stretch has been over now for 39 games and 170 PA. He’s crushing the baseball since August 7th and the Tigers are reaping the rewards.
There’s no reason to thing this problem will reoccur, so there’s no reason to thing Fielder won’t continue to mash heading into October. Whatever was going on from May 11th to August 6th is behind him and the guy who cleans up after Miguel Cabrera appears to be back.
How Was The Game? (September 16, 2013)
Another Porcello gem.
Tigers 4, Mariners 2 (Magic # = 8)
The Tigers grabbed an early run and then added on in the 6th inning, which would be plenty for Rick Porcello (28 GS, 168 IP, 4.45 ERA, 3.69 FIP, 2.7 WAR) who was fantastic again across 6 innings at Comerica Park. Porcello allowed a solo homerun and two walks, but was aces otherwise as he struck out 10 and breezed through the rest of the ballgame. The big strikeout total lifts his 2013 K% to 18.5%, which is nearly 5% higher than his previous career high (13.7%) as he makes a run at a career high in WAR (2.7 in 2013, 2.9 career best). The win is the Tigers’ 87th on the season and drops their magic number to 8 with another game against the M’s coming Tuesday as Anibal Sanchez (26 GS, 165.2 IP, 2.50 ERA, 2.47 FIP, 5.5 WAR) takes the hill.
The Moment: Porcello punches out 10, marking his second straight excellent start.
Alex Avila Returns To Form
There was a time earlier this year when I advocated sending Alex Avila down to Toledo. He was lost. He was hitting .166/.265/.280. He showed the occasional flash, but it was mostly one of those horrible stretches in which a player is stuck in between and can’t find his way out. But very shortly after that he took one on the wrist and jumped on the DL. It was June 16th and he had a .560 OPS.
But Avila has been himself since the injury and even better if you put the cutoff at the All-Star Game, hitting .284/.360/.485 since the wrist injury and .313/.376/.545 since the break. He’s been the Avila we saw in 2011 as he’s posted a 153 wRC+ since the break compared to 141 wRC+ over all of 2011. It’s probably wrong to think he’s going to be that player consistently, but it’s not wrong to be optimistic that the worst is behind him.
The statistics tell a convincing story. If we drop the cutoff before and after his two week break due to injury or at the ASG, Avila looks much more like the player we thought he would be. Granted, sample sizes can always cloud your vision when it comes to statistics, but the actual swing mechanics have looked so much better ever since he got back. The flashpoint for me was the go-ahead homerun in Cleveland on August 5th where he cleared the high wall in LCF.
I’ve always though Avila was at his best when he took a short path to the ball and drove pitches to left center and he’s doing that again in a big way. Let’s draw the line at the wrist injury which puts about 190 PA on one side and 150 on the other. Neither is huge, but they aren’t way out of proportion.
First the spray charts:
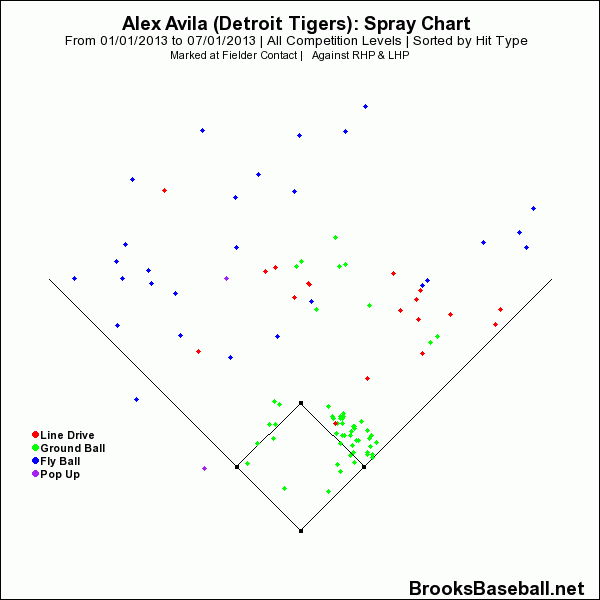

Not only is he less pull happy overall, but when he goes the other way he’s now hitting the ball on a line much more often.
His batting average and slugging percentage are up against almost every type of pitch (only slugging against sinkers is down). Let’s simplify that and take a look at hard, breaking, and offspeed pitches:

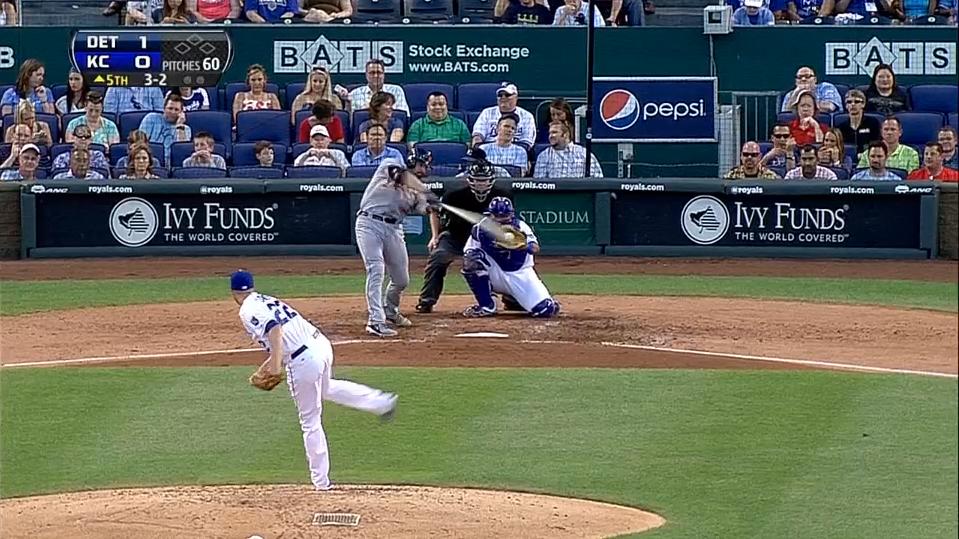
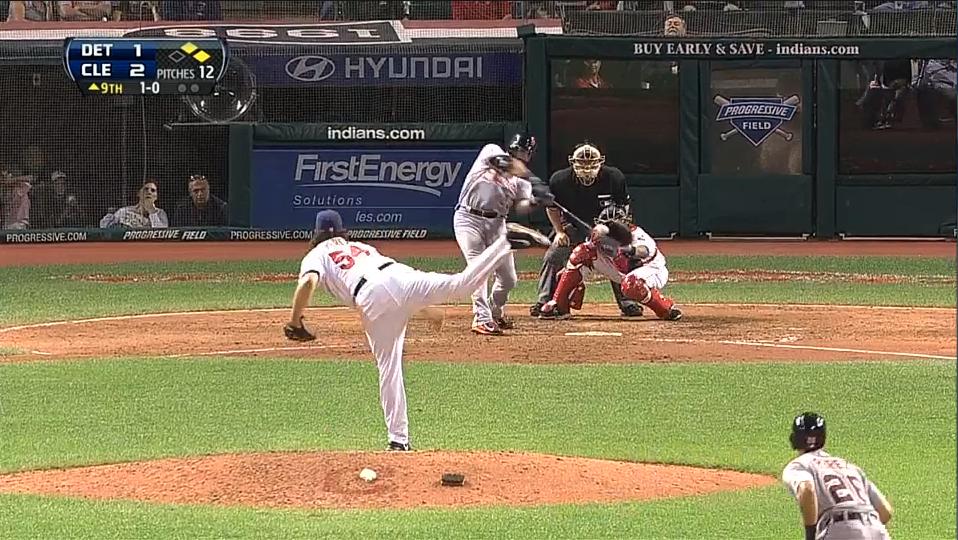
So Avila is driving the ball to the left center field gap and he’s doing much better against breaking balls and offspeed pitches. This probably isn’t surprising information considering how much his numbers have picked up. The swing is a lot shorter to the ball and it’s been a huge improvement. I wish I was adept at GIF-making, because a visual illustration would be great. Below are two screenshots from pitches at nearly identical locations at very similar speeds. He misses the first and hits the second for a game winning homerun. I think you can see the slightly more compact swing in the second, but if you can’t, that’s more my visualization abilities than anything else.
Also, one of Avila’s big problems during the slump was his awful numbers against lefties. Granted, he’s still not tearing it up against southpaws and neither is a big sample, but the comparison is striking. In 26 AB against lefties before the injury he hit .038/.100/.038. In 45 AB since, he’s .222/.314/.378. Add that to his ability to mash righties lately (Since the injury, 315/.384/.539 against RHP) and you’re in business.
He’s improved against lefties and he’s gotten better overall, but you don’t just see it in the numbers. The spray chart tells the same story and the video does as well. It’s all looking up for Avila who has been worth a full win above replacement since the break and has himself up to 90 wRC+ for the season despite the terrible start. It’s not going to be a Silver Slugger year for the Tigers backstop, but ending the season like this is a very good sign for the future. He’s never going to be the most durable player and it’s probably wrong to expect him to be a 5 win player like he was in 2011, but there’s no reason we shouldn’t expect him to be an above average catcher for the next couple of seasons.
The swing is back and he has the number to prove it. And really, if he delivers in October and helps the Tigers win a World Series, is anyone going to care how he hit in May?
