Miguel Cabrera Does Not Respect Inside Pitches

I’m not the first person to point this out, so don’t give me all the credit, but Miguel Cabrera is a really good hitter who destroys the baseball pretty much anywhere it’s pitched. But this year, he’s crushing the inside pitch. He’s always been good, but this year we’re seeing a ton of homeruns on pitches that most hitters literally couldn’t even foul off. Let’s take a look.
Here are his 38 HR so far with an approximate strikezone from the catcher’s perspective measured in feet:
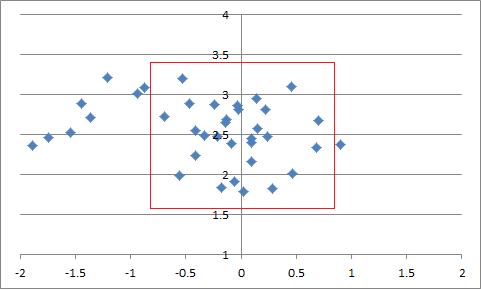
Most of them have been in the zone, but there have been a handful that were way off the plate. Six to be precise. You’ll notice two that were just off the plate, but those seem human. The other six don’t. What do we know about those homeruns?
They were all fastballs.
None of them had more than 7.5 inches of horizontal movement.
They all came when the count was even or Cabrera was behind.
The slowest was 91 MPH, the fastest was 96 MPH.
Five went to left field, one went to center field.
What have we learned from this demonstration? Probably something we already should have known. You can’t get Cabrera out inside and you especially can’t do with with run of the mill fastballs even when you’re ahead in the count. I looked at how you might try to get him out earlier this season and my advice was hard stuff up and away and breaking balls down and away. You have to make him chase, you can’t jam him inside because he can apparently hit homeruns on pitches two feet from the center of the plate.
But I was also curious if this was new for Cabrera. I don’t remember him hitting this many homeruns on inside pitches, which poses the question, “is he getting better?” Let’s take a look at all of his homeruns from 2008-2012:
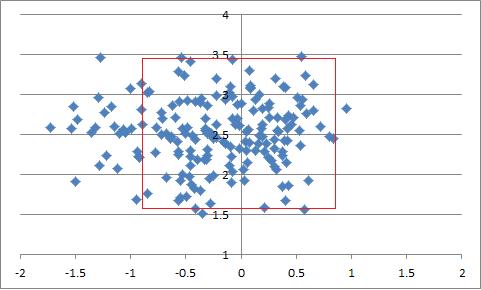
Apparently, this isn’t terribly new for Cabrera. We might be noticing it more, but he’s been doing it forever even if he is a few ahead of his pace in 2013. Of the 16 pitches that he hit out from 2008-2012 on inside pitches, all of them were fastballs. None of them above 96 and only four came with Cabrera ahead in the count. I’m starting to see a pattern here.
If we do a quick search of every homerun that was off the plate inside to righties (not just the really far inside ones), Cabrera leads baseball by a ton. He has 53 homeruns on pitches off the plate inside since 2008, the next closest RHH is Ryan Zimmerman with 31.
In fact, his homerun against Phil Hughes last Saturday was the furthest inside pitch to be hit out by a righty since Pitch F/X started recording the data. In fact of the 11 most inside pitches hit out by righties since 2008, 6 of them are Miguel Cabrera. Now some of that is selection bias because he’s hit the most homeruns, but 6 of 11 is way of out proportion. He’s a monster.

And he also does this. (Click to play if it doesn’t run automatically on your browser).
Editor’s Note: For more on this subject, the great Jeff Sullivan at FanGraphs published a piece with the same premise less than a minute after this post went live. A lot of cool images and GIFs, go read it.
How Was The Game? (August 14, 2013)

A nice recovery.
Tigers 6, White Sox 4
After a few days of coming up short and a bad start to this one, the Tigers recovered nicely to win the final game of the series against the Sox. Rick Porcello (22 GS, 131 IP, 4.33 ERA, 3.42 FIP, 2.5 WAR) didn’t have a great first inning and had to pitch around 2 infield hits, but settled down nicely after the 3 run first and allowed no additional runs. He gave the Tigers 6 and allowed 3, while striking out 4 and walking 1. The Tigers scored in bunches today as Cabrera knocked a 3 run HR in the 3rd and the Tigers scored 3 in the 6th on an RBI single and then a horrible defensive play by the White Sox cornermen. Porcello gave way to the pen for the final three, who managed to keep the Sox from rallying back and sent the Tigers to win #70 on the season and a 6-4 road trip. In fact, Leyland called on Benoit for a five out save in a stunning turn from his refusal to use him in a tie game 3 times in the previous 5 days. The Tigers will return home for a five game series against the Royals in which they will have a shot to put some series distance between them in the Central. They will send Anibal Sanchez (24 GS, 164.1 IP, 2.58 ERA, 2.40 FIP, 4.2 WAR) to the mound for the first game on Thursday evening.
The Moment: Cabrera ties it with a no doubter to left.
How Was The Game? (August 13, 2013)
One you put on the manager.
White Sox 4, Tigers 3 (11 innings)
The Tigers took an early 1-0 lead on the Sox, but saw it vanish on one ill-conceived pitch from Max Scherzer (24 GS, 164.1 IP, 2.85 ERA, 2.70 FIP, 5.0 WAR) to Avi Garcia and then a strange defensive exchange between Infante and Cabrera that allowed Garcia to score behind the two men he knocked in. Scherzer was relatively comfortable other than those three runs as he finished with 6 innings, 4 hits, 3 runs, 3 walks, and 6 strikeouts and looked fine aside from the nightmare play that resulted in 3 runs. The Tigers got men on base all night but took a long time to score them as they scratched across single runs in the 6th and 8th innings to tie, the latter thanks to some wonderful pinch running by Don Kelly. As this one went to extra innings, it was Jim Leyland’s time to give the game away as he called for multiple rally killing bunts and refused to use Joaquin Benoit in a tie game on the road because he was waiting for a save that wasn’t coming. It was the third extra inning game in the last week in which Leyland didn’t use Benoit, and the Tigers lost all three. Maybe they lose them anyway, but you have to give yourself a chance. They’ll try to salvage one on Wednesday behind Rick Porcello (21 GS, 125 IP, 4.32 ERA, 3.49 FIP, 2.3 WAR).
The Moment: Pena drives in Kelly to tie it in the 8th.
10 Facts About Miguel Cabrera’s Amazing Season
I’m beyond analyzing Miguel Cabrera. His offensive ability is so good that it is boring. There’s nothing left for me to say. He’s off the charts incredible. Clearly the best hitter of the moment, and starting to push his way into conversations with the words “era,” “generation,” and “ever.” You know the drill. Let’s consider his amazing 2013 season. All statistics as of the start of play on August 13.
1. By Weighted Runs Created Plus or wRC+ (what’s wRC+?), Cabrera is having the 15th best offensive season in baseball history. Every player on the list ahead of him is an inner circle Hall of Famer or is Barry Bonds. Ruth, Williams, Bonds, Hornsby, and Mantle are the only players in history with even one season of 210 wRC+ or better.
2. Cabrera is having the best offensive season of his career by far, obviously, but did you know it’s 33% better than his previous high and 44% better than the year he won the Triple Crown?
3. This is the best offensive season in Tigers history, besting Cobb’s 1910 by 4%.
4. Miguel Cabrera is having the 2nd worst defensive season in his career by UZR (what’s UZR?), but is still already a half a win better by WAR (what’s WAR?) than his previous high despite there being 45 games left in the season.
5. Using Weighted On Base Average (what’s wOBA?), because it’s easier for me to calculate, if everyone else in the league stayed on their current pace, Cabrera would have to go 0 for his next 50 in order for Chris Davis to catch him. If Cabrera didn’t get a hit in the next 12 games, he’d still be the best hitter in the league.
6. Cabrera could go 0 for his next 25 and still have a higher OBP than Joey Votto has right now. Votto has baseball’s second best OBP.
7. If Cabrera went 0 for his next 70, he would still be second in baseball in slugging percentage.
8. The ZIPS projection system estimates Cabrera will get 185 more plate appearances before the season is over. If he made an out during every one of them he would still have the 39th best OPS in the league at .812. The only players on the Tigers with an .812 OPS or better right now besides Cabrera are Peralta (.822 in 436 PA), Tuiasosopo (.919 in 144 PA), and Doug Fister (1.333 in 4 PA).
9. Cabrera currently has the best batting average of his career by 22 points, best OBP by 9 points, and bests SLG by 70 points. He’s 8 HR shy of setting a new career high. Since the start of 2009, he leads baseball in HR, R, RBI, AVG, SLG, wOBA, wRC+, and WAR. He trails Votto by .009 in OBP.
10. Among players with fewer than 7,000 career plate appearances only 6 have more career WAR than Cabrera.
| Name | G | PA | WAR |
| Hank Greenberg | 1394 | 6096 | 61.1 |
| Joe Gordon | 1566 | 6536 | 60.6 |
| Joe Jackson | 1332 | 5690 | 60.5 |
| Frank Baker | 1575 | 6660 | 60.1 |
| Jackie Robinson | 1382 | 5802 | 57.2 |
| Elmer Flick | 1483 | 6414 | 56.0 |
| Miguel Cabrera | 1621 | 6964 | 55.2 |
By wRC+, Miguel Cabrera is the 25 best hitter in baseball history at 153 for his career.
How Was The Game? (August 12, 2013)
A loss, but with one heck of an exclamation mark.
White Sox 6, Tigers 2
The Tigers got to Chris Sale for two early runs courtesy of a Cabrera bomb and a Pena double, but a 3 run 5th inning doomed Doug Fister (24 GS, 155 IP, 3.60 ERA, 3.34 FIP, 3.2 WAR) and the Tigers thanks to a couple of goofy plays and some poorly timed control issues from Fister. He didn’t pitched terribly, going 6 innings and allowing 4 runs, but after three strong innings to start the game he played in traffic for most of the night. The bats had a great chance to get to Sale in the 6th as Cabrera and Fielder hit back to back hard singles, but a FC by Martinez and a fly out to the wall in center by Tuiasosopo kept the Tigers from cashing in. The story, however, was a ridiculous play by Jose Iglesias. Here is a link to a video and here is a link to a GIF (h/t @Sporer). Below is a screen shot of the basic concept. It was stupid good.

The loss is the Tigers 3rd in the last 4 games, but after a stretch where they won 16 of 17, one can’t be too upset. They’ll turn around and send Max Scherzer (23 GS, 158.1 IP, 2.84 ERA, 2.69 FIP, 4.8 WAR) to the mound for game two on Tuesday.
The Moment: Jose Iglesias does something that the author has a difficult time describing.
Victor Martinez’s 2013 Season Explained Graphically
We’re all pretty clear on the basic structure of Victor Martinez’s 2013 season. His numbers were bad during the first few months and then he started having excellent numbers and now his season long stats are all pretty solid. I argued earlier this season that Martinez was getting supremely unlucky and those claims were supported when Martinez started crushing it.
I’d like to update you on his pace with a few graphics. I don’t have any crack analysis because I’ve already done that part. His numbers were bad, I told you why. His numbers got better, I told you why. Now I just want to show you a full picture with a few graphics. Enjoy!

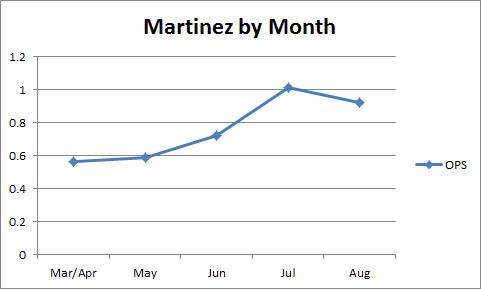
First we have his average, on base, and slugging percentage at the end of every game. Since above game 70, he’s been incredible and pulled out of his early season slide:
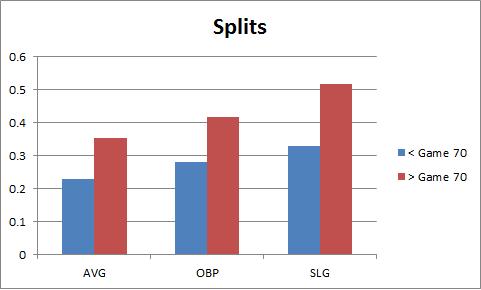
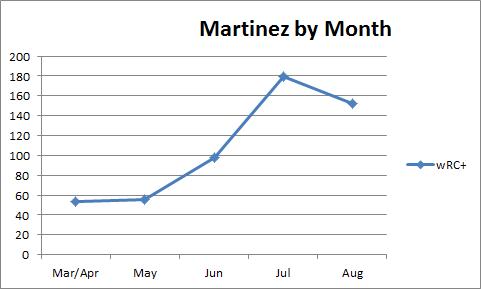
If you drop a line at game 70 and split the numbers, he was not very good beforehand and is a borderline MVP after. The cutoff is arbitrary, but there are more than 200 PA on each side. Let’s check out his monthly splits by OPS, wOBA (what’s wOBA?), and wRC+ (what’s wRC+?).

Like I said in the first citation, his bad luck on hard hit balls is regressing amazingly to the mean in his batting average on balls in play (what’s BABIP?). I drew in his career average to show exactly how amazing it is. Perfect balance:
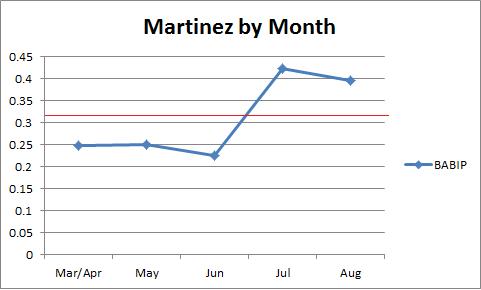
Martinez was having bad luck and now he’s not anymore. The two links at the top of the post break it down and these graphs sum it up. Martinez was having a lousy season as far as results went, but then the hits started to fall and he’s come racing back. We always knew they would because he’s been near the top of the hard hit average leaderboard and stands at 6th in MLB entering the day. He’s now having an above average season overall (102 wRC+) and is still on the rise.
How Was The Game? (August 11, 2013)
Something you’re not going to believe.
Yankees 5, Tigers 4
It’s unclear where to start, so let’s just lay it all out. Justin Verlander (25 GS, 158.2 IP, 3.57 ERA, 3.40 FIP, 3.5 WAR) gave up 4 runs in 7 innings, but had a very nice afternoon courtesy of a good fastball and excellent curveball that yielding just 1 walk and induced 9 strikeouts. Verlander gave up two solo homeruns which barely cleared the short fences at Yankee Stadium and would have been easy outs in more parks, so I certainly won’t hold that against him when attempting to discern performance from statistics. The signs were all good regarding his road back to dominance as his average fastball registered 95.3 mph and his release point was in line with his most recent start.


The bats failed the Tigers early as they left a ton of men on base and gave away outs at inopportune times, but things turned late. It didn’t help that Iglesias was called out at 2B in the 8th when he was clearly safe or that Jackson made a boneheaded mistake in thinking Garder dropped a ball in the next at bat but a Pena homer to lead off the 8th and a Cabrera homerun off Rivera in the 9th to make it a one run game set up a huge bomb by Martinez to tie it against Rivera for the second time this weekend. It was a great comeback, but it was for naught as Gardner walked off in the 9th. The Tigers will head to the Windy city for a three game set against the Sox with Doug Fister (23 GS, 149 IP, 3.50 ERA, 3.30 FIP, 3.2 WAR) getting the ball on Monday.
The Moment: Cabrera and Martinez launch homers in the 9th to stun Rivera.
How Was The Game? (August 10, 2013)
Another breezy win.
Tigers 9, Yankees 3
After surrendering their 12 game winning streak on Friday in extra innings, the Tigers handled the Yankees easily on Saturday. They won the war on both fronts as Anibal Sanchez (20 GS, 125.2 IP, 2.58 ERA, 2.41 FIP, 4.2 WAR) was excellent across 7 innings (4 H, 2 R, 1 BB, 8 K) and the bats sent Hughes to the showers early. The Tigers first three hitters all homered during the game and 5 players reached base at least twice. Jackson stayed hot, Cabrera stayed hot, and Hunter, Kelly, and Iglesias also did things that improved the team’s chances of winning. It was never really in doubt as the Tigers won their 17th game in their last 19 tries and improved to 69-46 on the season. They will look to take the series on Sunday with the newly himself Justin Verlander (24 GS, 151.2 IP, 3.50 ERA, 3.33 FIP, 3.5 WAR), who lowered his ERA between starts thanks to a scoring change.
The Moment: Cabrera turned on a Hughes pitch and sent it out to left field.
How Was The Game? (August 9, 2013)
The end of a great run.
Yankees 4, Tigers 3 (10 innings)
It had to end sometime. Logic dictated that. You can’t win every game and the longer your streak goes the more improbable it gets. After 12 straight victories and a figurative funeral for the rest of the division, the Tigers finally lost on Friday. Rick Porcello (21 GS, 125 IP, 4.32 ERA, 3.49 FIP, 2.3 WAR) was solid, and a Robinson Cano double on a pretty good changeup was the difference between a very good start and a pretty good one. He only went 5 innings but struck out 6, walked 2, and surrendered 3 runs. On most nights, that’s good enough for the Tigers offense but Ivan Nova escaped a few jams against the Tigers, who only cashed in with the starter in the game during the 7th inning on a Cabrera single. Jackson had a good night, but the Tigers simply didn’t get hits with men on base, which is going to happen from time to time and especially when you’ve just completed the type of run the Tigers went on. It got extremely interesting, however, when Miguel Cabrera launched a 2 out, 2 run, game-tying homerun to dead center off Rivera and sent the game into extras. Despite the amazing turn of events, the Yankees rallied against Alburquerque in the 10th while Benoit sat alone in the bullpen waiting for a save that would never come. The streak is over, but the Tigers have still won 16 of their last 18 games and saw the Indians fall on the out of town scoreboard so they will remain 7 up in the Central with 48 to play. They’ll play a matinee at Yankee Stadium with Anibal Sanchez (19 GS, 118.2 IP, 2.58 ERA, 2.37 FIP, 4.1 WAR) on the bump.
The Moment: Cabrera hits a game tying homerun with two outs in the 9th against Mariano Rivera
Joaquin Benoit: Evolution of a Reliever

This post will make no further reference to Joaquin Benoit being the Tigers’ closer. I don’t believe in the closer myth and would rather run the bullpen much differently. That said, good relief pitching is important and having and using good relievers is essential to success. One of the key cogs in the current Tigers bullpen, Benoit, is having a great season and deserves some credit.
Let’s start with some particulars from 2013. He’s thrown 47 IP with a 1.53 ERA, 2.15 FIP, and 1.5 WAR. Those three marks are 9th, 14th, and 15th among qualified MLB relievers this year. By our own reliever stat, SOEFA, he ranks 7th among pitchers with at least 20 innings pitched. By all accounts, he’s having a great year and you know he’s had great years in the past.
This isn’t a particularly groundbreaking analysis piece, but rather more a recognition that Benoit was become a very good reliever and has been good for a pretty long time. Let’s start from 2006 when he became a full time relief pitcher and work forward. And let’s start with ERA, FIP (what’s FIP?), and xFIP (what’s xFIP?) and lets park adjust them because he’s played in a few different stadiums that are somewhat extreme. These numbers are easy to understand. 100 is league average during each season and a point below or above is a percent better or worse than average. The lower the better, just like ERA. Note that he missed 2009 with an injury:

You can see he’s been above average for the most part in his entire relief career. 2010 was his golden season, but 2013 is pretty darn close. For a reliever, strikeouts and walks are key and he’s made some nice gains over time:
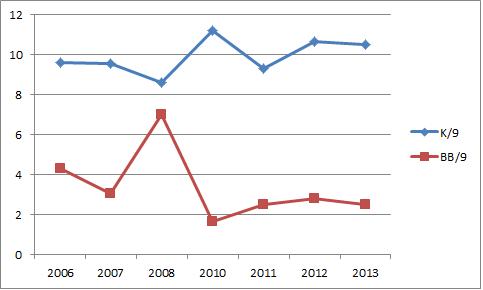
2008 is obviously the outlier, probably due to the coming injury, but overall the BB rate came down in a big way compared to before the injury and the strikeout rate has steadily risen. He’s cut his HR rate quite a bit this year, but that’s mostly a fluky small sample thing which will regress up a bit, but not so much that it will dramatically shift the results. Across the board, there aren’t a ton of other underlying numbers that have my attention except for the one that’s about to come.
Something I noticed in Jose Veras when the Tigers traded for him was that he’s getting ahead of hitters with first pitch strikes. Benoit is working the zone early too:

Since the rotator cuff injury, he has gotten better. Some of that might be maturity and between his ears, but some could be a health factor. Benoit has taken a step forward as he’s aged despite most relievers having a short shelf life. The ability to throw strikes is critical to a reliever’s success and Benoit is getting better at it early in counts. He’s not hitting the zone more, he’s just doing it earlier. That’s very valuable thing. His velocity improved after the injury, but it’s been constant since. I’m interested in the movement. The top charts (H/T FanGraphs) are 2008 and the bottom are 2013:


You can see more consistency and separation in his pitches. He’s better. More first pitch strikes, more consistent pitches, more strikeouts, fewer walks, and better overall results. Benoit’s been a very good reliever for what’s going on quite a few seasons. In over 400 MLB innings since the start of 2006, he has an ERA- of 73 and FIP- of 77.
And he’s heading onto the open market next season with the shine of a big season. He’s done that before and it paid him nicely.
