How Was The Game? (July 13, 2013)

Probably good for the balance of the universe, but not how you want to see it happen.
Rangers 7, Tigers 1
The tag line above refers to the fact that Max Scherzer (13-1, 129.2 IP, 3.19 ERA, 2.69 FIP, 4.0 WAR) was handed his first loss at the hands of baseball’s best pitcher who somehow wasn’t given an All-Star nod, Derek Holland. Scherzer wasn’t at his best, allowing 4 runs across 6 innings while striking out 6. Most of Max’s trouble came in a 3 run 4th, but given how well Max has pitched, one can’t really be upset. Max gave the Tigers a 4.0 WAR first half. The offense couldn’t do much against Mr. Holland and the Tigers only run was driven in by Hernan Perez, so that pretty much tells you everything you need to know. The Tigers will have chance to take the series Sunday in the final game before the break with Justin Verlander (9-6, 119 IP, 3.71 ERA, 3.22 FIP, 2.9 WAR) taking the hill.
The Moment: Perez drives in his first MLB run.
12 Other Reasons To Kill The Win
Over the last few weeks I’ve been breaking down reasons to ignore the pitcher win and I think the case is pretty airtight. First I gave you the 9 best seasons under 9 wins, then I gave you the 9 worst 20 win seasons, and showed you that wins do not even out over a career. Finally, I presented a case study in wins using Cliff Lee and Barry Zito’s 2012 season. The evidence is clear, wins do not reflect individual performance and shouldn’t be used as such. But if you’re not convinced, read this and tell me what you think (all numbers for starting pitchers from 2013 entering 6/13):
- A pitcher has gone 6+ IP and allowed 0 ER and not earned a win 68 times.
- If you lower that to 5+IP and 0 ER, it goes up to 82 times.
- A pitcher has gone 6+ IP and allowed 4 or fewer baserunners and not earned a win 50 times.
- A pitcher has gone 6+ IP, allowed 4 or fewer baserunners AND allowed 0 ER and not earned a win 20 times.
- A pitcher has gone 8+ IP and allowed 1 or fewer ER and not earned a win 23 times.
- A pitcher has gone 8+ IP and allowed 1 or fewer ER and earned a LOSS 4 times.
- A pitchers has gone 5 IP or fewer and allowed 10 or more baserunners and earned a win 29 times.
- A pitcher has gone 6 IP or fewer and allowed 5 ER or more and earned a win 12 times.
- A pitcher has allowed 6 ER or more an earned a win 7 times.
- A pitcher has walked 6 or more batters and earned a win 9 times.
- A pitcher has allowed 12 baserunners or more and earned a win 23 times. Only two of them went 7 or more innings.
- A pitcher has gone 7+IP with 10+ K, 2 or fewer BB, and 3 or fewer ER and not earned a win 28 times.
So let’s review. You can have a great season and win fewer than 9 times. You can have a below average season and win 20. You can have a much better career than another pitcher and finish with the same winning percentage. A pitcher can dramatically out pitch another and have way fewer wins in a season. And finally, the above 12 things can happen…before the All-Star break.
I’ll close with this. In 2012 a pitcher went 7 or more innings and allowed 0 ER 363 times. They didn’t earn a win 57 times in those starts. Do we really care about a statistic that says a pitcher who goes 7 or more innings while allowing 0 ER shouldn’t get a win 16% of the time?
I know I don’t.
The Nine Most Average Homeruns of the First Half
Homeruns are popular. They’re valuable, but their popularity probably outweighs their actual awesomeness in my mind. That’s me. You’re welcome to have your own view. Below, courtesy of ESPN’s Homerun Tracker we have a lot of cool information about every homerun in MLB this season including distance, speed off the bat, peak height, and a number of other things.
I’m often interested in league averages and deviations from average, so this should serve as the baseline for which homers should be judged. Below is a list of The Nine Most Average Homeruns of the First Half of 2013 (excluding the final two days). To calculate the most average homers I took the percent deviations from average of distance, speed off the bat, and peak height, squared them, and summed them together. These are the homeruns with values closest to zero.
For reference: League Average Distance is 397 feet, League Average Speed Off The Bat is 103.4 mph, and League Average Peak Height (Apex) is 87.2 feet.
(Distance in Feet/MPH/Height in Feet)
9. Starling Marte, Pirates (May 4th off Stephen Strasburg)
399/101.2/87
8. Edwin Encarnacion, Blue Jays (June 11 off Jose Quintana)
390/102.4/87
7. Billy Butler, Royals (July 9 off CC Sabathia)
402/102.8/86
6. Mike Moustakas, Royals (May 8 off Chris Tillman)
398/104.7/86
5. Ryan Braun, Brewers (May 22 off Hyun-Jin Ryu)
403/102.6/87
4. Andrelton Simmons, Braves (May 6 off Bronson Arroyo)
394/103.9/87
3. Luis Valbuena, Cubs (April 19 off Marco Estrada)
398/104.3/87
2. Matt Carpenter, Cardinals (July 10 off Wesley Wright)
399/103.5/87
1. Jordy Mercer, Pirates (May 3 off Ross Detwiler)
396/103.5/87
I’m not sure how much this list can tell you about specific players, but hopefully it’s a nice demonstration about what the average homerun looks like. If you’re curious, the link to the ESPN list has video of each homerun so you can get an even better idea on video.
Craig Biggio: Double Play Escape Artist
I recently wrote a piece over in the Community Research section at Fangraphs paying tribute to Craig Biggio’s amazing 1997 season. Not only did he lead the league in WAR, but he did so with one of the most balanced and complete seasons in recent memory. More interestingly, in my opinion, is that Biggio went the whole season without grounding into a single double play. In 78 chances, he hit into exactly 0 double plays. Only 7 qualifying MLB since 1939 (as far back as the data goes) have ever finished a season with zero GIDP and three did so in a strike shortened campaign.
The Morning Edition (July 13, 2013)
From Last Night:
- Price gives up 2 runs in a CG against the Astros and loses…to Jared Cosart in his MLB debut, who went 8 scoreless
- Kluber twirls a fine outing, Indians beat the Royals
- Marlins rough up Strasburg, chase him after two
- Chris Davis homers, Orioles win, lather, rinse, repeat.
- Pirates grab a walk off single in 11 against the Mets
- Arroyo shuts down the Braves, Dusty listens and drops Cozart to 7th
What I’m Watching Today:
- Burnett faces the Mets (7p Eastern)
- Lynn and Garza in Chicago (7p Eastern)
- Holland and Scherzer (7p Eastern)
- Jose Fernandez faces the Nats (7p Eastern)
- Felix against the Angels (10p Eastern)
The Big Question:
- Who are your first half ROY?
Let’s break it down by position players and pitchers. For the NL position player, Puig is a pretty good choice with his 2.1 WAR and 198 wRC+, but he’s short on games. Pollack (2.1 WAR), Gattis (1.8 WAR), Gyrko (1.8 WAR) are also good choices. It’s tough to pick rookies because you have to balance overall value and rate stats. Probably Puig, but Pollack would be a good choice too. For the AL position player it’s slim pickens, to this point it’s probably Jose Iglesias (1.6 WAR), but Nick Franklin, Gomes, and Martin have a case and they all have Wil Myers charging. AL pitching is thin, but it’s probably Straily if you want a starter, but there are a lot of good relievers too. Many the AL rookie class is weak. The NL pitchers are much more fun. Miller, Fernandez, Ryu, and Teheran. I love Shelby Miller, but Fernandez right there.
How Was The Game? (July 12, 2013)
Solid all-around.
Tigers 7, Rangers 2
The Tigers jumped on Justin Grimm before he knew what hit him. The first six Tigers reached base in the first inning and they scored 5 runs before Grimm could make 3 outs. They’d add two more in the second for good measure and it would be all Doug Fister (7-5, 121 IP, 4.02 ERA, 3.37 FIP, 2.6 WAR) would need as he turned in a solid 6 innings of 2 run baseball with 5 strikeouts and just 2 walks. The first six batters in the Tigers order all reached base at least twice each and the game was never really in doubt. We got to see a great slide from Torii Hunter, an infield single from Prince, a dominant four out performance from Rondon, and the Tigers added one to the win column. They’ll give themselves a shot to win the series tomorrow in Max Scherzer’s (13-0, 123.2 IP, 3.06 ERA, 2.62 FIP, 4.0 WAR) final start before the All-Star break.
The Moment: The Tigers get five runs in the first inning to put it away early.
Miguel Cabrera Can’t Stop

We’re beyond the point where I need to tell you that Miguel Cabrera is having an amazing season. He’s leading MLB in Wins Above Replacement (what is WAR?), wRC+ (what is wRC+), wOBA (what is wOBA?), batting average, on base percentage, and is 2nd in slugging percentage and is closing fast. At his current pace, he would finish with the 24th best offensive season in MLB history and somewhere around the 25th best season in history by WAR despite having negative defensive ratings.
He’s one of the best players of his generation and this is his peak. We’re all clear on this, it’s pretty much established. He’s having the best season of his career and it’s really not even close. His previous career high in wRC+ was 2011 when it was 177. This year it is 205. That’s quite a bit better, and that’s before we consider that he’s 0.8 WAR from his career high despite the fact that I’m writing this on July 12. Put this way, if Miguel Cabrera played like a fringe starter the rest of the season, this would still be his best season.
As I often do, because I’m a junkie, I was digging around in Miguel Cabrera’s splits for this season to find something interesting to write about and there was just nothing there. He’s always good. You can’t put Cabrera into a situation in which he won’t excel.
I’ve been writing tweets about Cabrera all season long pointing out his pace in the context of his own past, Tigers history, and MLB history and I keep adding the disclaimer, “He can’t keep this up.”
But here we are, and he’s still keeping it up. I wrote the other day that players will usually regress to the mean, but Cabrera’s averages were so high that while his current level is Everest high, it’s not so much higher than his past performance that this is something that couldn’t possibly continue. This could be his career year. And what a year it is.
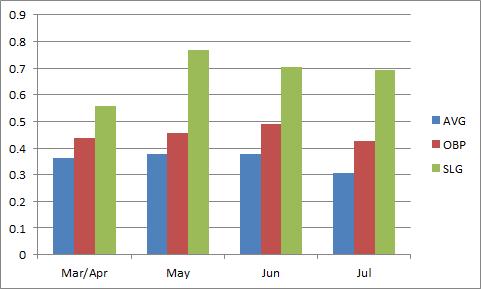 He’s been doing it so consistently all season long. In his worst month he slugged over .500. In his worst month his OBP is over .400. If you like wRC+ as an overall offensive metric, it’s the same story. Cabrera’s worst month this season was 171 wRC+ which is pretty much his best season prior:
 He’s probably not going to have a 225 wRC+ season, but it’s not like his bad months are anything at which to sneeze. We’re talking about a guy having an all-time offensive season and there are simply no signs that it isn’t sustainable. His BABIP (what’s BABIP?) is high, but it’s always been high and he’s already had a season in which he finished with this exact BABIP, .379. He has 30 homeruns before the All-Star break.
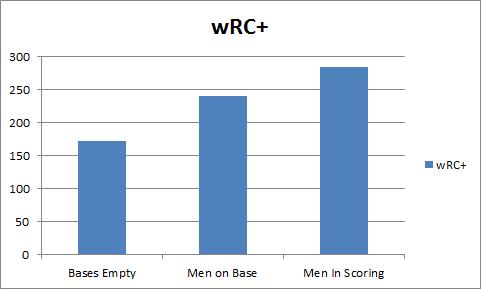
He’s doing it in every situation:
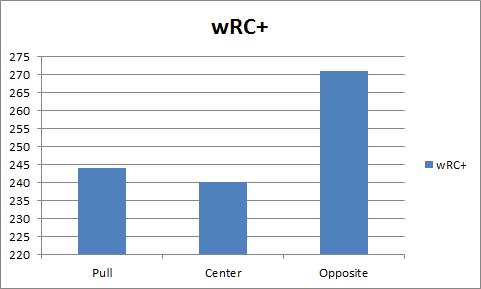
 And he’s doing it to all fields:
 He’s doing it at home and on the road:
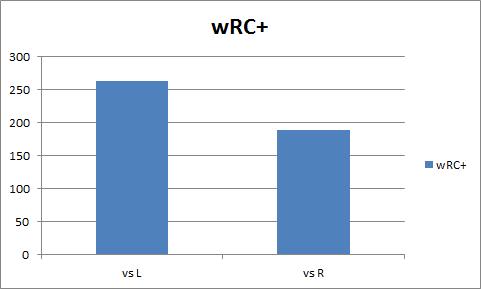
 And against righties and lefties:
 Miguel Cabrera is pretty much good to the point where it’s hardly interesting. Earlier in the season, I looked at how you might try to get him out and the results weren’t good for AL pitchers. Cabrera is having his best season and there are no holes in his offensive game. He’s on pace for an all-time great season and he’s not slowing down.
The Morning Edition (July 12, 2013)
From Last Night:
- Salazar impresses and helps beat the Jays in his debut with the Indians
- Reds lose to the Braves with Votto waiting on deck…again
- Kendrick squeaks past Zimmermann and the Nationals
- Both starters stumble, Red Sox beat the Mariners in 10
- Jeter returns to the Yanks, national media doesn’t spend much time talking about it
- Moore K’s 10 in 7.1 innings as he’s named to the ASG
- Tulo’s back!
What I’m Watching Today:
- Cosart makes his MLB debut against Price (7p Eastern)
- Strasburg heads to Miami (7p Eastern)
- Corbin goes against the Crew (930p Eastern)
- Kershaw welcomes the Rockies to LA (10p Eastern)
The Big Question:
- Does the media see the irony?
So recently there have been a number of things written about MLB’s problem getting good national TV ratings and some people have suggested more playoff teams and other stuff I don’t think will be a good idea, but today was the perfect example of how the media is responsible for the problem. Two shortstops came back from injuries today to help their clubs who are on the edge of the postseason race. 99% of the coverage was about Jeter and almost none was about Tulowitzki, who is one of the most dynamic players in the game. I don’t have anything against Jeter, and he’s had a wonderful career, but if you’re wondering why national ratings are down, it’s because the national media recycles the same tired stories about the same 3 or 4 teams. It’s time for Fox, ESPN, and MLB to plug players on smaller market clubs. Tulowitzki could easily be the face of MLB, but you don’t see many Rockies games on national TV.
How Was The Game? (July 11, 2013)
Wild.
White Sox 6, Tigers 3
This game was quite something. The particulars are that the Tigers gave up an early run, came back with two homers to take a 3-1 lead, then allowed a grand slam and solo homerun to give back the lead. Anibal Sanchez (7-6, 92 IP, 2.93 ERA, 2.31 FIP, 3.3 WAR) in sum, was a bit uneven allowing 5 runs (4 earned) across 5.1 innings, but he did strikeout six. However, the story of this game was a bit more than the above information, which could easily be gleaned from the box score. Let’s take a look:
- Immediately following Cabrera’s homerun, Chris Sale threw a pitch up and in to Prince Fielder.
- Prince was upset, but not confrontational. Leyland yelled at the umpire from his seat in the dugout.
- No warnings were issued.
- After Sanchez gave up some runs in the 6th, Putkonen came in and threw behind Ramirez, the second batter he faced.
- Ramirez started coming to the mound, pointing and yelling.
- Putkonen was ejected.
- The benches cleared.
- Leyland was ejected.
- Everyone went back to their benches.
- Leyland kept arguing.
- The benches were warned.
- Leyland finally realized he was ejected.
- The fans booed Ramirez during the rest of the at bat.
- Ramirez hurt himself running to first base.
So while the 14 lines above can nicely summarize it for anyone who missed it, it’s also important to evaluate the situation. I think Sale’s pitch was intentional and I don’t advocate throwing at anyone or fighting in baseball. However, the umpires have a responsibility to warn the benches to prevent further issues. Also, Putkonen did a nice job making sure the pitch was behind Ramirez and down near his backside, assuring there would be no injury. If the umpires want to effectively police this stuff, which they should, you have to issue warnings earlier and you can’t eject someone for throwing behind a guy when you haven’t issued warnings. Basically, Sale shouldn’t have done that, the umpires handled it like idiots, Putkonen did a nice job not to make his pitch dangerous, and the players on both sides did a nice job by not resulting to punches and whatnot. All in all, the Tigers lost 2 of 3 to the Sox, but Chris Sale is a legitimate ace, so you can’t be too upset about this one. They’ll have 15 more chances to beat the Sox, but they’ll turn their attention to the Rangers, who will see Doug Fister (6-5, 115 IP, 4.07 ERA, 3.30 FIP, 2.6 WAR) Friday at Comerica Park.
The Moment: Jim Leyland gets his money’s worth arguing the umpire’s terrible game management.
Victor Martinez Returns Despite Never Leaving
Victor Martinez’s early season statistics weren’t good. Most were pretty bad. He wasn’t getting on base, he wasn’t hitting for power, and because he plays a position that doesn’t utilize a glove, he wasn’t adding value on defense in the way Andy Dirks has done during his own offensive struggles.
But seemingly all of a sudden, Martinez is crushing the baseball. In the last 30 days, Martinez has a very respectable 112 wRC+ (what’s wRC+?). In the last 14 days he has a 170 wRC+. In the last 7 days, it’s 209. That is what the average person would describe as a trend, or perhaps a hot streak. Regardless of the cause or the sustainability of this performance, anyone can look at his numbers and recognize that Martinez’s performance is getting better.
I wrote earlier this year that Victor Martinez was having a particularly extreme case of terrible luck on hard hit balls. He was among the top handful of players in the game at making hard contact, but his batting average and power numbers didn’t reflect that. In fact, he was the only one near the top of the list who wasn’t hitting well above league average.
It made no logical sense that Martinez would make so much hard contact and not reap the rewards. It wasn’t really happening to any other hitter and it doesn’t really happen all that often in general. Hard contact is very highly correlated, and likely the cause of success in the batter’s box. But it wasn’t happening for Martinez?
Why?
The answer is actually so simple that it’s hard to grasp. Nothing was happening. Victor Martinez was doing nothing wrong. He wasn’t chasing bad pitches, he wasn’t hitting a dramatic number of popups or anything. Victor Martinez was the victim, if you can call it that, of something we statisticians call random variation.
Think of it this way. If a player’s true talent level is a .300 batting average, that means that over the course of the season, he’ll get 3 hits for every 10 at bats. But it doesn’t mean that he’ll get 3 hits in EVERY 10 at bats (that would mean performance uniformly distributed). Sometimes he’ll get 2, sometimes he’ll get 4. Sometimes he’ll get 8 and sometimes he’ll go 0 for 15.
Statistics are excellent and wonderful and we love to use them to measure things, but they have to be used properly. You have to understand what they mean. When Martinez was hitting .210, it meant to date he had gotten about 2 hits in every 10, but it didn’t mean that was his true talent level. He’s a .300 hitter in his career, this window was just a low point. A period of “bad luck” if you want to call it that.
Random variation means, in a simple sense and nontechnical sense, that the smaller a sample you look at the higher the likelihood is that you’re observing something that doesn’t reflect reality. Miguel Cabrera gets a hit around 33% of the time in his career, but if you look at any 3 at bats, you’re likely to see him have 0, 2, or 3 hits. That’s how sample size works.
This relates to Martinez because the underlying information about Martinez went unchanged during the slump. He wasn’t chasing pitches and he was making hard contact. The walk and strikeout rate looked fine. Good swings were turning into outs way more frequently than they usually do for him or for anyone.
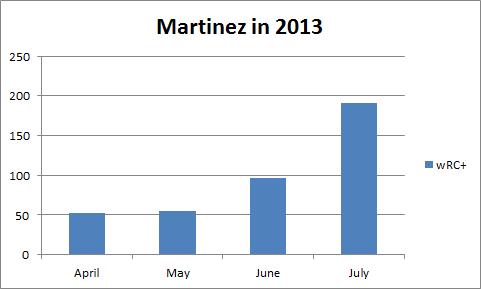
And then all of a sudden it stopped. Somewhere in the last four to five weeks, Martinez just started getting those swings to turn into hits and he’s climbed all the way up to a .254/.311/.367 line after a .221/.290/.274 line in April. He’s not a different player, he’s just getting his hits to drop now and he wasn’t then. He’s taken two and half months of bad stats and is slowly erasing them.
His numbers were awful. Now they are amazing. Only two things can be responsible for that. One is a change in skill, health, or approach – none of which are evident. The other is a change in fortune – which appears likely. Victor Martinez is the poster child for a concept called “regression to the mean.”
Regression to the mean is an idea that suggests, in baseball, that when a player does something much better or worse than his previous career average it’s likely that he’s going to regress toward the previous average more often than he moves further into the extremes. You can think of regression to the mean as the correction in random variation over large samples.
In a small sample, anything can happen, but if you give something enough time, it will show its true colors. I’m boiling down a complex statistical concept, so well-versed statisticians shouldn’t analyze the wording too literally, but the amazing tear Martinez is on is essentially like the universe balancing out the really unlucky stretch he had.
It really is that simple. Take a look at his monthly performance:
It’s getting much better, sure. But there is something in the batted ball data I want you to see. This is a bit cluttered, but take a look.
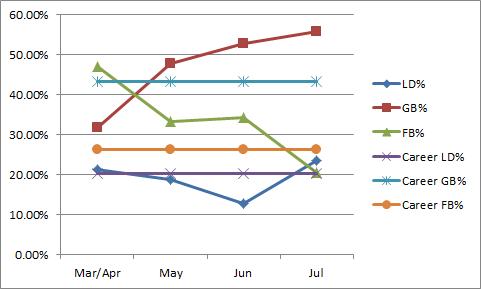
He was hitting fewer groundballs than normal in April, and now he is hitting more to compensate. He was hitting fewer than normal line drives for the first three months, now his is hitting more. He was hitting way more flyballs that normal to start the year, now he’s hitting fewer. Everything is correcting itself. It’s not that he is now hitting like the career averages he set for himself, it’s that he’s now playing at the other extreme to balance out what happened before. The process for Martinez was good, but the results we all out of whack. Now the process is the same and the results are good.
This is a simple case of regression to the mean. There wasn’t anything wrong with Martinez that time couldn’t fix. The Tigers did just fine while he was “struggling” and now they’re getting the hot-hitting version of him as the race gets going.
In general, this should be a lesson to you that surface statistics can be deceiving. If you thought Martinez was a good hitter entering the season, you shouldn’t change your opinion so quickly when he has a low batting average for six or eight weeks. Almost always, unless a player is hurt (he never looked hurt), he will regress to the mean. He may not ever have the season he had in 2011, as that was likely his career year as a hitter, but he will look very much the player you expected. He’s been a 120 or so wRC+ hitter for most of his career and there is no reason not to expect something around 110 now that he is entering the downswing of his career.
Enjoy Victor’s hitting streak and power explosion now because you certainly earned it while he wasn’t getting hits. It’s often hard to take a step back and see the world with a wide angle lens, but it’s something we should do a lot more often.
