The Nine Worst 20 Win Season in MLB History

To regular readers it will come as no surprise that I’m part of the movement to remove the pitcher won/loss record from our baseball evaluations. I’ve written on the subject quite a bit, both with respect to individual seasons and entire careers, and this piece seems like a perfect fit to round out the discussion. It also helps that I got a direct request for this exact thing after I posted yesterday’s piece:
So what follows are The Nine Worst 20 Win Seasons in MLB history. It gets a little tricky to draw lines here, so let me give you a quick primer. I don’t want this post to be about pitchers who made a lot of starts so they got a lot of wins, but rather about pitchers who performed poorly and still got wins. Therefore, instead of using Wins Above Replacement as I did for the under 9 list, I will be using ERA- and FIP-, which are simply statistics that calculate the difference between a pitcher’s ERA or FIP and league average during that year. Also it controls for park effects, but it’s basically a way to compare an ERA from the deadball era to one from the steroid era.
I would personally prefer to see this done with FIP-, because it better reflects a pitcher’s skill, but I’m going to use ERA- as well so that this piece is more convincing. A pitcher who allows a lot of runs shouldn’t win a lot of games, and you should agree with that if you’re old school or new school.
Additionally, I’ve included lists from 1901-2012 and just 1945-2012 if you’re concerned about the number of starts inflating someone’s win total. That’s fair, so I’ve broken it down into four separate lists, all telling you the same thing. You can have a bad year and win 20 games. 20 games is the old school gold standard of performance, so this cutoff makes sense. If you’ll recall, there have been more than 8,000 qualifying seasons in MLB history and if you try to predict WAR, ERA, or FIP with wins, you get an adjusted R squared of less than .40 in all cases. This isn’t just about a few examples, it’s about the entire population of starting pitchers. For more on this, read the two links above and check out the bottom of this piece.
Here we go.
1945-2012 by ERA-
| Rank | Season | Name | Team | W | L | IP | ERA- |
| 9 | 1950 | Johnny Sain | Braves | 20 | 13 | 278.1 | 100 |
| 8 | 1965 | Sammy Ellis | Reds | 22 | 10 | 263.2 | 101 |
| 7 | 1973 | Paul Splittorff | Royals | 20 | 11 | 262 | 102 |
| 6 | 1971 | Steve Carlton | Cardinals | 20 | 9 | 273.1 | 103 |
| 5 | 1970 | Jim Merritt | Reds | 20 | 12 | 234 | 104 |
| 4 | 1980 | Joe Niekro | Astros | 20 | 12 | 256 | 106 |
| 3 | 1972 | Stan Bahnsen | White Sox | 21 | 16 | 252.1 | 113 |
| 2 | 1959 | Lew Burdette | Braves | 21 | 15 | 289.2 | 113 |
| 1 | 1966 | Denny McLain | Tigers | 20 | 14 | 264.1 | 113 |
1945-2012 by FIP-
| Rank | Season | Name | Team | W | L | IP | FIP- |
| 9 | 1971 | Dave McNally | Orioles | 21 | 5 | 224.1 | 110 |
| 8 | 1967 | Mike McCormick | Giants | 22 | 10 | 262.1 | 110 |
| 7 | 1959 | Lew Burdette | Braves | 21 | 15 | 289.2 | 111 |
| 6 | 1990 | Bob Welch | Athletics | 27 | 6 | 238 | 112 |
| 5 | 1958 | Bob Turley | Yankees | 21 | 7 | 245.1 | 112 |
| 4 | 1979 | Joe Niekro | Astros | 21 | 11 | 263.2 | 114 |
| 3 | 1967 | Earl Wilson | Tigers | 22 | 11 | 264 | 114 |
| 2 | 1973 | Catfish Hunter | Athletics | 21 | 5 | 256.1 | 122 |
| 1 | 1966 | Denny McLain | Tigers | 20 | 14 | 264.1 | 123 |
1901-2012 by ERA-
| Rank | Season | Name | Team | W | L | IP | ERA- |
| 9 | 1910 | George Mullin | Tigers | 21 | 12 | 289 | 109 |
| 8 | 1914 | Christy Mathewson | Giants | 24 | 13 | 312 | 110 |
| 7 | 1911 | Jack Coombs | Athletics | 28 | 12 | 336.2 | 110 |
| 6 | 1906 | Christy Mathewson | Giants | 22 | 12 | 266.2 | 112 |
| 5 | 1972 | Stan Bahnsen | White Sox | 21 | 16 | 252.1 | 113 |
| 4 | 1919 | Hooks Dauss | Tigers | 21 | 9 | 256.1 | 113 |
| 3 | 1959 | Lew Burdette | Braves | 21 | 15 | 289.2 | 113 |
| 2 | 1966 | Denny McLain | Tigers | 20 | 14 | 264.1 | 113 |
| 1 | 1903 | Henry Schmidt | Superbas | 22 | 13 | 301 | 118 |
1901-2012 by FIP-
| Rank | Season | Name | Team | W | L | IP | FIP- |
| 9 | 1911 | Bob Harmon | Cardinals | 23 | 16 | 348 | 114 |
| 8 | 1921 | Joe Oeschger | Braves | 20 | 14 | 299 | 114 |
| 7 | 1967 | Earl Wilson | Tigers | 22 | 11 | 264 | 114 |
| 6 | 1903 | Henry Schmidt | Superbas | 22 | 13 | 301 | 114 |
| 5 | 1906 | Jack Taylor | – – – | 20 | 12 | 302.1 | 115 |
| 4 | 1910 | George Mullin | Tigers | 21 | 12 | 289 | 117 |
| 3 | 1908 | Nick Maddox | Pirates | 23 | 8 | 260.2 | 121 |
| 2 | 1973 | Catfish Hunter | Athletics | 21 | 5 | 256.1 | 122 |
| 1 | 1966 | Denny McLain | Tigers | 20 | 14 | 264.1 | 123 |
And now, to bring the point home even further, let’s put an innings cap at 210 and take a look at 15+ win seasons since 1945 by ERA-
| Rank | Season | Name | Team | W | L | GS | IP | ERA | FIP | WAR | FIP- | ERA- |
| 9 | 2003 | Ramon Ortiz | Angels | 16 | 13 | 32 | 180 | 5.2 | 5.26 | 0.9 | 119 | 117 |
| 8 | 1983 | Eric Show | Padres | 15 | 12 | 33 | 200.2 | 4.17 | 4.37 | 0.3 | 121 | 118 |
| 7 | 1989 | Storm Davis | Athletics | 19 | 7 | 31 | 169.1 | 4.36 | 4.4 | 0.5 | 123 | 119 |
| 6 | 2004 | Shawn Estes | Rockies | 15 | 8 | 34 | 202 | 5.84 | 5.54 | 1 | 112 | 120 |
| 5 | 1966 | Dave Giusti | Astros | 15 | 14 | 33 | 210 | 4.2 | 3.57 | 2.6 | 105 | 120 |
| 4 | 1999 | Kirk Rueter | Giants | 15 | 10 | 33 | 184.2 | 5.41 | 5.01 | 1.1 | 113 | 124 |
| 3 | 1989 | Andy Hawkins | Yankees | 15 | 15 | 34 | 208.1 | 4.8 | 4.44 | 1.2 | 117 | 124 |
| 2 | 1969 | Steve Blass | Pirates | 16 | 10 | 32 | 210 | 4.46 | 3.72 | 2 | 109 | 126 |
| 1 | 1980 | Dan Spillner | Indians | 16 | 11 | 30 | 194.1 | 5.28 | 4.45 | 1.4 | 110 | 130 |
And now again with FIP-
| Rank | Season | Name | Team | W | L | G | GS | IP | ERA | FIP | WAR | ERA- | FIP- |
| 9 | 2012 | Barry Zito | Giants | 15 | 8 | 32 | 32 | 184.1 | 4.15 | 4.49 | 0.9 | 110 | 120 |
| 8 | 1983 | Eric Show | Padres | 15 | 12 | 35 | 33 | 200.2 | 4.17 | 4.37 | 0.3 | 118 | 121 |
| 7 | 1984 | Eric Show | Padres | 15 | 9 | 32 | 32 | 206.2 | 3.4 | 4.23 | 0.7 | 97 | 122 |
| 6 | 1963 | Phil Regan | Tigers | 15 | 9 | 38 | 27 | 189 | 3.86 | 4.58 | 0 | 104 | 123 |
| 5 | 1989 | Storm Davis | Athletics | 19 | 7 | 31 | 31 | 169.1 | 4.36 | 4.4 | 0.5 | 119 | 123 |
| 4 | 1975 | Jack Billingham | Reds | 15 | 10 | 33 | 32 | 208 | 4.11 | 4.43 | 0.4 | 114 | 124 |
| 3 | 2006 | Steve Trachsel | Mets | 15 | 8 | 30 | 30 | 164.2 | 4.97 | 5.5 | 0.1 | 114 | 125 |
| 2 | 1971 | Chuck Dobson | Athletics | 15 | 5 | 30 | 30 | 189 | 3.81 | 4.19 | 0.1 | 117 | 126 |
| 1 | 1950 | Tommy Byrne | Yankees | 15 | 9 | 31 | 31 | 203.1 | 4.74 | 5.51 | 0.5 | 107 | 128 |
Even when we limit the number of innings a pitcher throws, pitchers can still accumulate wins despite pitching much worse than league average.
So whether you like the simple and easy ERA or the more predictive and true FIP, here you have plenty of evidence that winning a lot of games doesn’t mean you had a good season. Guys on this list were 10 and 20% worse than league average in these seasons and still won the magic 20 games. This is further proof that wins do not reflect a pitcher’s individual performance.
You can be worse than average and still win at an elite level. Last week I showed how you can be much better than average and win fewer than 10 games. Yesterday, I showed that this isn’t a small sample size, single season trick. This is true in small samples and in large samples.
Here’s a quick look at every individual season in MLB history again up against ERA-. There is a trend, but the variation is huge. The adjusted R squared is .3046, meaning wins can only explain 30% of the variation in ERA relative to league average.

FIP- actually makes wins fare worse, at .1709 adjusted R squared. I won’t bother showing the graph because this one makes the point just fine. You can have an all time great season at run prevention and win 10 games and you can have a well below average season and win 20. Wins are about many factors and pitching is just one of them. You can have a great outing, great season, and great career and never get the wins you deserve and the exact opposite is true as well.
It’s time to outgrow the win and start talking about things that actually measure performance. Even if it’s ERA, which isn’t even the best way to do things. Let’s look at innings and strikeouts and FIP and WAR and everything else. Wins are the oldest statistic there is but they’ve long since lost their usefulness.
If you’re someone who believes heavily in wins, I challenge you to write a cogent response that defends their use. I’d be happy to publish it if you don’t have your own forum and will respond to your arguments. I want to be someone who helps move sabermetrics from a niche tool to the mainstream and I don’t want this to be about drawing lines between people who love baseball. This is my argument against wins, I hope that you take it to heart and really think about it.
Ask questions, look for evidence, and let’s talk about baseball. Share this with people who love wins and hate them. This shouldn’t be a partisan debate between the new and old, it should be about knowledge and fun. Always.
What About Pitcher Wins With A Long Lens?
This season, the debate between those who like using wins to judge pitchers and those who want nothing more than to forget that statistic exists has heated up and we’ve seen the movement heavily publicized by MLB Network’s Brian Kenny, who takes on “wins” on a daily basis.
The argument against using wins is simple. The way pitcher wins are determined does not reflect individual pitcher performance, and therefore is an improper judge of how well someone performed. There are countless examples, most clearly Cliff Lee last season and James Shields and Chris Sale this season. Last week, we took on some of the best seasons ever by pitchers who won 9 or fewer times in a season. So much of what leads to wins is completely out of the pitcher’s control and they shouldn’t be judged based on how many runs their team scored for them. Run support, even if we strip away defense, the opposing pitcher, and dumb luck, is a clear and important factor in how many wins you have.
Last week, I gave you this graph which showed that in the 8,000+ qualifying seasons since 1901, wins did very little to explain overall performance:

But those numbers just reflect single seasons. I started wondering about bigger samples. Pitchers can get really lucky or unlucky in a given start and clearly they can in given seasons, but what about in their careers? Can you fake your way through an entire career of wins? It turns out that you can. Let’s take a look.
Below is a graph of Wins per Start (so as to control for guys who made 400 starts and guys who make 250 starts) and ERA- (which is simply ERA scaled to league average during that era and adjusted for park effects. Lower ERA- is better and 100 is league average, meaing ERA- of 90 is 10% better than average). What you see here is that wins fare no better in career samples than season ones (sample size of 2,155):
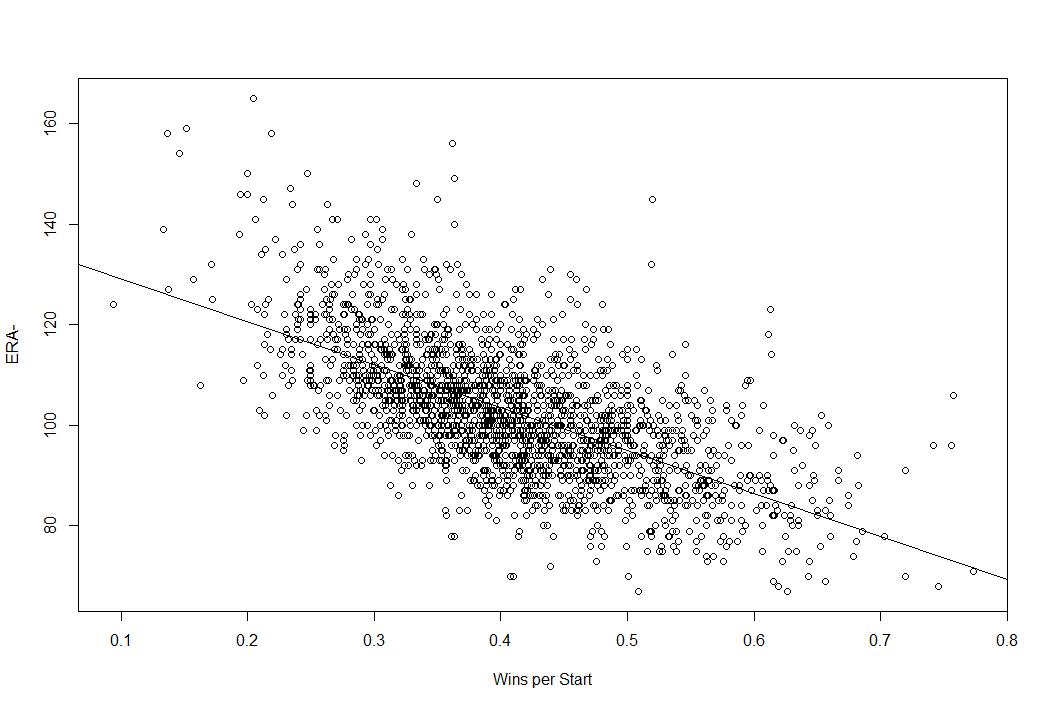
The trend line is clear in that the lower your ERA-, the more frequently you win, but there is significant variation at each point. For example, at a wins per start of 40%, some pitchers have ERA- of 80 and some have ERA- of 120. The adjusted R squared here is .3966, which means that only 40% of the variation in ERA- can be explained by Wins per Start. That’s less than half.
If we used FIP-, which is the scaled version of Fielding Independent Pitching (FIP), the results are even more troubling for wins.

The adjusted R squared here is only .2131, meaning that only about 21% of the variation in FIP- can be explained by Wins per Start. You can win 50% of your starts as the best pitcher of all time or as one of the worst.
The takeaway here is very simple and very important. Your ability as a pitcher to keep the other team from scoring (as seen with ERA-) and your ability to prevent runs based on only that which you can control (FIP-) are not that heavily correlated with winning. You can’t use a pitcher’s wins to predict how good they are because you can win if you prevent runs like a superstar or if you prevent runs like a Triple A long reliever. Even if you strip out defense and the quality of the other offense and give the pitcher credit for every single run he allows, there is still the issue of team run support that he has zero control over.
Last week I provided simple, straightforward evidence for why wins don’t reflect performance over the course of the season, but here I’ve shown that wins don’t even tell you much over the course of an entire career. It’s the job of a starting pitcher to limit the runs they allow, but the ability to limit runs doesn’t correlate very well with how often you win because so much of that is out of your hands.
Wins are not a good measure of individual performance and we should stop using them as such. This isn’t because sabermetricians don’t understand the point of the game, which is to win, but rather because we understand that “wins” as a stat for pitchers tells us nothing about how much they contributed to helping their team win. Pitchers try to prevent runs. That is only half of the game. They shouldn’t be praised or blamed for what happens on the other side.
Appointment Television: Baseball’s Must Watch Starting Pitchers (July 2013 Update)
In May, I rolled out our list of Appointment Television starting pitchers, or pitchers who were worth planning your baseball viewing (and life) schedule around. Today, as I did in June, I’d like to update that list and talk about the changes. The original list can be found here, which also includes a little more detail on the origin of the project. Recall that the order is tiered into stable and non stable (italics), but each ranking is meaningless.
Here is the gist from the original:
The methodology is simple but also subjective. To be classified as Appointment TV you have to have a high likelihood of pitching a gem. There is no set definition of gem or likelihood, but the idea is that to make this list, you have to be likely enough to throw a game worth clearing your schedule for. I think a number of pitchers qualify. Most are high strikeout guys, but that isn’t a requirement. If you are good enough to dominate on a semi-regular basis you’re in. If on your day to pitch, I make sure I’m aware of the start time so that I can check in, you’re Appointment TV.
This is a rolling list and pitchers will be added and subtracted throughout the season and it will be updated as necessary. There is no order other than that pitchers lower on the list in italics are recent additions, so if you’re wondering if Jordan Zimmermann really qualifies, know that he’s earned his way onto the list in his last few starts. Remember, this is a list of pitchers who on this date are can’t miss TV. These are not necessarily the best pitchers and plenty of good pitchers aren’t on the list.
Appointment Television Starting Pitchers:
- Justin Verlander
- Adam Wainwright
- Clayton Kershaw
- Felix Hernandez
- Yu Darvish
- Matt Harvey
- Cliff Lee
- Max Scherzer
- Jordan Zimmermann
- Anibal Sanchez (coming of the DL July 6th)
- Stephen Strasburg
- Chris Sale
- Doug Fister
- Jose Fernandez
- Shelby Miller
- Mat Latos
- Derek Holland
Clay Buchholz(On the DL, no return set)
Let’s get the minor changes out of the way first. Stephen Strasburg is back on the list because he’s off the DL and I’ve decided to let Anibal Sanchez slide because he is schedule to come off the DL when his turn comes up in the rotation this weekend. Clay Buchholz gets the DL treatment, so he’s off the list for the time being because you can’t watch a guy who doesn’t pitch.
Doug Fister moves from the borderline italics section to the permanent list because he’s really good and Chris Sale gets a first even jump for not listed to regular type with his fantastic month of June. Jon Lester has really stumbled since his strong April so he’s off the list until he gets himself back on track, and Matt Moore, whom I really wanted to be great this year, is walking too many batters to be considered must watch. The strikeouts and run prevention is good, but if he doesn’t get his control in line he’ll regress a good deal.
Finally, the list gets three new names in the italics section. Mat Latos and Derek Holland have pitched too well to ignore even if I haven’t personally enjoyed their starts as much as their teams have. Both guys are on notice as I haven’t really fallen in love with their outings, but they’ve earned mention. Finally, Jose Fernandez has been lights out this season and after last night’s gem, he’s earned your attention. The Marlins have two players worth watching! I’m crossing my fingers for Jacob Turner.
Feel free to make a case for other starting pitchers who are must watch guys and we’ll consider adding them to the list.
Darin Downs, Very Capable Reliever

A great deal has been said and written about the Tigers and their bullpen struggles. I’ve taken part, offering criticism of signing Valverde, discussing why closers don’t matter, and explaining how I would use a bullpen. And I think we’re probably all on board with the idea that Smyly and Benoit are the Tigers best relief pitchers, even if we don’t agree on how a team should use their best relievers.
Yet in all the madness, we’ve overlooked a very good reliever in the Tigers bullpen, likely because Jim Leyland doesn’t use him very much. I said this on June 15th when Downs came on to pitch:
Some of that comes from the Tigers having an incredible rotation and not needing much relief help, but the idea that Leyland didn’t use Downs for nearly two weeks when he was running Valverde out six times is a bit of an issue. Why? Because Darin Downs has actually pitched really, really well.
In 19 games, Downs has 25.1 IP and sports a 11.09 K/9, 2.49 BB.9, and 1.07 HR/9 rate which equates to a 3.22 FIP and 3.23 xFIP along with his 3.91 ERA and 0.4 WAR. Two things jump out about that line. First, his K and BB rates are very good (29.3% and 6.6% if you prefer) but also that his performance looks entirely sustainable in the sense that his peripherals are in line with his results. He’s faced only 106 batters, so maybe this is just the best stretch of his career, but if it is, the Tigers should at least be riding the streak.
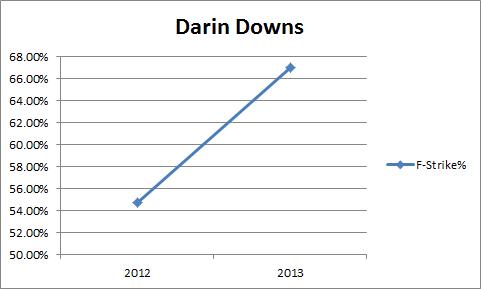
Last year, he was good also, if not quite this good (3.48 ERA, 3.24 FIP, 3.82 xFIP in 20.2 IP). So this isn’t totally out of nowhere. He leads all Tigers pitchers in O-Swing% (getting hitters to swing at pitchers out of the zone) at 37.9% and only Alburquerque has allowed less contact. Only Evan Reed has thrown more first pitch strikes.
I’m fully aware that I’m walking on small sample size thin ice, but I’m going to press on because I think this gets interesting if you’re willing to stay with me.
Here are his K/9 and BB/9 over the last two seasons (K% and BB% look the same):

And he’s inducing more swings on pitchers outside the zone and fewer inside the zone:
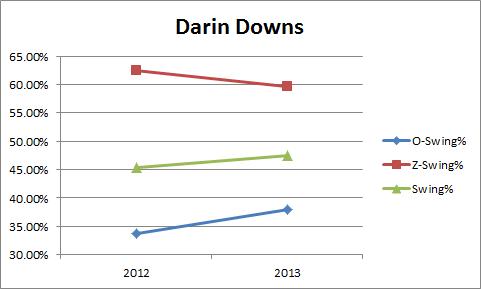
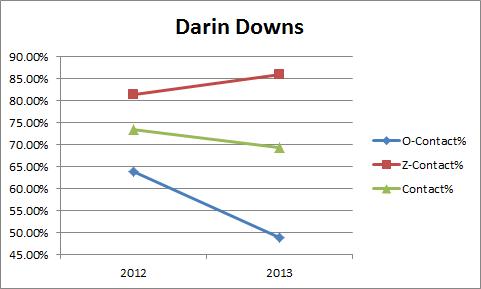
Downs is getting hitters to chase more outside the zone and take more inside the zone, which goes nicely with the fact that hitters are making less contact outside the zone and more inside the zone this year:
And in a very boring visual, he’s also throwing more first pitch strikes than last year:
So if we’re willing to accept our hands are tied with small samples any time we analyze relievers, Downs looks good. He’s improved from last year to this year and his numbers are quite good this season. If we’re going to look at statistics for relievers at all, the statistics tell a good story regarding Downs. He’s good and he’s getting better.
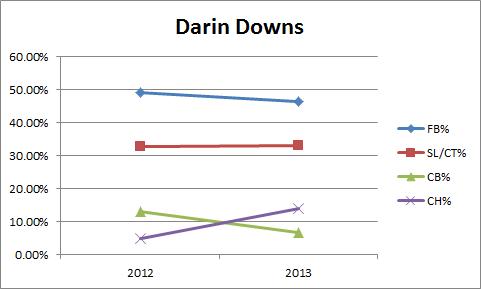
So what’s different? It could be simple variation, but there is something else I want to highlight. It’s not just the results that are better, the pitches are better too. Let’s start with his pitches from 2012:

And here is Downs this season:

Notice how the changeup and fastball is moving more this season and notice how there is more separation between the fastball and the changeup. His pitchers are moving more and the separation has gotten a bit better. That’s generally a good formula for success. And I think Downs has figured it out. Here’s how he’s mixing his pitches:
He’s going to the changeup instead of the curveball more often, just like so many Tigers pitchers, and it’s becoming a better pitch for him. He’s throwing the changeup more and he’s getting more swings and misses on it, and also with the curveball, possibly because hitters now have to worry about a good changeup and can’t read the offspeed pitch as well:

And no, Darin Downs does not have a platoon split this season. In fact, he’s both faced more righties (58 vs 48) and done better work against them this season. Hey, aren’t changeups used to get opposite handed hitters out?!

So the story with Downs is this. He’s having a good season and by all accounts he has gotten better since last season, and that improvement is based on some actual differences in his pitches and pitch usage. When we dive into reliever stats, we can often get lost in small samples, but if we’re going to evaluate relievers, and clearly we are, everything is going in the right direction for Downs.
It’s about time he gets the recognition he deserves and maybe even some high leverage appearances.
The 2013 Tigers Are The Best Rotation…Ever (So Far)
Regular readers will not be surprised to hear me say the Tigers rotation is exceptional and many of you have probably seen Dave Cameron’s take from a few weeks ago on the same subject. His point, which is the one I’ll pick up here, is that when we adjust Fielding Independent Pitching (FIP) for ballpark effects and league average, the Tigers have the best rotation ever, no hyperbole added.
Those adjustments will look like this: League average FIP- is 100 and every point above or below average is a percent better. Pitchers want the lowest FIP- possible.
The current record for FIP- belongs to the 1971 White Sox at 77 with a handful of other clubs packing around 77-79. The 2013 Tigers are setting the pace, however, at 64. Consider what that means. The best rotation of all time was 23% better than league average. The Tigers rotation is 36% better than league average.
Certainly, the season isn’t even half over and there is time for the Tigers to cough this up, but they have a pretty big cushion. They’re getting contributions from all five starters who all have a FIP below 3.50 and all have xFIPs at 3.20 or below. More amazingly, the strikeout rate is off the charts. We have to acknowledge that this is a high strikeout era, but the Tigers current K/9 from the starting rotation is 9.51. The MLB record is 8.62 from the 2003 Cubs. The Tigers have a K:BB ratio of 4.46. The MLB record is 4.22 from the 2011 Phillies.
The Tigers rotation leads baseball in K/9 by a ton, is 3rd in BB/9, and 2nd in HR/9. They’re essentially dominating hitters in a way that we’ve never seen before. Currently, they’ve accumulated 13.2 WAR, which is 3.3 wins more than the 2nd place Cardinals and they are nearly halfway to the record set by the 1970 Cubs (29.4).
It’s a rotation on an historic pace. If we plot FIP- and ERA- (which is the same principle comparing to league average) it just looks silly. This is every starting rotation in MLB history, including the other 2013 rotations who are already regressing to the mean.

One would except the Tigers to regress toward the line that obvious runs through this plot, but it’s not entirely clear in which direction they will move. FIP and xFIP are more predictive than ERA, so you would expect that they would move left on the graph before they moved up, but that seems equally ridiculous given a subpar defense and the fact that an ERA- that low would also be silly.
I’ve written before about how the Tigers as a team are throwing more changeups and how Scherzer, Porcello, and Sanchez have all made leaps into the upper echelons of MLB starters. This is a truly remarkable rotation that Dave Dombrowski has assembled. Most teams would kill for their worst starter. Their fourth best starter would be the ace on almost every team this season. They have the 4th, 6th, 8th, and 11th best pitchers by WAR this season. They have the 2nd, 7th, 8th, and 12th best starters by FIP and the five Tigers starters are 4th, 6th, 7th, 8th, and 16th best pitchers by xFIP in MLB right now.
If you sort AL starters by xFIP all five Tigers starters are in the top 10. Three of the top four AL starters in K/9 are Tigers. Justin Verlander has the Tigers worst BB/9. Justin Verlander.
This is, perhaps, the most incredible rotation we’ve ever seen. If you look at the individuals starters and how they compare to their peers you certainly have to wonder where the Tigers rank all-time. As it turns out, they rank quite well. By strikeouts, walks, and homeruns allowed, the three categories that build FIP, pitchers have complete control over, and generally predict future performance, the 2013 Tigers are not just the best rotation we’ve ever seen, it’s not really even that close.
With 95 games to play, the Tigers staff is working on a season for the ages.
Anibal Sanchez Masters His Changeup and AL Batters

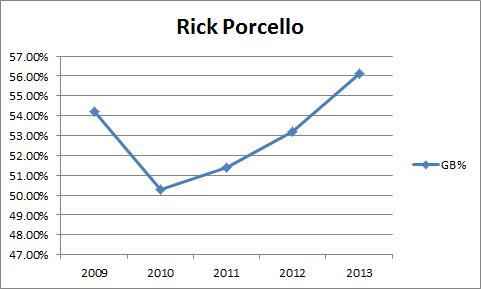
Earlier this season, I wrote about how the Tigers starters were utilizing the changeup more often this season and that it was working to their advantage. Yesterday, I took on Rick Porcello’s rising star and how his use of offspeed pitches were helping him become a bona fide star. Well it’s working for another one of the Tigers pitchers, too.
Anibal Sanchez has been a solid MLB starter for several seasons, so his breakout might be a little less surprising to you, but it’s not less impressive than what Porcello is doing. Here are Sanchez’s strikeouts and walks per 9 since 2009:
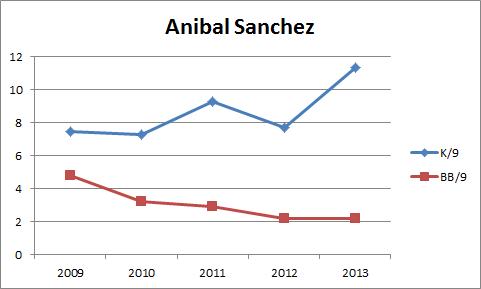
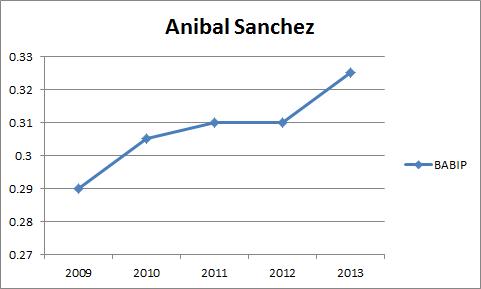
He was always a 7-9 K/9 pitcher and his control has been improving each year. But something happened this year. His strikeouts shot way up and that is directly responsible for his career best ERA, FIP, and xFIP and his on pace to be best career WAR. Here are those rates since 2009:

Any quick look at Sanchez’s numbers will tell you he’s striking out more batters and walking fewer, but the walk rate decline has been happening for years. But the strikeout spike is new and it’s correlated with the huge improvement in run prevention. That alone isn’t enough to tell you anything, but consider this. Sanchez is actually getting hit harder when he gets hit. He’s giving up more hits on balls in play (probably because of his defense, but that counts toward his ERA)
And the batted ball data actually makes him look worse as he is giving up more line drives at the expense of groundballs, which we would usually consider to be harder hit and more likely to result in baserunners:

So let’s review. He’s preventing runs better than ever before with more strikeouts and fewer walks. He’s giving up more hits on balls in play and they are likely coming on harder hit balls because he’s giving up line drives. If anything, he’s been unlucky on balls in play. His HR/FB rate will regress up, but that is accounted for in xFIP so we’ve essentially controlled for that explanation. The only explanation that makes sense for why he’s gotten so much better this season is the strikeouts.
But about those strikeouts. He’s not getting hitters to swing more than they used to. And he’s not getting them to swing at worse pitches. Batters are essentially swinging the same amount as they have the last two seasons against him both in and out of the zone:

So they’re swinging the same, but they are making much less contact:

Let’s revisit how he’s adjusted his pitch selection now to get a sense for what might be causing this:

Basically, the key change in Sanchez’s approach is his increased use of the changeup. If we sum this up, we get this story. Sanchez is preventing runs better this year because he’s getting more strikeouts. He’s getting more strikeouts because he’s getting hitters to swing and miss more often, but not based on the location of the pitch. So it has to be about the pitches themselves. And he’s using the change up more. So it’s probably the changeup, or at least the threat of a better changeup.
In fact, if we track his swing and miss percentage on each pitch over the last five seasons, you can see that while he’s doing well with the fastball and slider this year, it’s the changeup that is really driving this breakout over time. He’s gotten swings and misses on his fastball and slider at this rate before, but the changeup swing and miss rate is at an all time high.
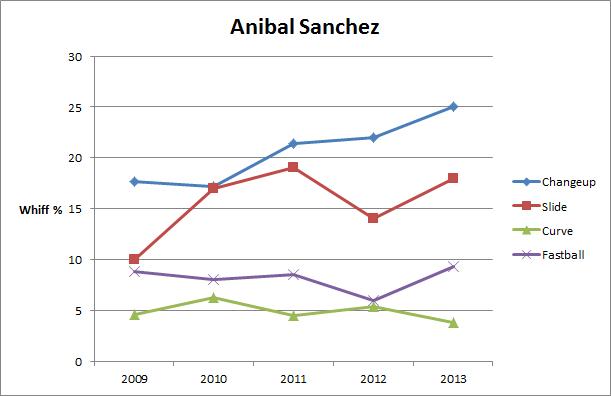
In my other life, I’m a social scientist, so I’m not going to sit here and tell you a better and more effective changeup is the only reason Sanchez is better this year, but the evidence certainly points in that direction. He’s getting better results based on an increase in strikeouts. Those strikeouts are the product of more swings and misses, but batters are swinging at the same rate and they are swinging in the same locations. At this point, it looks like the changeup is drawing the most whiffs, and therefore, more of the credit for the uptick in strikeouts.
Sanchez was great down the stretch for the Tigers in 2012, but some people worried about giving a good but not great starter such a big contract. It doesn’t appear as if those concerns were warranted as Sanchez has turned himself in the AL’s best pitcher by FIP, xFIP, and WAR so far this season thanks to better use of his changeup. This is something all of the Tigers starters seem to be doing, but Sanchez is doing it exceptionally well. I’m not sure if it’s Jeff Jones, Alex Avila, or the starters themselves, but the Tigers are striking batters out at a crazy rate and it’s likely thanks to the changeup.
Anibal Sanchez has the changeup to thank for what could be a Cy Young season.
Rick Porcello’s Rising Star

Twenty seven days ago, I wrote a piece entitled “Rick Porcello is Breaking Out” in which I said the following:
Put this together and we have this story: Rick Porcello is striking out more batters than ever, walking fewer batters than ever, getting more groundballs than ever, and is allowing more homeruns per flyball than we would generally expect. All of this points toward the 24 year old having his best season to date.
Since then, all Porcello has done is prove me right. I don’t mean for this to be about me or my predictive success, I mean it to be a validation of how Porcello was showing signs that he was having his breakout campaign. Now it’s clear that he is.
Let’s take a quick look at his numbers over the last 30 days.
2-1, 30 IP, 9.68 K/9, 1.76 BB/9, 2.93 ERA, 2.77 FIP, 2.14 xFIP, 0.8 WAR.
Those are great numbers. All-Star, Cy Young type numbers. Over the last 30 days, Porcello’s 2.14 xFIP is the best in major league baseball and his xFIP this season is 7th best in MLB despite his rough April. This is no longer the Rick Porcello who is a really good #5 starter, this is Rick Porcello the really good starter.
Let’s update where Porcello stands. His K/9 is far and away the best of his career as is his BB/9.

When you translate his numbers into FIP and xFIP, it looks like this:

But it isn’t just the strikeouts and the walks, it’s also the groundballs. Rick Porcello isn’t trading groundballs for strikeouts, he’s actually getting more of both.
Everything is trending in the right direction for Porcello. More strikeouts, fewer walks, more groundballs. He’s gone from very good #5 starter with some upside to a one of the game’s best starters over the last month and a half. In fact, his particular combination of strikeouts, walks, and groundballs is quite rare and extraordinary.
He’s striking out more than 7 batters per 9, walking fewer than 2 batters per 9 and has a groundball rate above 50%. From 2000-2012, here is the list of pitchers who have finished a season with that mix: Halladay (4x), Carpenter (3x), and Hamels (1x). In 2013, the pitchers on that list are Felix Hernandez, Doug Fister, and Rick Porcello. That is some excellent company.
If we push the limits farther, to 7.5 K/9, 2.0 BB/9 and 55% GB (which Porcello has) the list of pitchers since 2000 to accomplish that feat drops to zero. Nobody. We don’t have groundball data from before the early 2000s, so I can’t tell you how rare this is in MLB history, but since the data became available, it’s never been done.
Porcello is mixing strikeouts, command of the zone, and groundball induction in a way that has never been done before. You may look at his ERA or even more foolishly his W/L record and think he’s the same old guy, but he’s actually nothing close to it. He’s turned himself into a star.
And this isn’t some fluke stretch that happens to him everyone once in a while. This is his K/9 by month for every month of his career:
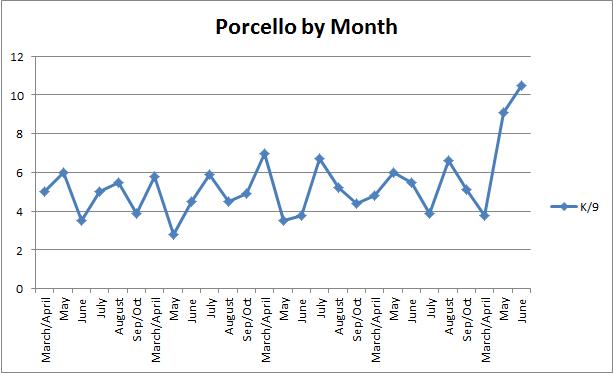
Porcello is a noticeably different pitcher. And he’s doing it by dropping the slider, cutting back on the fastballs and using curveball and changeup more often.

It’s all working. You can see the change in his approach is coming from a changeup and curveball that are moving more and have bigger separation from the fastball by velocity.
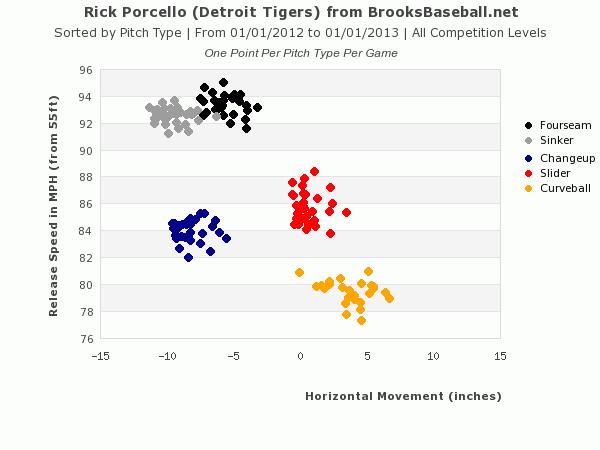
 This is all by way of saying that Rick Porcello is getting much better results over the last two months than he ever has before and that it is the result of real change in his approach to pitching. I’ve always believed this breakout would come. It’s true, you can ask friends who suffered through my lectures on him. Everyone looked at Porcello in 2009 and saw a young kid with big time prospect status. But he didn’t develop that fast and he started to get tagged as a bust. But the mistake those critics made was that Porcello got to the major leagues so early that they didn’t realize he was still developing. His training for big league baseball was all on the job training.
Consider this. Rick Porcello is in his 5th year in MLB and has made 131 starts (120 entering 2013). When each of these pitchers turned 24, they had this many starts: Doug Fister (0), Anibal Sanchez (23), Justin Verlander (32), Max Scherzer (3). Rick Porcello has more starts before his 24th birthday than all four of his rotation-mates combined. Doug Fister, Max Scherzer, Anibal Sanchez, and Justin Verlander have all played the vast majority of their major league careers over the age of 24. Porcello has played almost the whole thing below 24. Think about how much those pitchers have grown since they turned 24.
If Rick Porcello can develop at a rate even remotely close to that which his teammates have, he could be one of the best pitchers in the baseball across the late 2010s. Heck, over the last two months he already is.
Max Scherzer the Ace: The Key to His Transformation

I don’t need to tell you that Max Scherzer is an excellent MLB starting pitcher or that he’s having his best season to date. For one, I’ve already done so on a couple of occasions (Two Game Breakdowns: here and here). Also, you have eyes. You’ve watched him pitch and you’ve checked out his numbers.
But let me hit on some relevant points. Max Scherzer has the lowest walk rate of his career. He has the lowest homerun rate of his career. He has the lowest ERA, FIP, and xFIP of his career. He’s on pace for his highest WAR and might get there by August. He’s added a curveball and is using it along side his changeup to give hitters more frequent offspeed looks. He’s getting more groundballs than last year at the expense of line drives.
I’ve already laid out in the links above how well he’s avoiding the top of the strike zone. Heck, he’s throwing more strikes period. The worst things you can say about Scherzer this year is that his strikeout rate was about .25 K/9 higher last year and that his BABIP is a bit lower than we should probably expect it. That’s it. He’s due for a little regression to the mean, but almost all of his numbers look stable. This is the best we’ve seen from Scherzer. But you knew that.
You knew he’s 6th among pitchers in WAR, 4th in FIP, 5th in xFIP, and 3rd in K/9. You’ve seen it all. He’s finally putting it all together. That’s established.
So the next question is what’s different? Well I already mentioned the new pitch and the additional use of offspeed pitches. He’s throwing more strikes, but he’s not really inducing more swings and misses or more chases outside the zone. I’ve routinely talked about Scherzer’s need to rein in his wild delivery if he wanted to really have a great season. He’s doing that.
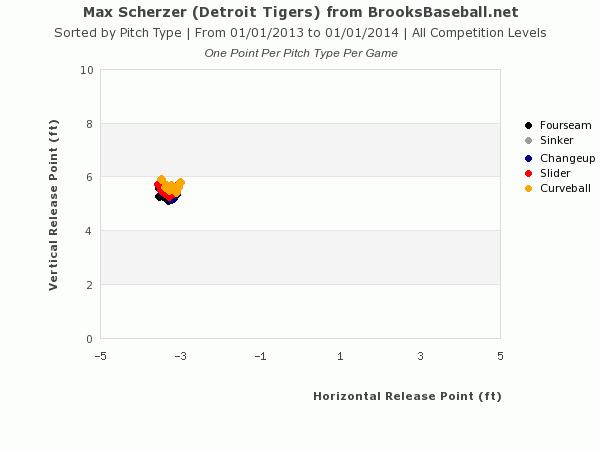
Let’s take a look at the pitches themselves. First we have single game averages from 2011:

Now here’s 2013:
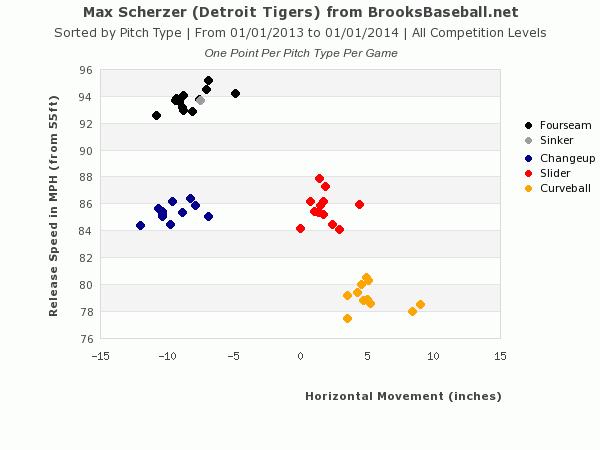
The scales are essentially identical, and while the sample size is 1/3 the size in the lower chart, you can see how much more consistent the velocity and movement are on his pitches these days. To me, that’s because he’s repeating his delivery much more so than he used to. The stuff was always good, but now he’s getting more consistent results because his release point is more consistent. Here are 2011 and 2013:

So let’s consider the facts. Max Scherzer has always had great stuff and his inconsistency held him back. Over the last the last couple seasons, he’s worked on it and has found a way to repeat his delivery such that the results are lining up with the scouting report. He’s having his best season yet and it looks like he’s finally climbed his Everest and figured out his delivery.
As he looks to make start #13 tonight, one has to ask if Max Scherzer is now officially an ace. I consider the top 15 or so starters to be aces and Scherzer is certainly one of those this year by every available measure and was just on the edge of that last season. But Scherzer also has the requisite dominant stuff that aces need and is capable of twirling a lights-out-10+K performance on almost any occasion.
Scherzer is finally getting results in line with his skills and he’s done so by going to his offspeed stuff more often and doing whatever he needed to do to get his mechanics in order so that he could command his brilliant stuff well. Max Scherzer has spent the last three years in Justin Verlander’s shadow. At times in Anibal Sanchez’s and Doug Fister’s shadow. But Max Scherzer is no man’s understudy. Max Scherzer is an ace all on his own. He’s making a case to start the All-Star Game in July and is very much in the discussion for AL Cy Young.
If you liked this, check out New English D on Porcello’s Breakout Campaign, Anibal Sanchez’s Cy Young Leap, The Tigers Approach to Pitching, and Why They Have the Best Rotation Ever.
Building the 2013 Tigers: Pitching Staff
Yesterday, I posted my thoughts on building the 2013 Detroit Tigers position players. Today let’s cover the pitching staff.
Most pitching staffs are 12 man, 5 starter units, so let’s look at who is assured of a spot.
Verlander (SP), Fister (SP), Scherzer (SP), Porcello (SP), Smyly (SP/RP), Benoit (RP), Coke (RP), Dotel (RP), and Alburquerque (RP) appear to be locks barring injury. That leaves us with one starting spot and two bullpen sports if Smyly goes to the pen or three bullpen spots if he does not.
The Tigers have a number of in house candidates to fill those spots. Bryan Villarreal, Duane Below, Casey Crosby, Daniel Schlereth, Andy Oliver, and Bruce Rondon are all guys who will get a shot at a job out of spring training. I expect others will to, but then this post would just become a list of names you could find anywhere.
It’s hard to imagine the Tigers making a big splash on the market for a starter with $20 million committed to Verlander and raises coming to the Fister/Scherzer/Porcello trio. The only starters currently available who I like more than Smyly are going to fetch 3+ years and $30 + million, which isn’t really in the budget for a team that needs help in the outfield and bullpen more pressingly. The rotation is one of the best in the game, so I’m giving the 5 spot to Smyly.
So far our staff looks like this:
SP: Verlander, Fister, Scherzer, Porcello, Smyly
RP: Benoit, Dotel, Coke (L), Alburquerque, TBA, TBA, TBA
We need to fill three spots and one of those spots should be filled by a lefty. My view is that two should come from our in-house crop and one should come from the market. I think Villarreal could prove useful again as he did until very late in 2012 and I’m a fan of Below as a first lefty. Crosby, Oliver, and Schlereth all have the ability to be a first lefty as well.
Rondon is the wild card because he’s the legitimate relief ace prospect of the bunch. He throws 100 mph and the breaking pitch is good. He has command issues at times, but he’s young. It looks like he’ll get a shot to break camp and they should let him. Pick an in house lefty and let Rondon and Villarreal fight it out for the other spot.
So we’re looking for one player on the market. Probably a righty, but I’m okay with a lefty if he can handle righties well enough.
Two guys who intrigue me a little are Brett Myers and Jason Frasor. Neither is a flashy name, but both could be useful adds like Dotel was a year ago. Myers has experience in the 8th and 9th innings and in the rotation, and Frasor’s strikeout numbers are interesting.
Both of these guys could be flexible in the pen and that’s exactly what the Tigers need as they head into 2013 without defined roles. I’m also against spending big in the relief market because even the very best are replaceable.
This staff, with the right management, could easily repeat as one of the top ones in the league in 2013.
