Torii Hunter Plays The Field

A couple of weeks ago I took a look at Torii Hunter’s late career offensive resurgence and explained that a change in his approach has paid off for the Tigers’ RF. Hunter has had a very nice career overall and was once consider one of the game’s elite defensive players. If you’re curious about Hunter’s current and former swing, check out the link above, but thanks to a reader question over the weekend, this post is going to discuss Hunter’s defense.
The genesis of the discussion was the reader wondering how Hunter’s defensive numbers look this season compared to last season because the reader noticed he’s seemed to make some bad plays out in RF. My eyes tell me the same thing. Hunter has made a number of poor plays this season at bad times.
Let’s take a look at Torii Hunter’s defense this season and throughout his career. Let’s start up front and say that I’m going to present the numbers, drawing heavily from Defensive Runs Saved (DRS) and Ultimate Zone Rating (UZR), and leaving the reputation to the side. Hunter won a lot of gold gloves and was all over the Web Gems in the late 90s and early 00s. You may remember him making amazing plays in center, but this presentation is about data. I don’t feel comfortable giving you a real scouting report from his early days because that was before the days of MLB Network and MLB.TV when I couldn’t watch all the baseball I wanted to. I’ve seen him for 100 games this year so I’ll give you the scouting report from this season and the raw data from other seasons.
Let’s take a look at the overall numbers. Remember a few things. Up through 2009 he played almost exclusively CF and after he started blending into RF and has played just one game in center since the start of 2011. What is important here is that defensive metrics judge players compared to average at their position meaning that a +10 in CF is a better defensive player than a +10 in RF. Additionally, defense peaks early. Hunter should get worse as he ages, everyone does.
Total Zone is an approximation based on play by play data that covers players up through 2001. In 2002 UZR becomes available and DRS comes in 2003. So these numbers will get more accurate as we move forward and Hunter’s best seasons happen to overlap with the infancy of advanced defense. Don’t take these numbers as gospel. They aren’t perfect, especially early. I’m just presenting the information. A final aside is that defensive metrics are generally a good description of what happened in a given season, but they take very big samples (close to 3 years) to provide a lot of predictive value about a player’s true skill level. Every 10 runs by these defensive scores equals about 1 win.
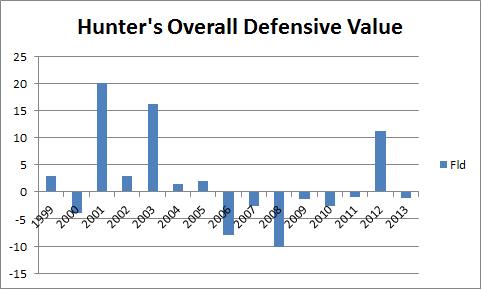
This Fld number is Total Zone until 2002 and then UZR. This is what FanGraphs uses for the defensive component of Wins Above Replacement (WAR). What you see on the surface here is that Hunter is essentially an average defensive player over his career with a couple of fantastic seasons and a couple of poor ones. The overall picture says Hunter isn’t a great defensive player overall and is pretty much in line with his career numbers this season.
Now let’s take a look at UZR and DRS in his career in CF only.

What is pretty interesting about these numbers is that DRS has almost always liked Hunter better than UZR. DRS is scored by hand and UZR is done with an algorithm. This consistency likely indicates that Hunter is doing something very pleasing to the human eyes. Let’s look at RF:

I think this is pretty interesting. He didn’t play a ton of RF in 2010, so I’m not too worried about it. In 2011 and 2012 DRS likes Hunter better in RF than UZR does, but in 2013 it flips. And that actually corresponds perfectly to what I’m seeing with my own eyes. Hunter’s range actually looks pretty good to me this season. What Hunter is doing poorly this year, in my opinion, is coughing up easy plays. I can think of at least five instances off the top of my head where Hunter got himself to medium difficulty fly ball and he just botched the catch after doing the hard work. He’s also made some atrocious throws in terms of accuracy and has misjudged the wall a few times. Hunter is making bad mistakes this year, and the data seems to suggest that this might be new.
You can see that he’s been pretty consistent in making errors in his career but is already at his quota for the season:

So the defensive metrics disagree about Hunter. Defensive Runs Saved thinks he’s pretty good (averaging about +5 DRS per season since 2003). Ultimate Zone Rating thinks he’s right about average overall with some heavy year to year variation. If you trust UZR, he’s having an average season at the end of an average career. Defensive Runs Saved says he’s having a bad season at the end of a pretty good career. In total, over the last 11 seasons the difference between Hunter’s UZR and DRS works out to about 4.5 WAR. That’s an interesting difference and it’s one that makes sense.
Let’s take a look at another statistic that I like. What is his defensive efficiency? What percentage of the balls hit to his defensive zone does he catch and how many out of zone plays does he make?

In his CF days he made more plays that average early in his career and started falling behind a little bit as time went on. That makes sense. In his early days he had great range and as he aged the young kids coming up started passing him. Here are the numbers in RF.
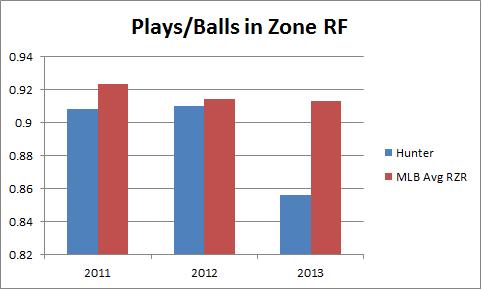
This continues the theme we’ve been seeing. Hunter was right around average in his first two seasons and has basically collapsed this season. Hunter is making fewer plays on balls in his zone this season, likely because of the misplays I’ve been talking about. It’s not limited range, it’s Hunter making mistakes. That’s how I blend this information and my own observation. Hunter seems just as athletic, but he’s not executing.

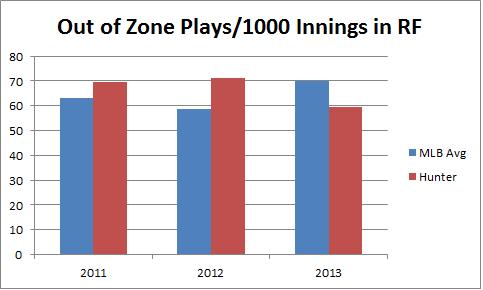
What these two charts show us is that Hunter has been in the ballpark of league average in making plays outside of his defensive zone. Recognize that these numbers were brand new in 2003 and are constantly being refined, he’s sometimes been better and sometimes worse than average.
So what does this all mean? For me, it says that Hunter has obviously declined as he’s aged but that he hasn’t lost a ton of his range relative to what you would expect given typical aging curves. Generally speaking, human scorers like Hunter’s defense more than the machines, until this season when the humans have turned on him. That turn, which lines up with what the plays/balls in zone data tells us and my own visual inspection, tells us that Hunter is getting hit this season for making mistakes fielding the ball, not getting to it.
On several occasions Hunter has gotten to medium difficulty ball and dropped it or misjudged the wall or given up on a ball in front of him a little too early. These kind of plays aren’t called for errors, but they are absolutely mistakes made by Hunter that should count against him.
So the story here is that Hunter was probably not quite as good a defender as you thought he was coming up, but that he was pretty good and remains pretty good given his age. This year he’s struggled, not with declining range, but just some stupid mistakes. You can judge that how you will, but it appears to be a sign that his defense could improve rather than continue to decline for the rest of the season. Hunter’s bat has been a nice addition for the Tigers this year and his defense, despite its current issues, is still dramatically better than what Brennan Boesch offered the last few seasons.
The Morning Edition (July 30, 2013)

From Last Night:
- The Pirates ride a strong start from Liriano over the Cards
- Giambi walks off against the White Sox
- The Rangers get two homeruns in the 9th to come back against the Angels
- Price leads the Rays past the Sox
- CarGo goes 5-5, but the Braves walk off
What I’m Watching Today:
- Lynn and Burnett continue the 5 game set in Pittsburgh in Game 1 (4p Eastern)
- Peavy scheduled to start in Cleveland, but might be traded beforehand (7p Eastern)
- Strasburg and Sanchez (7p Eastern)
- Wheeler faces Eovaldi (7p Eastern)
- Wilson and Holland go in Texas (8p Eastern)
- Latos and Volquez start opposite one of the players for which they were traded (10p Eastern)
The Big Question:
- Did you enjoy bullpen upgrade day?
The Tigers added Veras, the Braves got Downs (good move), and the Rays gambled on Crain (good move). Will the next two days include any big name starters or position players? I’m sure the TradeRumor-Industrial Complex is hoping so. They’ve been tweeting out rumors for so long they will look pretty silly if there aren’t a lot of players moved in the next 36 hours. We’ll have complete coverage of any Tigers moves here and some quick thoughts on the rest of the deals as well. Follow me on Twitter if you’re looking for up to the minute reaction to things that happen in baseball because most of my day is spent thinking about baseball and deciding if I have something interesting enough to share with other people. Usually the answer is no, but sometimes it is yes!
Tigers Pull The Trigger, Grab Veras for Vasquez

The Tigers have been looking for a bullpen piece for a long while, essentially all season long. They’ve had great contributions from Benoit and Smyly, but do need a trusted arm to round out the back end of the bullpen. What they need is a righty who dominates righties and can get lefties out as well in big situations. That’s pretty much what they got. They needed a healthy Dotel, which they don’t have yet, so they went out and traded for one.
The deal looks like this. The Tigers sent 19 year old OF prospect Danry Vasquez and a Player to Be Named Later to the Astros for RHP Jose Veras. Veras will be used in late inning setup situations in tandem with Drew Smyly and instead of Bruce Rondon. I like this trade, let’s break it down.
Jose Veras is a journeyman reliever on a cheap contract that includes a cheap team option for 2014. The Tigers are getting a year plus of Veras in this deal and at almost no financial cost. Veras has thrown 43 inning in 42 games this season and has a 9.21 K/9 and 2.93 BB/9. The strikeout rate is very much in line with his career pace, but the walks are a big step forward. He has a 2.93 ERA, 3.39 FIP, 3.54 xFIP, and 0.6 WAR, which all point to a very good overall season. He’s also doing it in the AL West, so his competition is actually going to get easier.
Veras is having his best season to date and his win probability added and run expectancy numbers are also in line with his stat line. All told, it looks like the Tigers are getting a solid relief pitcher and there aren’t any red flags involved. By New English D’s own reliever metric, SOEFA, Veras comes in at 0.24, which is an above average number.
Veras throws a sinking fastball, curveball, and splitter which all seem to be effective pitches for him and he doesn’t have a big platoon split. What is very encouraging for me about the Veras pick up is that the entire key to his improved value is his decreased walk rate. Take a look at his BB/9 over his career:

What I find encouraging about this is that I think this is coming from a real change in his approach on the mound. Something I found out while researching a piece about Adam Wainwright and Matt Moore is that throwing strikes overall is less important than throwing first pitch strikes. Getting ahead early is more important than hitting the zone period. Check. This. Out.

Veras is throwing dramatically more first pitch strikes this season than ever before and it seems to be leading to fewer walks. If Veras has really changed his approach this much, I can completely buy into the drop in walk rate. If Veras really is a 3 BB/9 guy with his K rate, he could be a very solid and valuable piece for the Tigers as they go deep into October.
This move doesn’t just improve their 7/8th combination, but it makes the middle relief better by pushing Alburquerque and Rondon earlier into the game. Veras makes the Tigers better.
As for what they gave up, I’m comfortable with it. Vasquez ranks 5th in TigsTown’s midseason update and #8 on Marc Hulet’s preseason list among Tigers prospects. He has plus potential at the plate, but there are questions about his defense already. He’s 19 and already a LF only type player, it seems. The key to Vasquez is that he’s at least three seasons away from the majors and won’t be ready to contribute until about 2016 and beyond. The Tigers window is now and another solid bullpen arm could be very helpful in October. The Tigers are trading potential value from 2016-2022 for a shot at a title in 2013-2014. As far as I’m concerned that is a risk you take when the prospect isn’t a top tier guy. Unless the PTBNL is a significant piece, the cost is worth the benefit.
The Tigers needed another high leverage reliever for the stretch run and the postseason and they got one in Veras who seems to have turned a corner in his ability to limit runs via a lower walk rate. That walk rate looks real given his first pitch strike rate. They gave up a good prospect to get him, but that prospect is far from the big leagues and the Tigers are in a very real position to win now.
Veras should help the Tigers down the stretch and could be a difference maker in October. Flags fly forever and this is a move that makes a flag more likely without a huge cost.
How Was The Game? (July 28, 2013)
Another blowout.
Tigers 12. Phillies 4
Despite losing Miguel Cabrera and Jim Leyland to Chad Fairchild’s questionable sense of superiority, the Tigers had no trouble completing an impressive sweep of the Philadelphia Phillies. Rick Porcello (19 GS, 112.1 IP, 4.49 ERA, 3.51 FIP, 2.0 WAR) was solid, but hardly necessary, giving the Tigers 6 innings of 3 run baseball in which he struck out 3 and walked 2 (1 intentional). The Phillies scattered their runs, but the Tigers unloaded in big assaults. The Tigers got 3 in the 5th to tie it and 8 in the 6th on one of the worst defensive innings you’ll ever see from the Phillies. Peralta capped it off with a grand slam and the Tigers tacked on an extra run in the 7th for good measure. The win gives the Tigers three straight and 7 of 8 to move to 59-45 on the season. They will take Monday off in preparation for a two game set with the Nationals in which Anibal Sanchez (17 GS, 104 IP, 2.68 ERA, 2.39 FIP, 3.5 WAR) will start game one.
The Moment: Peralta caps an 8 run inning with a no doubt grand slam homerun.
How Was The Game? (July 27, 2013)
A good old fashioned laugher.
Tigers 10, Phillies 0
Despite the 40 minute rain delay, the Tigers didn’t have any trouble getting off to a good start on Saturday as they annihilated the Phillies without much trouble. Max Scherzer (21 GS, 143.2 IP, 3.01 ERA, 2.72 FIP, 4.3 WAR) put the Phillies away easily in the 1st and allowed just one baserunner across his 6 innings of work to go with 7 strikeouts. Leyland pulled him after just 75 pitches to save some bullets because the Tigers offense unloaded early and often. They got 5 runs in the first on a Cabrera HR, Peralta single, and Tuiasosopo HR to the shrubs in dead center. They added 3 in the 2nd, and single runs in the 4th and 5th to run the score up to 10-0 before the Phillies knew what hit them and every Tigers starter had reached base at least once before the night was over. The Tigers went to Alburquerque for 2 innings and Reed for one to finish out the ballgame and coast to their 58th win. They’ll turn around and go for the sweep on Sunday behind Rick Porcello (18 GS, 106.1 IP, 4.49 ERA, 3.55 FIP, 1.9 WAR) who looks to keep his strong season going.
The Moment: Tuiasosopo crushes a 3 run HR to dead center to put this one away early.
How Was The Game? (July 26, 2013)
A thing of beauty.
Tigers 2, Phillies 1
In life, it’s so rare that something lives up to the hype but I’m confident in saying this duel between Cole Hamels and Doug Fister (21 GS, 135 IP, 3.67 ERA, 3.31 FIP, 2.9 WAR) did. Hamels’ only blemish was a 2 run double he allowed to Avila in the 5th and Fister allowed just a single unearned run in the 3rd. Fister gave the Tigers a brilliant effort, going 8 innings and allowing just 3 hits and 1 walk to go with his 6 strikeouts. It was everything a great Fister start should be. He was efficient, he got ground balls, and he made hitters look silly with tons of movement on the fastball and a curve about which you could write poetry. After today’s start, Fister is now 3rd in MLB in ground ball percentage and 7th in the league in walk percentage. Both teams also treated us to some great defense to put the cherry on top of the sundae that was this game, including some solid work by Santiago and a doozy of a grab by Nix in RF for the Phils. The win pushes the Tigers to 57-45 and they will avoid Cliff Lee on Saturday due to an injury. The Tigers will send Max Scherzer (20 GS, 137.2 IP, 3.14 ERA, 2.81 FIP, 4.0 WAR) to the mound to face his replacement.
The Moment: Fister gets a standing ovation after retiring 13 of the final 14 batters he faced.
Prince Fielder’s Missing Value

Prince Fielder isn’t having a bad season, he just isn’t having a great one. He’s been worth just 1.0 wins above replacement (what’s WAR?) in 101 games despite being worth close to 5 WAR in each of the last two seasons. The defensive and baserunning metrics always put Fielder clearly below average, costing his team 1-2 wins per season on average, but they are not currently out of line with his career numbers. Fielder’s missing value is entirely on the offensive side of things.
Again, this is not to say Fielder has been bad, but rather that he hasn’t been a great hitter like he normally is. These kind of seasons have happened before for Fielder. Let’s take a look at his single season wRC+ (what’s wRC+?) over his career. This is simply an offensive rate stat that measures how he compares to league average, which is set to 100.

You can see he has had down seasons in his career. In his first full season he was only at 110. In 2008 it was 125 and in 2010 it was just 136. None of those are bad numbers, but they aren’t like the 4 seasons of better than 50% better than league average that he put up in 2007, 2009, 2011, and 2012. This year he’s all the way down at 122. He’s just 22% better than the league average hitter this season when we expected to see him around 40% better. What’s going on?
Well he’s walking less and striking out more than last season, but he’s still significantly above average in both departments. He’s also been successful when he’s had a higher K%. I’m not saying these aren’t factors, but I don’t think they are the main factors. I think it’s more about the at bats in which he makes contact.
You’ll notice his overall production dips in conjunction with lower batting average and OBP, obviously, but you’ll notice the 2011 and 2012 average spike wasn’t met with an OBP spike. He traded walks for hits. This year he’s essentially walking at the same rate but isn’t getting the hits. It’s as if he changed his approach in the last few years to be more of a contact hitter, and this year the contact isn’t paying off:
You can see the contact spike very clearly in the following graph:

2011 and 2012 look like the anomalies. He saw a huge spike in his contact rate, which helped elevate the batting average. He wasn’t hitting for as much power, but plate appearance that used to be walks were now hits, which helped his offensive value because they occasionally went for extra bases as well. Let’s take a look at BB, 1B, 2B, and HR (PA numbers are all very close):
| Season | 1B | 2B | BB | HR |
| 2006 | 90 | 35 | 59 | 28 |
| 2007 | 78 | 35 | 90 | 50 |
| 2008 | 96 | 30 | 84 | 34 |
| 2009 | 93 | 35 | 110 | 46 |
| 2010 | 94 | 25 | 114 | 32 |
| 2011 | 95 | 36 | 107 | 38 |
| 2012 | 118 | 33 | 85 | 30 |
| 2013 | 66 | 21 | 52 | 17 |
He’s always had a very consistent number of singles until 2012 when that number spiked. In 2010, he walked a lot but it cost him his extra base power. 2011 was essentially the best of everything. Lots of singles, career higher 2B, 107 BB, and 38 HR. He parlayed that into a nice contract, actually. In 2012, he hit fewer homers and doubles and walked less, but had a ton more singles to make up for it. Instead of a high walking slugger, he was a solid walking well balanced hitter.
You can see in 2013 that the HR, BB, and 2B pace is down only slightly from last season. The difference between Fielder in 2012 (when he was great) and Fielder in 2013 (when he is just pretty good) is that what used to be singles are now outs. Some of that is a tick up in K% and a decrease in contact% but some of it is about batted balls.
If we look at his BABIP (what’s BABIP?) we can see that the years in which he “struggles” are the years in which he has a low batting average on balls in play.
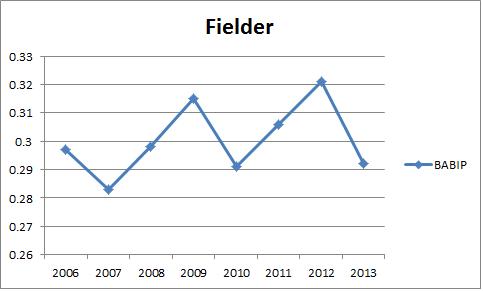
Notice first that 2007 doesn’t seem to fit the patter because he was great but has a low BABIP – but remember that he hit 50 HR that season, which aren’t in play. If we bounce 2007 up and say he had a low BABIP for a positive reason, we can see that the down years of his career are the ones with the lower BABIP.
Low BABIP can be about a hitter’s skill, approach, or quality of contact, but it can also be about luck and the quality of the other defense. Let’s see if their is a Fielder explanation in his batted ball data:

What we can see is that Fielder has been trending toward more line drives lately at the expense of fly balls, which makes perfect sense with our theory that he’s trading big power for more contact and singles. But you’ll also notice that his line drive percentage this year is actually better than his very good 2011 season. He’s also hitting a lot more fly balls this year that he did in the last two seasons, but he has previously been successful hitting that many fly balls. Fielder’s approach is definitely different that in used to be in this respect, but it doesn’t appear to be detrimentally different.
He’s hitting more balls in the air, but they aren’t leaving the park like they should. He is HR/FB%:
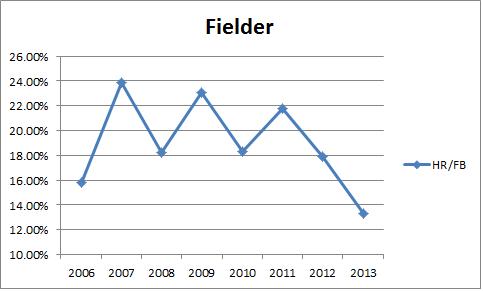
You’ll notice that it has fluctuated in his career, as we would expect given the fluky nature of HR/FB%, but his number in 2013 is noticeably lower than the typical fluctuation. In his best years he’s hitting 22% or better, but in his down years we expect it around 18%. Let’s imagine a scenario in which Fielder’s HR/FB% was 18% this season. That would be 23 HR instead of 17. Five additional homeruns is a meaningful difference.
His current 2013 wOBA (what’s wOBA?) is .352, which is good but not amazing. If we trade 5 outs for HR, what happens? It goes up to .377. That’s not in line with his great seasons, but it’s much better. That calculates out to a wRAA (what’s wRAA?) of 22.5, which is good for about 2.4 WAR offensively. He’s currently offering an offensive WAR of around 1.3. These 5 HR account for an entire win above replacement in value and something like 1.6 WAR extrapolated out over an entire season. He’s a 3.9 WAR offensive player if he hits exactly like this the rest of the season if he bring his HR/FB% in line with his previous lows. That’s much better. His defense and running will still cost him 1-2 wins before he positional and replacement level adjustment.
So we have to ask ourselves if the HR/FB rate is Fielder’s fault or just bad luck? And also, if he’s generally been unlucky on balls in play turning into outs. If it’s just bad luck, we don’t have to worry and we can easily expect him to regress to the mean and play better the rest of the way.
If we take a look at this Hard Hit Average leaderboard, Prince Fielder still ranks extremely well (H/T Mark Simon and ESPN Stats and Info):

If you can’t read it, he’s 14th in baseball with a hard hit average better than guys like Chris Davis, David Wright, and Paul Goldschmidt. It seems like he’s making hard contact at a high rate, but he’s simply not getting those balls to drop. The same thing happened to Victor Martinez earlier this season and everything corrected itself for him. If we believe that hard hit balls are predictive of good performance, and I do, then it looks like Fielder is just getting unlucky and everything should be fine. His hard hit average is down this year, but it’s still way above the MLB average of .170. When you hit the ball hard this often, the results are usually very good.
| Hard Hit Average | |
| 2010 | 0.244 |
| 2011 | 0.290 |
| 2012 | 0.269 |
| 2013 | 0.234 |
He’s getting fewer hits on balls in play, but he’s not hitting the ball weakly, he’s hitting it in the wrong place. Combine that with a fluky low HR/FB% and you can wash away Fielder’s offensive problems. The results matter for the team, but there doesn’t appear to be anything wrong with the process. And process is more predictive than results going forward and going forward is what we care about. Even if he’s lost a touch of power behind his swing, it’s still going to produce results better than this going forward.
Prince Fielder is having a down season in the second season of a huge contract, but it doesn’t look like this is the sign of an early decline. It’s mostly just some bad luck, and luck often turns.
How Was The Game? (July 25, 2013)
Another rocky one for JV.
White Sox 7, Tigers 4
The Tigers couldn’t cash in on a sweep in Chicago today as Justin Verlander (22 GS, 137.2 IP, 3.99 ERA, 3.41 FIP, 3.0 WAR) struggled again, allowing 7 runs in 6 innings on 11 hits, 2 walks, and 4 K. Verlander again struggled to get both breaking balls working and couldn’t get enough sink on his fastball when he wanted to thanks to a problem with his release point that we chronicled yesterday. The Tigers didn’t go quietly, however, as they got runs on Hunter, Martinez, and Pena homeruns against Peavy but couldn’t complete the comeback despite getting the tying run to the plate in the 9th. The loss drops the Tigers to 56-45 as they head home to face the Phillies on Friday and will call on Doug Fister (20 GS, 127 IP, 3.90 ERA, 3.40 FIP, 2.6 WAR) to lead them to victory.
The Moment: Pena swats a homerun in the 8th and sprints around the bases.
How Was The Game? (July 24, 2013)
Another clean win.
Tigers 6, White Sox 2
The Tigers picked up their four consecutive win on Wednesday thanks in part to a solid outing from Anibal Sanchez (17 GS, 104 IP, 2.68 ERA, 2.39 FIP, 3.5 WAR ) who turned in 6 shutout innings, allowing 6 hits, 1 BB, and 5 K. The bats got going early as the Tigers got three homeruns – one from Prince, one from Jackson, and one from Hunter – to take an early and commanding 5-0 lead. Avila added an RBI single to give the Tigers their 6th run before Rondon allowed 1 back in his one inning of work. A 3 K 8th from Smyly and a cleanup job by Benoit in the 9th after Putkonen and Coke struggled took the Tigers the rest of the way and improved their record to 56-44.
They’ll carry their 3.5 game lead in the Central into Thursday’s matinee looking to sweep the set with the Sox. They’ll call on Justin Verlander (21 GS, 131.2 IP, 3.69 ERA, 3.35 FIP, 3.0 WAR) to get the job done. If you missed it yesterday, New English D broke down exactly what has been troubling Verlander this year.
The Moment: Prince puts the Tigers ahead early, and for good.
What’s Going On With Verlander?
Justin Verlander was baseball’s best pitcher over the last four seasons, but this year Verlander has regressed all the way down to being, like, baseball’s 10th best pitcher. We’ve overblown his struggles because we’re used to him never struggling. He’s not 2009-2012 Justin Verlander, but he’s still better than almost anyone else in baseball.
That said, despite a respectable 3.69 ERA, 3.35 FIP (what’s FIP?), and 3.0 WAR (what’s WAR?), there are some signs of trouble. He has the lowest K/9 and highest BB/9 since his 2008 struggles:

The strikeout drop isn’t dramatic, but the walk differential is a bit concerning. He’s allowing a higher batting average against and a higher BABIP (what’s BABIP?) so some of this could be luck, but it could also be because he’s easier to hit. His line drive, fly ball, and ground ball rates are almost identical to his 2012 numbers .
The key for JV is a little bit of batted ball luck, but mostly it’s a strikeout to walk ratio problem. Try this on for size, in 2012, 32% of Verlander’s total batters faced ended in a walk, HBP, or strikeout. In 2013, it’s exactly the same. He’s allowing the same percentage of balls to be put in play as last season and he’s allowed the exact same line drive, fly ball, and ground ball mix. Exactly the same.
The difference for Verlander in 2013, we can say, is that he’s walking batters during at bats in which he used to strike them out. This is evident when you consider opposing hitters are chasing pitches outside the zone against Verlander less often and he’s getting fewer swinging strikes. Basically, batters aren’t chasing Verlander’s pitches and he isn’t inducing as many swings and misses as he did last season. As a result, instead of striking out a batter chasing on 3-2, he’s walking them which extends innings and makes the hits he does allow more costly in terms of run prevention.
He’s not allowing more balls in play as a percentage of batters faced, but he is allowing more overall because walks are extending his innings and giving other teams more chances to cash in. In 2012 he faced 3.7 batters per inning on average. In 2013 it’s 4.3. The problem with Verlander is that he’s doesn’t put hitters away with a strikeout and instead grants a walk. Everything else unravels from there.
What’s behind all of this?
I have two basic answers with one common cause. None of it has anything to do with his velocity. We’ve seen Verlander pitch effectively with lower velocity before and he’s been successful this season when he didn’t have a good fastball and he’s been bad this season when he has had the 95+mph.
This is something different. It’s something fixable. It’s not something we should worry too much about. Let’s break it down.
1. Movement on His Breaking Balls
Last season his curveball averaged 6.3 inches of horizontal movement and 8.5 inches of vertical movement (these are Pitch F/X numbers and are based on where the ball would be expected to finish based on a baseball that wasn’t rotating). This year, he’s at 5.2 and 7.7 inches respectively. It’s easier to see graphically (All graphs from catcher’s perspective. H/T to Brooks and FanGraphs):
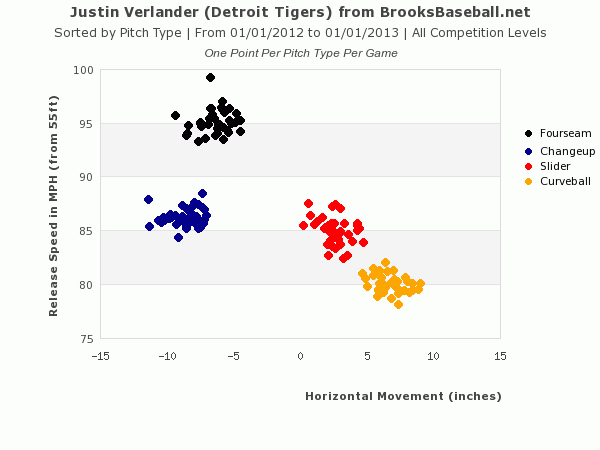

Notice how his curveball has as much horizontal break as his slider this season when it used to have more in the past. Now let’s look at horizontal and vertical movement together.


You can see the problem in his slider too a little bit, actually. The curveball isn’t breaking horizontally enough and the slider doesn’t have enough vertical depth. Both pitches are blending into a hanging breaking ball. The slider is faster, but it lacks the vertical depth needed to get hitters (especially lefties) out. The curveball is essentially just a slower version of the slider with some vertical depth. Neither is what it was in 2012. In order for Verlander to use these pitches effectively, they need to have different properties. The curveball is a slower pitch with more break and the slider is faster with less. They need to be different in all three dimensions – velocity, horizontal, and vertical – and they need to both break more in general than they are this season.
As a result, hitters are laying off the sliders that they used to swing through and more of those sliders are getting called as balls. The curveball has still been an effective weapon at times, but he’s throwing it less often because it isn’t moving the way he wants it to.
This is a bit convoluted so I’lll try to make it clearer. His curveball is getting more swings than it used to and the contact against on it is up because it isn’t moving the way it used to. The slider is less effective because hitters are swinging less and it’s not landing in the zone. The curveball is more hittable and the slider is less enticing. This is problem number one.
2. Fastball…Movement
In the charts above, you could see the breaking ball problems if you looked at overall averages from each game. They are clear as day. But the fastball doesn’t look much different other than a bit of a drop in average velocity. But as I pointed out earlier, two of his rockiest starts have come when he had his best fastball. The success isn’t about velocity. It’s above vertical movement on his fastball and you can’t see the problem if you don’t look at every pitch.
The horizontal problem with the curveball and vertical issue with the slider are evident overall because they are a consistent problem. But the fastball issue is only some of the time, take a look at 2012 and then 2013:

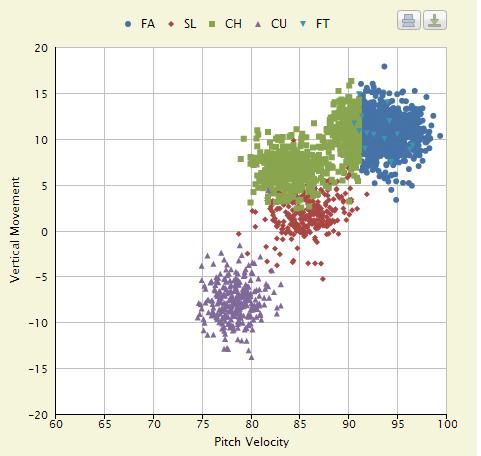
Notice that missing cluster of fastballs in the 0-5 vertical movement section? Those are gone. He’s missing a subset of his fastballs that drop significantly on their way to the plate. You can see it in the horizontal and vertical plots too, 2012 and then 2013:


A cluster of fastballs (and changeups because of some Pitch F/X confusion) is missing that are just down and to the left of center. They are gone. It’s not like there are fewer or they aren’t moving as much, they are totally absent. And this isn’t a classification issue because we’re not talking about these being fastballs OR changeups, there simply are no pitches thrown in that location on the chart.
His fastballs all have the same general horizontal and vertical movement as each other this season when Verlander used to be able to go to a fastball that had more sink on it in 2012. Not having that pitch in his arsenal is likely the cause of a nearly 3% drop in his fastball swing and miss rate from 2012 to 2013. Verlander used to get more whiffs on the fastball and now he isn’t anymore and when they do make contact they do so for more line drives. They’re squaring up his fastball more because there is less variation in its movement.
So now that we’ve established the problem and the connection to the results, we have to ask what is responsible for this? Everyone wants to talk velocity, but two of his worst starts were two of his “best” fastball days. No friends, this is something much more technical.
Release Point
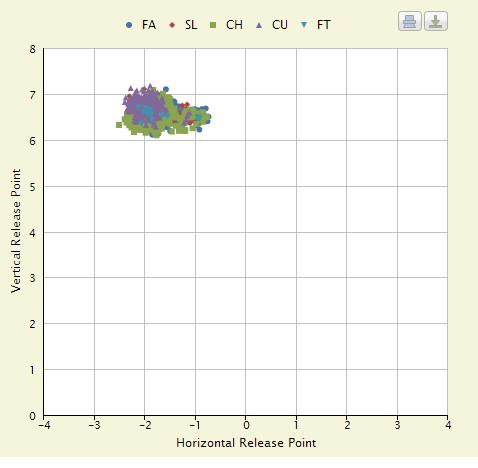
Let’s take a look at his release points form 2012 and 2013:
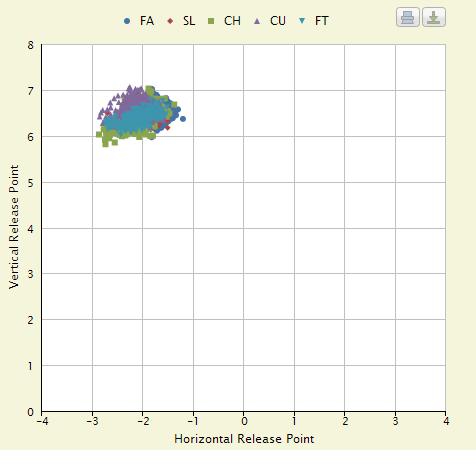
That looks awfully different. Terrifyingly different, one might say if they were prone to hyperbole. Let’s take a look at just curveballs and sliders first:


That’s a big difference. The scale is in feet. We’re talking about release the ball 6-12 inches different from normal in some cases, and at the very least it’s a more inconsistent release point that we saw in 2012. Let’s try fastballs and changeups:

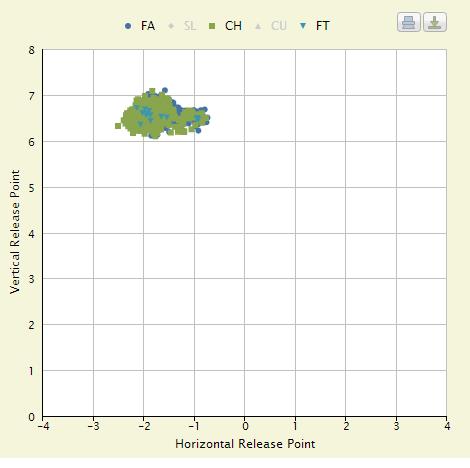
Again, this is a big difference. I don’t even need to describe it to you. He’s releasing the ball closer to first base on his breaking balls and on his fastballs and changeups. This is the difference. It’s a mechanical issue that he needs to correct. I’m not a master of .gifs and screenshots, but I’ve seen the tape from 2012 and 2013 and can tell you he’s falling off to the first base side more in 2013 than he used to. His body is taking him away from the plate and it’s preventing him from getting on top of his pitches – which makes sense that he can’t get the vertical movement on some of his fastballs but the horizontal movement is just fine. It also explains the problem with his breaking balls. Less depth on the slider and less horizontal break on the curveball.
I’m not a pitching coach and I didn’t pitch growing up (I caught, so I can diagnose the problem even if I can’t fix it), but I can clearly see the problem. I don’t know if Verlander is out of whack in his timing or if he’s favoring a lower body injury, but this is what’s going on.
The problem with his pitches lines up with the problems in results and this release point problem explains it all very nicely. Something else could be wrong, but this definitely is. It’s right there in front of you.
This is good news for Tigers fans because it’s really easy to fix compared to an injury. Verlander can just straighten out and get back to being himself. He just signed a huge contract, so it’s good to see this might not be him wearing down but rather him just being out of sync. That’s actually the explanation he’s given the press. It seems to be true.
It also explains why he’s shown flashes of himself. Sometimes he does throw the ball from the right spot and those pitches do their thing. The problem is when he gets out of sync and he loses it, things can turn quickly. Have you noticed how it’s tended to blow up in some innings but rarely across entire games. This is Verlander fighting his delivery, not fighting his body.
And he can fix it. Heck, Scherzer has a way more complicated motion and he’s repeated that like a champ so far this season. It’s going to be okay Tigers fans, the ace isn’t fading, he’s just going through a bit of a rough patch. And he can find a way to fix it. (Here’s a post from August 6th, showing improvement!)
