Appreciating Norm Cash and The Summer of ’61

My Dad and I have a running joke about the Fox Sports Detroit trivia question that goes something like this: If the question is about the last Tigers player to do (any statistic relating to hitters) in a single season, the answers is always, unquestionably, don’t even bother looking it up…Norm Cash 1961. It’s time to fully appreciate that season.
Cash spent 15 of his 17 MLB season in Detroit and accumulated 54.2 WAR (what’s WAR?) in a Tigers’ uniform and 54.6 WAR overall. He was a very good player in every way. He was a solid defender who hit .271/.374/.488 with a .382 wOBA (what’s wOBA?) and 139 wRC+ (what’s wRC+?) in his career. Overall, that offensive line is nearly 40% better than league average in his era. That’s a great, just missed the Hall of Fame career. In fact, there’s a reasonable case he should be in the Hall based on who is in and the insulting fact that he spent just one season on the ballot. I can accept that he isn’t a Hall of Fame, but he deserved more than 1.6% of the vote in his only year.
But let’s leave that aside. Cash had a very good career and is one of the top 10 Tigers position players of all time. What I’d like to highlight is what Cash did in 1961. Because it was ridiculous. Ridiculous. One more because it was that good, ridiculous.
To start, let’s lay out the particulars. Cash hit .361/.487/.662 with a 41 HR, a .488 wOBA and 193 wRC+ along with solid defense to lead to 10.1 WAR. What’s even more amazing about this is that Cash didn’t win the MVP. He didn’t even finish 2nd. Or 3rd. He finished 4th in the 1961 AL MVP vote despite this amazing season.
Now don’t get me wrong, it wasn’t highway robbery that Cash didn’t win. The problem was who he lost to. Roger Maris happened to hit 61 HR that season, so the voters gave the award to him and his league leading 142 RBI despite a .269/.372/.620 line to go with his .424 wOBA and 163 wRC+. Maris had an excellent season, but the fact that he beat out Cash is silly. Maris also beat out Mickey Mantle’s .317/.448/.687 season (.478 wOBA, 197 wRC+, 10.4 WAR) and Jim Gentile’s .302/.423/.646 campaign and .453 wOBA and 180 wRC+.
Norm Cash and Mickey Mantle were substantially better players than Maris in 1961 but the HR/RBI totals were all the voters chose to care about. You can’t even say it was a carried his team thing because Mantle wore the same uniform and the Tigers also won over 100 games.
But let’s leave that aside and discuss Cash’s season. Take a look at how his numbers compare to MLB league average (for non-pitchers) in 1961:
| Season | BB% | K% | AVG | OBP | SLG | wOBA | wRC+ |
| Non P League Average | 9.40% | 12.30% | 0.267 | 0.338 | 0.415 | 0.334 | 99 |
| Norm Cash | 18.50% | 12.60% | 0.361 | 0.487 | 0.662 | 0.488 | 193 |
Cash walked twice as much as the rest of the league and got on base in about 15% more of his trips to the plate while slugging and impressive 154 points above average. Put together, Cash hit 94% better than league average. 94% better than league average is something that has only happened only about 50 times in since 1901. Ty Cobb is the only other Tiger to ever do it (although there’s a guy in 2013 making a run…).
It was an impressive season compared to most others in MLB history and in Tigers history, but it also stands out above anything else Norm Cash ever did. I gave you his career line earlier, and while it’s great, it’s not anything like this. Take a look at his wOBA, wRC+, and WAR season by season. It’s nuts.


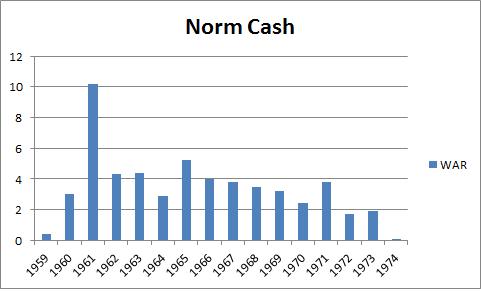
Most of the guys with all time elite seasons like Cash in ’61 usually do it again. By my count, 23 different players have posted a wRC+ of 193 or better in a single season since 1901. Only Norm Cash and Arky Vaughan never posted another season of 168 wRC+ of better. Almost every player who has ever had an offensive season like Cash did in 1961 has done it more than once. Cash had many very good seasons in his career, but 1961 is his unquestioned, absolute peak.
Cash was 26 years old in the summer of 1961 while Roger Maris made a run at Ruth’s HR record and while Mickey Mantle was running through his insane peak. Cash is often overlooked because he was more of a fringe All-Star type player than an MVP candidate most seasons, but his ’61 season is among the very best baseball has to offer.
Among Tigers, few have rivaled it. Five of the top six seasons in Tigers history by WAR belong to Ty Cobb. The other is Cash in ’61. Offensively, Ty Cobb is first and second among Tigers in terms of single seasons. Norm Cash is 4th. The guy in 3rd place hasn’t complete his season yet, so it isn’t in the official record.
Miguel Cabrera is hitting better in 2013 than Norm Cash did in 1961. That’s amazing, and Fox Sports Detroit might have to revamp the trivia questions to say, “other than Miguel Cabrera, who was the last Tiger to….”
The answer is always Norm Cash in 1961.
How Was The Game? (July 23, 2013)
The best case scenario.
Tigers 6, White Sox 2
For a team that was missing its biggest offensive threat, the Tigers didn’t show any signs of trouble. Rick Porcello (18 GS, 106.1 IP, 4.49 ERA, 3.54 FIP, 1.9 WAR) didn’t rack up strikeouts but he mowed down the Sox bats across 7 shutout innings in which he walked a season high 3, but also only allowed 4 hits – three of which didn’t make it out of the infield. Porcello trusted his sinker and got ground ball after ground ball and handed the game over to the pen for the final two. The offense didn’t miss Cabrera as they got 3 runs in the 4th and 3 in the 6th thanks to plenty of offensive from the bottom of the order. Peralta, Avila, Kelly, and Perez were all on base at least twice and once they broke through in the 4th, the game was never really in doubt. The win assures the Tigers of no worse than a split and they will try to take game three and the series Wednesday night behind Anibal Sanchez (16 GS, 98 IP, 2.85 ERA, 2.42 FIP, 3.3 WAR).
The Moment: Hernan Perez scores on his own swing – but only gets credit for a 3B and advancing on an error in the 6th.
Introducing Tigers Starters Watchability Scores (WATCH)
Among the things we love at New English D are the Detroit Tigers, starting pitching, math, and nonsensical rankings. This post will combine all three in glorious fashion. I’ve often thought about doing something like this because I’ve always had my own rankings of which starters I enjoyed watching the most. If you’re familiar with this site, I’m not just a fan of great pitching, I’m a fan of certain kinds of pitching. The rankings below reflect that. This is meant to be fun.
Among the factors considered here are how deep a pitcher pitches into games, strikeouts, walks, ground balls, first pitch strikes, and how quickly they work. Each number is compared to the team average (not league average) and added together with all six categories weighted equally. Hat tip to Carson Cistulli of Fangraphs for inspiring the idea with his NERD scores.
As July 23, the 2013 Tigers WATCH List looks like this:
5. Justin Verlander
4. Anibal Sanchez
3. Rick Porcello
2. Max Scherzer
1. Doug Fister
If you’re interested, here are the monthly ranks to date:
| Rank | April | May | June | July |
| 5 | Porcello | Verlander | Sanchez | Sanchez |
| 4 | Verlander | Scherzer | Verlander | Verlander |
| 3 | Sanchez | Sanchez | Porcello | Fister |
| 2 | Fister | Fister | Fister | Scherzer |
| 1 | Scherzer | Porcello | Scherzer | Porcello |
Should you be curious about full league WATCH scores, here are the best 10 and worst 10:
| Rank | Name |
| 1 | Adam Wainwright |
| 2 | Matt Harvey |
| 3 | Cliff Lee |
| 4 | Chris Sale |
| 5 | Felix Hernandez |
| 6 | Jordan Zimmermann |
| 7 | Max Scherzer |
| 8 | Hisashi Iwakuma |
| 9 | Doug Fister |
| 10 | Clayton Kershaw |
| Rank | Name |
| 80 | Dylan Axelrod |
| 81 | Ryan Dempster |
| 82 | Jeff Locke |
| 83 | Wade Davis |
| 84 | Edinson Volquez |
| 85 | Matt Moore |
| 86 | Ubaldo Jimenez |
| 87 | Lucas Harrell |
| 88 | Barry Zito |
| 89 | Jason Marquis |
Enjoy watching baseball!
How Was The Game? (July 22, 2013)
Smooth sailing.
Tigers 7, White Sox 3
Max Scherzer (14-1, 137.1 IP, 3.14 ERA, 2.81 FIP, 4.0 WAR) was Max Scherzer on Monday night, turning in a sparkling 8 innings in which he allowed just 4 hits, struck out 5 and allowed just two runs, both on solo homers. He was in command early, as he retired the first 12 he faced and guided the Tigers comfortably to the 9th inning. His offense backed him up with a run in the 3rd, 2 in the 5th, and 1 in the 7th courtesy of a Fielder single, VMart single, and Hunter longball and then three bonus runs in the 9th on some weird White Sox defense and the subsequent consequences thereof. The Tigers took care of business start to finish, but got a bit of a scare as Miguel Cabrera left the game with a sore hip flexor and will be reevaluated Tuesday. The team will send Rick Porcello (6-6, 99.1 IP, 4.80 ERA, 3.51 FIP, 1.8 WAR) to the mound for game two as he looks to build on his strong first half.
The Moment: Martinez cashes in two with a two out single in the 5th.
The Morning Edition (July 22, 2013)
From Last Night:
- Harvey dominates the Phils over 7 innings, allows 3 H and 10 K as Lee struggles
- Masterson flirts with a no-hitter in a 7-1 win over the Twins
- Giants waste a great start from Bumgarner
- Colon drops a CGSO on the Angels
- Wainwright’s 8 strong innings lead the Cards over the Padres
- Felix turns in 6 solid inning as the Mariners thrash the Astros
- Peralta and Alvarez throw gems, but it takes a Gindl walk off in the 13th to finalize the Crew and Fish
- Kershaw throws well, Zimmermann gets rocked in Dodgers win at Nats
- Bailey K’s 12 but the Reds fall to the Bucs
- Rays win…again
What I’m Watching Today:
- Darvish comes to Yankee Stadium (7p Eastern)
- Scherzer and Sale (8p Eastern)
- Garza showcase continues against Skaggs in AZ (930p Eastern)
- Lincecum returns to the mound for the first time since his no-hitter (10p Eastern)
The Big Question:
- Should the Rays scare you?
The answer is yes under certain conditions. First, if you cheer for the Rays, no the Rays should not scare you. Also, if you’re team is wildly out of the race, then you should just enjoy baseball and not sweat the standings. But everyone else should be worried because the Rays are dangerous. They probably won’t sustain a 17-2 pace for the rest of the season but they are putting the East on notice. On May 7th, the Rays were 14-18 and looked like they weren’t going to be able to provide their usually excellent starting pitching. Since then, they are 44-23, which is a 106 win pace. This is a good team that just had their rough stretch early, which is often a nice way to lull your opponents into a false sense of security. I picked the Rays to win the East and haven’t wavered. They are baseball’s 3rd best offense and 11th best pitching staff and have one of baseball’s best managers and easily the best GM. This is a team that should scare you. They have one of the game’s best in Longoria, an excellent super utility guy in Zobrist, the underrated Jennings, the young Myers, and the lightning in a bottle Loney. Not to mention the pitching is back. They Rays are hot and are only going to cool off a little.
How Was The Game? (July 21, 2013)
A nice win.
Tigers 4, Royals 1
After two narrow losses to start the series, the Tigers took the final game in the set thanks to a solid outing from Doug Fister (8-5, 127 IP, 3.90 ERA, 3.41 FIP, 2.6 WAR) and a couple of solo homeruns from Cabrera and Dirks to go along with two Brayan Pena sac flies and good days at the plate from Fielder and Martinez. After a few rough outings, Fister’s 6 IP, 1 R, 1 BB, 6 K performance was a welcome sight that helped the team avoid a sweep at the hands of the Royals and James Shields with a four game set with the White Sox looming. They’ll hop a plane to Chicago at 53-44 on the season and will call upon Max Scherzer (13-1, 129.2 IP, 3.19 ERA, 2.68 FIP, 4.0 WAR) to start on Monday.
The Moment: Dirks’ homerun just barely clears the fence…and Dyson’s glove.
How Was The Game? (July 20, 2013)
A little sloppy all around.
Royals 6, Tigers 5
Justin Verlander (10-7, 131.2 IP, 3.62 ERA, 3.36 FIP, 3.0 WAR) didn’t have his best night, allowing 6 runs (5 earned) across 5.2 innings of work that included 8 hits and 4 walks to go with just 3 strikeouts. He did a nice job avoiding catastrophic damage and gave the Tigers a shot to claw back. He left the game with his team trailing 6-5 courtesy of 2 in the 1st, 1 in the 2nd, and 2 in the 5th thanks to solid production from the middle of the order and a big night for Avila. The Tigers had a great scoring chance in the 8th when the first two men reached, but Leyland gave away an out by having Jackson bunt and then Hunter and Cabrera grounded out before the Tigers could score and the Tigers were unable to knock in Hernan Perez in the 9th who pinch ran after a Martinez double. The Tigers will look to salvage one in the series on Sunday with Doug Fister (7-5, 121 IP, 4.02 ERA, 3.35 FIP, 2.6 WAR) set to take the hill
The Moment: Dirks beats out ground ball on a botched defensive play by Hosmer and Guthrie to set up two runs.
Torii Hunter Has Kept It Up

Aside from re-upping with Anibal Sanchez, the Tigers big offseason move was signing Torii Hunter to a two year deal to man RF at Comerica Park. He was coming off of a career year in which he posted a rather high Batting Average on Balls In Play (BABIP) which led most to believe he wouldn’t perform as well in 2013 as he did in 2012.
That’s a pretty simple belief and one that had a lot of merit. Players don’t often make dramatic changes to their offensive approach in their late 30s and have career renaissances. But after almost 100 games in 2013, it’s starting to look like Hunter’s change is real and sustainable and that he might just be the player he was last year.
Let’s start with a couple quick points. His defensive and baserunner numbers are way down this season. He’s playing around league average in the field and on the bases despite very good numbers in 2012. I can fully confirm the defensive issues as Hunter has made his share of bonehead plays in RF. In general, he’s not the great defender he once was, but he’s been perfectly serviceable out there and is a big step up from Brennan Boesch.
This post is about his offense because that’s the interesting thing. Let’s start with the basic career trends before we get into the last two seasons. If we just look at his basic offensive rate, he’s aged pretty well (what’s wRC+?)

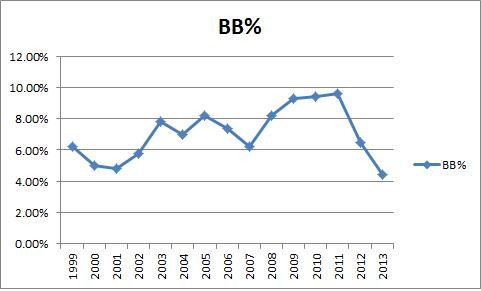
But the key with Hunter was that he used to hit for more power with a lower on base. As he’s aged, those numbers have trended in opposite directions:

It’s not the easiest thing to see, but notice how his OBP has been picking up late in his career while his slugging is consistently much lower than it was from 2002-2009. This might make some sense if Torii was becoming a more selective hitter who drew more walks, but that’s not happening:
Um…what? Hunter is getting his offensive value from his new found OBP, but he’s walking substantially less that he used to. This is quite interesting. Obviously, you’ve figured out by now that the only way to do this is to substantially improve your batting average:

So this is a pretty clear story. Hunter is picking up his offensive value as he’s gotten older by getting on base via hits more often and hitting for less power than his younger self. In 2012 he posted a career high batting average and in 2013 is just ahead of that pace as I write this. Hunter is having another great offensive season relative to his career norm and age, and he’s doing it with fewer walks and long balls and more base hits.
He’s where the sustainability comes into play. As you can read about at the BABIP link above, you know that significant deviations from career BABIP norms are usually the kind of thing that won’t sustain themselves and players will revert back to normal. Here’s Hunter’s BABIP:
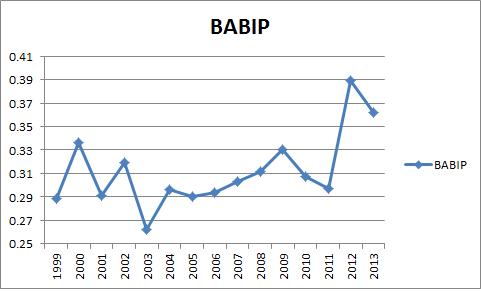
So that’s way different from anything he’s ever done. Early in his career he pushed .330 a couple times but he’s above .360 the last two seasons. What’s going on here? Well the reports are he has changed his approach as he’s aged in acknowledgement that he is no longer the power bat who hits for extra bases, but now it’s his job to get on for Pujols last year and Cabrera this year.
At the end of last season the word on Hunter was that he had a great year but a lot of it was luck driven by a high-unsustainable BABIP. Well he’s doing it again. We’re now at the point where Hunter has done this for almost 1,000 plate appearances, so it’s time to start believing. The Angels gave him Pujols in 2012 and then he moved to the Tigers in 2013 and got Cabrera, which instructed Hunter that his role would now be different and he would change his approach accordingly.
I’m now at the point where I think this is a real sustainable change. We’ve heard him talk about changing as he’s aged, but anyone can have a lucky year. We’re now to the point where it looks like this is for real. Take a look at his 2012 and 2013 numbers next to each other. Remember LA is a tougher park, but otherwise, this is crazy:
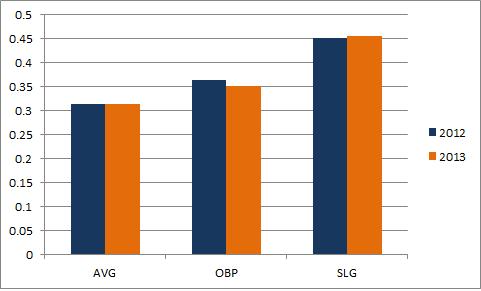
Hunter is doing pretty much the exact same thing he did last season. More hits, fewer walks, less power than his career numbers and a much higher BABIP. This is the new Torii Hunter and it’s real. It’s not luck. He’s different and it’s working. He may not be the defender or runner he once was, but he’s still league average in a corner and is something close to 20% better than league average at the plate. He’s gone from a power guy with a low on base like Adam Jones to a high OBP, lower power guy that’s just as valuable. That’s pretty good adaptation.
He’s posting the highest swing percentage and highest contact rates of his career. Here’s where it gets good. You can see it in other data. Check out his batted ball data, which only exists back to 2002:
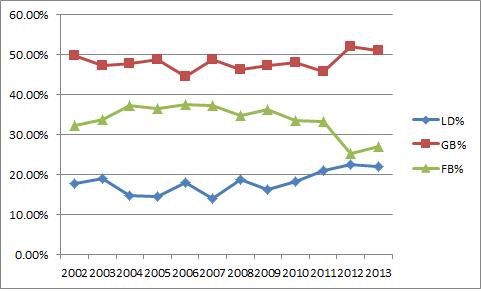
He’s cutting down on fly balls in exchange for more line drives and ground balls. He knows he doesn’t have the power he used to, so now he’s becoming a singles hitter who occasionally swings for the fences. It’s this type of change that leads me to believe the BABIP change is real and sustainable. Hunter is swinging more and making more contact while hitting the ball in the air less. That’s exactly what I’d tell someone to do if they were aging and trying to stay valuable without a great eye at the plate. Hunter has had some good walking years, but it’s never been his strong suit. Instead of adding discipline in his golden years, he’s adding singles. And it’s working.
Torii Hunter is on track for a 2.5-3.0 WAR season despite very pedestrian defensive and baserunning numbers. He’s doing a very nice job at the plate and there’s no reason to think it’s a fluke. The Tigers gambled on Hunter’s new approach being real and it’s working for them as much as it’s working for him.
How Was The Game? (July 19, 2013)
Pretty quiet, but nice to have it back.
Royals 1, Tigers 0
The second half of the season got off to a bit of a slow start for the Tigers as they didn’t manage to provide any support for Anibal Sanchez (7-7, 98 IP, 2.85 ERA, 2.44 FIP, 3.3 WAR) who pitched in and out of traffic but avoided much damage, finishing with 6 innings of 1 run baseball, despite a hefty number of walks. The Tigers only put up 2 hits for their part and had quite a few balls die on the warning track. There’s not much else to say other than that the Tigers did a nice job preventing runs but couldn’t muster any of their own. They’ll be back at it on Saturday behind Justin Verlander (10-6, 126 IP, 3.50 ERA, 3.23 FIP, 3.0 WAR) who looks to build off an impressive first half finale.
The Moment: Fielder scolds Cain into tagging himself out on a weak ground ball.
RBI Is A Misleading Statistic: A Case Study
One of our missions here at New English D is to help popularize sabermetric concepts and statistics and diminish the use of certain traditional stats that are very misleading. If you’re a return reader, you’ve no doubt seen our series about the pitcher win:
- The Nine Best Seasons Under 9 Wins
- The Nine Worst 20 Win Seasons
- Comparing Wins Over Entire Careers
- A Case Study from 2012 about Wins
- 12 Assorted Facts Regarding Wins
I encourage you to read those posts if you haven’t already, but I’m confident in the case I’ve laid out. Wins aren’t a good way to measure pitchers’ performance and I’ll let those five links stand on their own. Today, I’d like to move forward and pick up the mantle with another statistic that is very misleading based on how it is currently used: Runs Batted In (RBI).
I’ll have a series of posts on the subject, but I’m going to start with a case study in order to explain the theory. RBI are a bad statistic because they are a misleading measure of value. Most people consider RBI to be really important because “driving in runs” is critical to success, but RBI is very much dependent on the performance of the other players on your team. A very good hitter on a bad team will have fewer RBI than a good hitter on a good team because even if they perform in an identical manner, the first hitter will have fewer chances to drive in runners. Even if they have the same average, on base, and slugging percentages overall and with runners on and with runners in scoring position. The raw number RBI is a blunt tool to measure the ability to drive in runs.
Factors that determine how many RBI you have outside of your control are the number and position of runners on base for you, the number of outs when you come to the plate with men on base, and the quality of the baserunners. If you get a hit with runners in scoring position 40% of the time (a great number) but there are just 100 runners on base for you during a season, you will get no more than 40 RBI. If you get a hit 40% of the time and have 400 runners on base for you during a season, you could have 100 RBI. That’s a big difference even if you perform in the same way.
I’m not making the case here that RBI is completely meaningless and that hitting with runners on base is exactly the same as hitting with the bases empty, but simply that RBI as a counting stat is very misleading. Even if you think the best hitters are the guys who get timely hits and can turn it up in the clutch, you surely can appreciate that certain guys have different opportunities to drive in runs. RBI is very dependent on context and that means it’s not a very good way to measure individual players.
Allow me to demonstrate with a simple case study. Let’s start with comparing two seasons in which the following two players both played the same number of games.
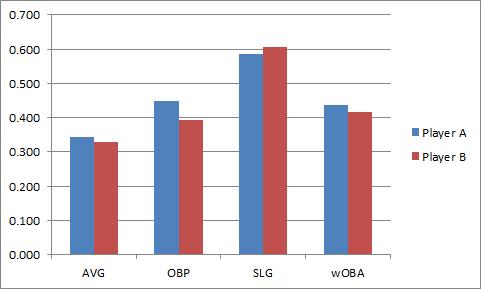
As you can see, Player A leads in average, OBP, and wOBA (what’s wOBA?) and is just a but behind in slugging. In wRC+, Player A leads 177 to 166 over Player B. If we take a look at BB% and K%, Player A looks much better.

All in all, Player A is the better player. We’ve looked at all of their rate stats and we’ve looked at wRC+ which controls for league average and park effect. It’s hard to argue that Player B is better. I couldn’t make a case to that effect.
Here’s the big reveal which some of you have probably figured out. Player A is Miguel Cabrera in 2011, Player B is Miguel Cabrera in 2012. This is the same player during two different seasons. In 2011, when Cabrera was clearly the better player, he had 105 RBI. In 2012, when he was worse, he drove in 139. Everything tells us he was better in 2011 except RBI. That should make use skeptical. It’s even more of a problem when you consider his situational hitting.
The graphs below are on identical scales:

Cabrera was better in 2011 in every situation and by each statistic except for his average (very close) and slugging percentage with no one on base. Which tells you nothing about how well he drives in runs. If you look at the HR distribution it tells you the same story.
| HRs | 2011 | 2012 |
| Bases Empty | 14 | 27 |
| Men on Base | 16 | 17 |
| Men in Scoring | 10 | 9 |
We can give him credit for those solo HR RBI from 2012, so let’s just lop 13 off the top. That still leaves 2012 Cabrera with 21 more RBI than 2011 Cabrera. Cabrera had a better season in 2011, but he had fewer RBI than in 2012. Most of this can simply be explained by the Tigers’ team OBP in the two seasons and where he hit in the lineup. If you subtract out Cabrera the Tigers got on base about 32% of the time in 2011 and 32.4% of the time in 2012 while Cabrera got to the plate a little less often because he hit 4th instead of 3rd. So there are more baserunners in general in 2012, but we can break this down even further.
In sum, Cabrera actually had more runners on base for him in 2011 than in 2012 but that doesn’t really tell the whole story. Let’s break it down by the number of baserunners on each base when he came to the plate:
| 2011 | 2012 | |
| Runner on 1B | 235 | 212 |
| Runner on 2B | 150 | 146 |
| Runner on 3B | 74 | 86 |
This should tell you the story even better. Cabrera had more baserunners in 2011, but the baserunners in 2012 were more heavily slanted toward scoring position. Cabrera had more runners closer to the plate so it’s easier to drive them in.
I intentionally chose Cabrera for this example because it strips away the idea that a given player just “has a knack” for driving in runs. Cabrera is an “RBI guy” if you subscribe to that idea. Miguel Cabrera had a better season in 2011 than 2012 when you break it down overall and in contextual situations. The only thing that helped 2012 Cabrera accumulate more RBI is that he had more runners on base closer to home when he got there. He played no role in getting those runners on base or closer to home, but he was able to more easily drive them and get credit in the RBI column. This is also isn’t as simple as converting RBI into a simple rate stat because where the baserunners are located and how many outs there are matter too, not just the number of situations.
This is the first step in a longer conversation but the takeaway point here is that RBI is stat that depends a lot on the team around you. Cabrera can’t control how many runners get on base and where they are on the bases when he comes to the plate. We shouldn’t judge a player for where he hits in the lineup and how the rest of the hitters on the team perform. It’s important to hit well with runners on base. I personally think we overvalue that skill over the ability to hit well in general, but I’ll leave that alone for now. Can we at least agree that a player who hits better with runners in scoring position and overall should be considered the better hitter? If that’s the case, then RBI is misleading you as an individual statistic. It’s that simple. I’m going to start laying out more evidence over the next couple weeks so stay tuned, but I’ll leave with this.
RBI is a descriptive statistic. It tells you who was at bat when a run scored and is critical to keeping track of a game in the box score. That’s why it was invented in the 1920s. You want to be able to scan a scorecard and recreate the game. RBI has a place in baseball, but only as a descriptive measure, not as a measure of value. Yet the RBI is still critical to MVP voting, arbitration salaries, and overall financial health of the players. They are judged by a statistic that doesn’t measure individual value and it is bad for their psyches. Players should focus on stats they can control and RBI isn’t one of those. It doesn’t measure individual value because as you can seen, in this very controlled example, RBI is misleading you.
