The Morning Edition (July 29, 2013)
over 
From Last Night:
- Fernandez goes 8, K’s 13, walks none to lead the Fish past Cole
- Ross narrowly out pitches Corbin to win in AZ
- Cingrani and Capuano pitch to a draw before Puig sends everybody home
- Wood shuts down the Giants, who waste a nice start from Lincecum
- Gordon’s 12th inning bomb lifts the Royals
- The Nats unload on the Mets, win 14-1
- Lester leads the Sox to a 5-0 win
- Toronto walks off on Houston
- Jeter homers in his return, Soriano leads the Yanks to victory
What I’m Watching Today:
- David Price tries to stay hot versus the Sox (6p Eastern)
- Weaver faces Garza (7p Eastern)
- Beachy makes his 2013 debut (7p Eastern)
- Jacob Turner goes against the Mets (7p Eastern)
The Big Question:
- Are the BioGenesis suspensions coming today?
Reports have the suspensions coming down this week, likely all at once. We’ll see which players are actually affected, which rumors were wrong, and which players have kept their names out of the press. The impact on the pennant race will be real, but likely not substantial because a given player can only have so much impacted over 55 games. Teams will scramble to find replacements, but the impact will be unpredictable. We’ve had months of speculation that was absolutely unnecessary, now we’re actually going to see something happen. Stay tuned.
How Was The Game? (July 28, 2013)
Another blowout.
Tigers 12. Phillies 4
Despite losing Miguel Cabrera and Jim Leyland to Chad Fairchild’s questionable sense of superiority, the Tigers had no trouble completing an impressive sweep of the Philadelphia Phillies. Rick Porcello (19 GS, 112.1 IP, 4.49 ERA, 3.51 FIP, 2.0 WAR) was solid, but hardly necessary, giving the Tigers 6 innings of 3 run baseball in which he struck out 3 and walked 2 (1 intentional). The Phillies scattered their runs, but the Tigers unloaded in big assaults. The Tigers got 3 in the 5th to tie it and 8 in the 6th on one of the worst defensive innings you’ll ever see from the Phillies. Peralta capped it off with a grand slam and the Tigers tacked on an extra run in the 7th for good measure. The win gives the Tigers three straight and 7 of 8 to move to 59-45 on the season. They will take Monday off in preparation for a two game set with the Nationals in which Anibal Sanchez (17 GS, 104 IP, 2.68 ERA, 2.39 FIP, 3.5 WAR) will start game one.
The Moment: Peralta caps an 8 run inning with a no doubt grand slam homerun.
SOEFA Sunday: Reliever Rankings Update (July 28, 2013)
You’ll recall earlier this year we introduced our very own reliever rankings called SOEFA, which you can read about in detail here. For a brief refresher, it combines strand rate, expected OBP against, ERA-, and FIP- into a deviation from league average. Zero is average, and will generally range between -2.5 to 2.5. This includes all pitchers who have thrown at least 20 IP in relief. Should you wish to know the SOEFA for any other reliever, or on a day that isn’t Sunday, hit us on Twitter or in the comments section.
| Rank | Player | Team | SOEFA |
| 1 | Alex Torres | Rays | 1.02 |
| 2 | Neal Cotts | Rangers | 1.00 |
| 3 | Drew Smyly | Tigers | 0.99 |
| 4 | Sergio Romo | Giants | 0.86 |
| 5 | Joaquin Benoit | Tigers | 0.84 |
| 6 | Greg Holland | Royals | 0.84 |
| 7 | Will Harris | Diamondbacks | 0.83 |
| 8 | Kenley Jansen | Dodgers | 0.79 |
| 9 | Mark Melancon | Pirates | 0.79 |
| 10 | Javier Lopez | Giants | 0.79 |
| 11 | Jesse Crain | White Sox | 0.78 |
| 12 | Juan Perez | Blue Jays | 0.77 |
| 13 | Casey Fien | Twins | 0.77 |
| 14 | Jordan Walden | Braves | 0.74 |
| 15 | Joe Thatcher | Padres | 0.73 |
| 16 | Sam LeCure | Reds | 0.72 |
| 17 | Koji Uehara | Red Sox | 0.72 |
| 18 | Jason Grilli | Pirates | 0.71 |
| 19 | Shawn Kelley | Yankees | 0.68 |
| 20 | Preston Claiborne | Yankees | 0.67 |
| 21 | Casey Janssen | Blue Jays | 0.67 |
| 22 | Edward Mujica | Cardinals | 0.66 |
| 23 | Craig Kimbrel | Braves | 0.65 |
| 24 | Glen Perkins | Twins | 0.63 |
| 25 | Sean Doolittle | Athletics | 0.62 |
| 26 | Manny Parra | Reds | 0.59 |
| 27 | Paco Rodriguez | Dodgers | 0.57 |
| 28 | Brandon Kintzler | Brewers | 0.55 |
| 29 | Oliver Perez | Mariners | 0.55 |
| 30 | Robbie Ross | Rangers | 0.55 |
| 31 | Seth Maness | Cardinals | 0.55 |
| 32 | Trevor Rosenthal | Cardinals | 0.54 |
| 33 | Andrew Bailey | Red Sox | 0.52 |
| 34 | David Aardsma | Mets | 0.52 |
| 35 | Chad Qualls | Marlins | 0.51 |
| 36 | Edgmer Escalona | Rockies | 0.51 |
| 37 | Matt Belisle | Rockies | 0.50 |
| 38 | Brian Matusz | Orioles | 0.49 |
| 39 | Brett Cecil | Blue Jays | 0.49 |
| 40 | Joel Peralta | Rays | 0.49 |
| 41 | Fernando Abad | Nationals | 0.49 |
| 42 | Antonio Bastardo | Phillies | 0.48 |
| 43 | Ryan Cook | Athletics | 0.48 |
| 44 | Andrew Miller | Red Sox | 0.48 |
| 45 | Boone Logan | Yankees | 0.48 |
| 46 | Luke Hochevar | Royals | 0.47 |
| 47 | Darren O’Day | Orioles | 0.47 |
| 48 | Tommy Hunter | Orioles | 0.46 |
| 49 | Aroldis Chapman | Reds | 0.45 |
| 50 | Bobby Parnell | Mets | 0.45 |
| 51 | Ross Ohlendorf | Nationals | 0.44 |
| 52 | Junichi Tazawa | Red Sox | 0.44 |
| 53 | Josh Collmenter | Diamondbacks | 0.43 |
| 54 | Tyler Clippard | Nationals | 0.43 |
| 55 | Jim Henderson | Brewers | 0.42 |
| 56 | Matt Reynolds | Diamondbacks | 0.42 |
| 57 | Jonathan Papelbon | Phillies | 0.42 |
| 58 | Dale Thayer | Padres | 0.42 |
| 59 | Chad Gaudin | Giants | 0.41 |
| 60 | Sandy Rosario | Giants | 0.40 |
| 61 | Dan Jennings | Marlins | 0.40 |
| 62 | Francisco Rodriguez | – – – | 0.40 |
| 63 | Addison Reed | White Sox | 0.39 |
| 64 | J.P. Howell | Dodgers | 0.39 |
| 65 | Brad Ziegler | Diamondbacks | 0.38 |
| 66 | Luis Avilan | Braves | 0.36 |
| 67 | Jason Frasor | Rangers | 0.36 |
| 68 | Vin Mazzaro | Pirates | 0.36 |
| 69 | David Carpenter | Braves | 0.34 |
| 70 | Tom Gorzelanny | Brewers | 0.34 |
| 71 | Jeanmar Gomez | Pirates | 0.34 |
| 72 | Kevin Gregg | Cubs | 0.33 |
| 73 | Cody Allen | Indians | 0.33 |
| 74 | Santiago Casilla | Giants | 0.32 |
| 75 | Randy Choate | Cardinals | 0.32 |
| 76 | Steve Cishek | Marlins | 0.30 |
| 77 | Tanner Scheppers | Rangers | 0.30 |
| 78 | Ernesto Frieri | Angels | 0.30 |
| 79 | Alfredo Simon | Reds | 0.30 |
| 80 | Scott Downs | Angels | 0.28 |
| 81 | James Russell | Cubs | 0.28 |
| 82 | Pat Neshek | Athletics | 0.27 |
| 83 | Michael Kohn | Angels | 0.27 |
| 84 | Jean Machi | Giants | 0.27 |
| 85 | Josh Outman | Rockies | 0.26 |
| 86 | Rafael Betancourt | Rockies | 0.26 |
| 87 | Aaron Loup | Blue Jays | 0.26 |
| 88 | Tony Watson | Pirates | 0.25 |
| 89 | Alfredo Figaro | Brewers | 0.25 |
| 90 | Jerome Williams | Angels | 0.25 |
| 91 | Jared Burton | Twins | 0.24 |
| 92 | Jose Veras | Astros | 0.24 |
| 93 | Steve Delabar | Blue Jays | 0.23 |
| 94 | Anthony Swarzak | Twins | 0.23 |
| 95 | Nate Jones | White Sox | 0.23 |
| 96 | Jim Johnson | Orioles | 0.23 |
| 97 | Jose Mijares | Giants | 0.23 |
| 98 | Fernando Rodney | Rays | 0.21 |
| 99 | Craig Breslow | Red Sox | 0.21 |
| 100 | Luke Gregerson | Padres | 0.21 |
| 101 | Justin Wilson | Pirates | 0.20 |
| 102 | David Robertson | Yankees | 0.20 |
| 103 | Rex Brothers | Rockies | 0.19 |
| 104 | Rafael Soriano | Nationals | 0.18 |
| 105 | Caleb Thielbar | Twins | 0.17 |
| 106 | Ross Wolf | Rangers | 0.16 |
| 107 | J.J. Hoover | Reds | 0.16 |
| 108 | Jamey Wright | Rays | 0.15 |
| 109 | Mariano Rivera | Yankees | 0.14 |
| 110 | Dane de la Rosa | Angels | 0.14 |
| 111 | Logan Ondrusek | Reds | 0.14 |
| 112 | Charlie Furbush | Mariners | 0.13 |
| 113 | Jesse Chavez | Athletics | 0.13 |
| 114 | Heath Bell | Diamondbacks | 0.12 |
| 115 | Kevin Jepsen | Angels | 0.11 |
| 116 | Bryan Morris | Pirates | 0.11 |
| 117 | A.J. Ramos | Marlins | 0.11 |
| 118 | Joe Nathan | Rangers | 0.09 |
| 119 | John Axford | Brewers | 0.09 |
| 120 | Anthony Varvaro | Braves | 0.08 |
| 121 | Burke Badenhop | Brewers | 0.07 |
| 122 | Tim Collins | Royals | 0.07 |
| 123 | Chris Perez | Indians | 0.06 |
| 124 | Joe Kelly | Cardinals | 0.06 |
| 125 | Aaron Crow | Royals | 0.05 |
| 126 | Tyson Ross | Padres | 0.04 |
| 127 | LaTroy Hawkins | Mets | 0.04 |
| 128 | Mike Dunn | Marlins | 0.04 |
| 129 | Cesar Ramos | Rays | 0.02 |
| 130 | Yoervis Medina | Mariners | 0.01 |
| 131 | Matt Lindstrom | White Sox | 0.01 |
| 132 | Ryan Pressly | Twins | 0.00 |
| 133 | Matt Thornton | – – – | -0.01 |
| 134 | Joe Smith | Indians | -0.01 |
| 135 | Adam Ottavino | Rockies | -0.02 |
| 136 | Bryan Shaw | Indians | -0.04 |
| 137 | Manuel Corpas | Rockies | -0.04 |
| 138 | Joe Ortiz | Rangers | -0.04 |
| 139 | Michael Bowden | Cubs | -0.05 |
| 140 | Carter Capps | Mariners | -0.05 |
| 141 | Wilton Lopez | Rockies | -0.05 |
| 142 | Jake McGee | Rays | -0.07 |
| 143 | Craig Stammen | Nationals | -0.08 |
| 144 | Brad Brach | Padres | -0.09 |
| 145 | Greg Burke | Mets | -0.09 |
| 146 | Darren Oliver | Blue Jays | -0.09 |
| 147 | Scott Rice | Mets | -0.09 |
| 148 | Ryan Webb | Marlins | -0.09 |
| 149 | Josh Edgin | Mets | -0.09 |
| 150 | Tony Sipp | Diamondbacks | -0.10 |
| 151 | Matt Guerrier | – – – | -0.11 |
| 152 | Troy Patton | Orioles | -0.11 |
| 153 | Darin Downs | Tigers | -0.11 |
| 154 | Joba Chamberlain | Yankees | -0.12 |
| 155 | Brian Duensing | Twins | -0.12 |
| 156 | J.J. Putz | Diamondbacks | -0.12 |
| 157 | Tim Stauffer | Padres | -0.13 |
| 158 | Blake Parker | Cubs | -0.14 |
| 159 | Brad Lincoln | Blue Jays | -0.15 |
| 160 | Luke Putkonen | Tigers | -0.17 |
| 161 | Tom Wilhelmsen | Mariners | -0.17 |
| 162 | Josh Roenicke | Twins | -0.19 |
| 163 | Cory Gearrin | Braves | -0.19 |
| 164 | Rich Hill | Indians | -0.20 |
| 165 | Nick Hagadone | Indians | -0.21 |
| 166 | Jerry Blevins | Athletics | -0.22 |
| 167 | Wesley Wright | Astros | -0.23 |
| 168 | David Hernandez | Diamondbacks | -0.23 |
| 169 | Ronald Belisario | Dodgers | -0.25 |
| 170 | Jonathan Broxton | Reds | -0.26 |
| 171 | Blake Beavan | Mariners | -0.27 |
| 172 | Phil Coke | Tigers | -0.28 |
| 173 | Michael Gonzalez | Brewers | -0.28 |
| 174 | Vinnie Pestano | Indians | -0.28 |
| 175 | Danny Farquhar | Mariners | -0.29 |
| 176 | Garrett Richards | Angels | -0.30 |
| 177 | Jose Cisnero | Astros | -0.32 |
| 178 | Pedro Strop | – – – | -0.34 |
| 179 | George Kontos | Giants | -0.35 |
| 180 | Drew Storen | Nationals | -0.36 |
| 181 | T.J. McFarland | Orioles | -0.36 |
| 182 | Grant Balfour | Athletics | -0.36 |
| 183 | Paul Clemens | Astros | -0.37 |
| 184 | Kyle Farnsworth | Rays | -0.37 |
| 185 | Matt Albers | Indians | -0.39 |
| 186 | Mike Adams | Phillies | -0.40 |
| 187 | Huston Street | Padres | -0.40 |
| 188 | Kelvin Herrera | Royals | -0.40 |
| 189 | Clayton Mortensen | Red Sox | -0.41 |
| 190 | Travis Blackley | Astros | -0.42 |
| 191 | Scott Atchison | Mets | -0.43 |
| 192 | Alex Wilson | Red Sox | -0.44 |
| 193 | Al Alburquerque | Tigers | -0.47 |
| 194 | Brandon Lyon | Mets | -0.48 |
| 195 | Esmil Rogers | Blue Jays | -0.49 |
| 196 | Justin De Fratus | Phillies | -0.52 |
| 197 | Bruce Chen | Royals | -0.54 |
| 198 | Jeremy Horst | Phillies | -0.59 |
| 199 | Raul Valdes | Phillies | -0.62 |
| 200 | Hector Ambriz | Astros | -0.62 |
| 201 | Jeremy Affeldt | Giants | -0.64 |
| 202 | Adam Warren | Yankees | -0.67 |
| 203 | Henry Rodriguez | – – – | -0.70 |
| 204 | Michael Kirkman | Rangers | -0.73 |
| 205 | Carlos Marmol | – – – | -0.86 |
| 206 | Anthony Bass | Padres | -0.91 |
| 207 | Shawn Camp | Cubs | -1.02 |
| 208 | Hector Rondon | Cubs | -1.05 |
| 209 | Brandon League | Dodgers | -1.12 |
The Morning Edition (July 28, 2013)
From Last Night:
- Sale goes the distances, allows 1 R, and loses to the Royals (#KillTheWin) as Davis, Coleman, and Holland blank the Sox
- Bourn hits a leadoff HR against Darvish, no one else scores as Masterson out duels Yu
- Nova goes 7, gives up 1 R, but Archer outshines with a CGSO
- The Braves win a close one against the Cards with 2 in the 8th
- 3 Nats HR back Haren over the Mets
What I’m Watching Today:
- Rays try to stay hot behind Moore (1p Eastern)
- Cole and Fernandez hook up in Miami (1p Eastern)
- Corbin welcomes the Padres to Chase (4p Eastern)
- Miller and Medlen on ESPN (8p Eastern)
The Big Question:
- Are there going to be any deadline deals?
Despite what Heyman, Rosenthal, Olney, and Morosi are telling you there doesn’t seem to be any traffic on the trade market. We’ve had some low profile deals including Feldman and Nolasco and the Cubs did move Garza, but it doesn’t look like a flurry of deals are coming because the teams that are due to sell aren’t budging. The Jays, Royals, Phils, Angels, and Mariners are out of it but not ready to commit. Once that happens we could have some deals, but the second wild card is keeping a lot of teams in it. Peavy’s probably going to move, but now that we’re five days from the deadline I’m actually willing to talk about trades. Trade speculation is boring, but real trades are interesting and if we’re going to get a few, they’ll be coming soon. It’s important to remember that trades can only have a small impact on a team’s chances because there are only 50-55 games left after the deadline comes. You have to replace a terrible player with a great one to gain more than a win or two.
How Was The Game? (July 27, 2013)
A good old fashioned laugher.
Tigers 10, Phillies 0
Despite the 40 minute rain delay, the Tigers didn’t have any trouble getting off to a good start on Saturday as they annihilated the Phillies without much trouble. Max Scherzer (21 GS, 143.2 IP, 3.01 ERA, 2.72 FIP, 4.3 WAR) put the Phillies away easily in the 1st and allowed just one baserunner across his 6 innings of work to go with 7 strikeouts. Leyland pulled him after just 75 pitches to save some bullets because the Tigers offense unloaded early and often. They got 5 runs in the first on a Cabrera HR, Peralta single, and Tuiasosopo HR to the shrubs in dead center. They added 3 in the 2nd, and single runs in the 4th and 5th to run the score up to 10-0 before the Phillies knew what hit them and every Tigers starter had reached base at least once before the night was over. The Tigers went to Alburquerque for 2 innings and Reed for one to finish out the ballgame and coast to their 58th win. They’ll turn around and go for the sweep on Sunday behind Rick Porcello (18 GS, 106.1 IP, 4.49 ERA, 3.55 FIP, 1.9 WAR) who looks to keep his strong season going.
The Moment: Tuiasosopo crushes a 3 run HR to dead center to put this one away early.
Getting Ahead with Wainwright and Moore
 If you’re interested in non-Tigers analysis, I’ve got a post up in the Community Research section at FanGraphs comparing the seasons of Adam Wainwright and Matt Moore so far in 2013 focusing on the nearly identical rate with which their pitches hit the strikezone despite their wildly different walk rates. If you’re interesting in pitching, and especially the strategy involved, I hope you’ll check it out. Plenty of New English D style graphics, too.
The Nine Worst One Inning Saves in MLB History
At New English D we’re very critical of the save statistic because not only does it not reflect actual performance, but it has also affected the way managers actually use their bullpens. Managers chase saves which results in using their best relievers in the wrong situations. I won’t rehash the problems, but you can check out the whole rationale in the bullpen section of our Stat Primer page.
What I’d like to do is identify the The Nine Worst One Inning Saves in MLB History. Below you’ll find a list of the most ridiculous appearances in which a reliever was credited with a “save.” The argument here is that a three up three down inning with 3 strikeouts results in a save and is valued identically to these appearances in the save column.
In order to gather this list, I sorted every save since the stat became official in the late ’60s by the number of baserunners allowed after deleting runners who reached via errors. After that I sorted by walks and dropped out anyone who induced a double play in order to leave me with nine. From there, I broke any ties by sorting by the number of times each pitcher missed the strike zone. The only reason I was hunting for nine is because this is part of our The Nine series. A list of 11 or 13 would make the same point. I was just trying to find the absolute worst 1 inning saves in history. Let’s do it. Each of these appearances are 1 inning saves with 5 total baserunners:
| Rank | Player | Date | Tm | H | ER | BB | SO |
| 9 | Billy Koch | 9/27/2002 | OAK | 3 | 2 | 2 | 0 |
| 8 | Todd Jones | 5/19/2007 | DET | 3 | 2 | 2 | 0 |
| 7 | Bobby Jenks | 9/29/2006 | CHW | 3 | 2 | 2 | 3 |
| 6 | Trevor Hoffman | 4/3/2002 | SDP | 3 | 2 | 2 | 1 |
| 5 | Bryan Harvey | 6/25/1989 | CAL | 3 | 2 | 2 | 3 |
| 4 | Brad Lidge | 7/26/2010 | PHI | 3 | 2 | 2 | 0 |
| 3 | Jeff Brantley | 5/21/2000 | PHI | 2 | 2 | 3 | 0 |
| 2 | Joel Hanrahan | 9/15/2012 | PIT | 2 | 2 | 3 | 1 |
| 1 | Sergio Santos | 9/26/2011 | CHW | 2 | 2 | 3 | 3 |
You’ll notice most of these are quite recent. Managers didn’t used to only call on pitchers for one inning saves and they used to pull relievers who pitched terribly before things got this bad. All of these pitchers earned a save for these performances. If you can get a save for pitching like this, how much is a save really worth?
The Morning Edition (July 27, 2013)
From Last Night:
- Tribe blows a big lead, but Ryan Raburn walks off to save them in the 11th
- Minor out pitches Wainwright in a 4-1 win for the Braves
- Rays shell CC, move into first place
- The Royals finally cash in on a great start for Shields, beat the Sox
- Huge 7th inning bails out Dickey in Toronto
- Mets dominate the Nats in game one, but waster Harvey’s gem in game two as Zimmerman walks off
- Chatwood strikes out 11 Brewers
What I’m Watching Today:
- Darvish faces Masterson in Cleveland (7p Eastern)
- Chris Sale faces the Royals (7p Eastern)
- Bumgarner welcomes the Cubs to AT&T (10p Eastern)
The Big Question:
- How do you feel about Ryan Raburn?
Raburn hit a big 3 run walk off homerun on Friday, improving his season numbers to .273/.371/.533, good for a 153 wRC+ in 186 PA. He is now the Indians second best position player with 2.0 WAR which ties his career high for an entire season. I’ve always loved Raburn because he has the biggest range of possible outcomes of any human being I’ve ever seen. It’s equally likely that he hits 3 HR in a game as it is that he falls down the dugout steps and injures Jason Kipnis. He hits huge homeruns and makes the more untimely mistakes. There’s something quite compelling about that in my book. He’s also playing above average defense and walking 11.8% of the time. This guy.
How Was The Game? (July 26, 2013)
A thing of beauty.
Tigers 2, Phillies 1
In life, it’s so rare that something lives up to the hype but I’m confident in saying this duel between Cole Hamels and Doug Fister (21 GS, 135 IP, 3.67 ERA, 3.31 FIP, 2.9 WAR) did. Hamels’ only blemish was a 2 run double he allowed to Avila in the 5th and Fister allowed just a single unearned run in the 3rd. Fister gave the Tigers a brilliant effort, going 8 innings and allowing just 3 hits and 1 walk to go with his 6 strikeouts. It was everything a great Fister start should be. He was efficient, he got ground balls, and he made hitters look silly with tons of movement on the fastball and a curve about which you could write poetry. After today’s start, Fister is now 3rd in MLB in ground ball percentage and 7th in the league in walk percentage. Both teams also treated us to some great defense to put the cherry on top of the sundae that was this game, including some solid work by Santiago and a doozy of a grab by Nix in RF for the Phils. The win pushes the Tigers to 57-45 and they will avoid Cliff Lee on Saturday due to an injury. The Tigers will send Max Scherzer (20 GS, 137.2 IP, 3.14 ERA, 2.81 FIP, 4.0 WAR) to the mound to face his replacement.
The Moment: Fister gets a standing ovation after retiring 13 of the final 14 batters he faced.
Prince Fielder’s Missing Value

Prince Fielder isn’t having a bad season, he just isn’t having a great one. He’s been worth just 1.0 wins above replacement (what’s WAR?) in 101 games despite being worth close to 5 WAR in each of the last two seasons. The defensive and baserunning metrics always put Fielder clearly below average, costing his team 1-2 wins per season on average, but they are not currently out of line with his career numbers. Fielder’s missing value is entirely on the offensive side of things.
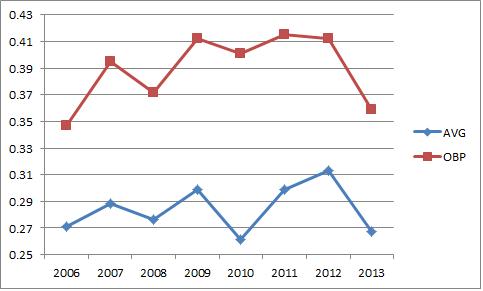
Again, this is not to say Fielder has been bad, but rather that he hasn’t been a great hitter like he normally is. These kind of seasons have happened before for Fielder. Let’s take a look at his single season wRC+ (what’s wRC+?) over his career. This is simply an offensive rate stat that measures how he compares to league average, which is set to 100.

You can see he has had down seasons in his career. In his first full season he was only at 110. In 2008 it was 125 and in 2010 it was just 136. None of those are bad numbers, but they aren’t like the 4 seasons of better than 50% better than league average that he put up in 2007, 2009, 2011, and 2012. This year he’s all the way down at 122. He’s just 22% better than the league average hitter this season when we expected to see him around 40% better. What’s going on?
Well he’s walking less and striking out more than last season, but he’s still significantly above average in both departments. He’s also been successful when he’s had a higher K%. I’m not saying these aren’t factors, but I don’t think they are the main factors. I think it’s more about the at bats in which he makes contact.
You’ll notice his overall production dips in conjunction with lower batting average and OBP, obviously, but you’ll notice the 2011 and 2012 average spike wasn’t met with an OBP spike. He traded walks for hits. This year he’s essentially walking at the same rate but isn’t getting the hits. It’s as if he changed his approach in the last few years to be more of a contact hitter, and this year the contact isn’t paying off:
You can see the contact spike very clearly in the following graph:

2011 and 2012 look like the anomalies. He saw a huge spike in his contact rate, which helped elevate the batting average. He wasn’t hitting for as much power, but plate appearance that used to be walks were now hits, which helped his offensive value because they occasionally went for extra bases as well. Let’s take a look at BB, 1B, 2B, and HR (PA numbers are all very close):
| Season | 1B | 2B | BB | HR |
| 2006 | 90 | 35 | 59 | 28 |
| 2007 | 78 | 35 | 90 | 50 |
| 2008 | 96 | 30 | 84 | 34 |
| 2009 | 93 | 35 | 110 | 46 |
| 2010 | 94 | 25 | 114 | 32 |
| 2011 | 95 | 36 | 107 | 38 |
| 2012 | 118 | 33 | 85 | 30 |
| 2013 | 66 | 21 | 52 | 17 |
He’s always had a very consistent number of singles until 2012 when that number spiked. In 2010, he walked a lot but it cost him his extra base power. 2011 was essentially the best of everything. Lots of singles, career higher 2B, 107 BB, and 38 HR. He parlayed that into a nice contract, actually. In 2012, he hit fewer homers and doubles and walked less, but had a ton more singles to make up for it. Instead of a high walking slugger, he was a solid walking well balanced hitter.
You can see in 2013 that the HR, BB, and 2B pace is down only slightly from last season. The difference between Fielder in 2012 (when he was great) and Fielder in 2013 (when he is just pretty good) is that what used to be singles are now outs. Some of that is a tick up in K% and a decrease in contact% but some of it is about batted balls.
If we look at his BABIP (what’s BABIP?) we can see that the years in which he “struggles” are the years in which he has a low batting average on balls in play.
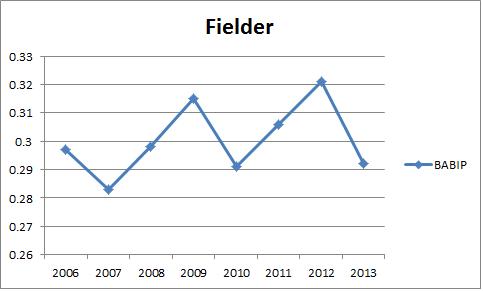
Notice first that 2007 doesn’t seem to fit the patter because he was great but has a low BABIP – but remember that he hit 50 HR that season, which aren’t in play. If we bounce 2007 up and say he had a low BABIP for a positive reason, we can see that the down years of his career are the ones with the lower BABIP.
Low BABIP can be about a hitter’s skill, approach, or quality of contact, but it can also be about luck and the quality of the other defense. Let’s see if their is a Fielder explanation in his batted ball data:

What we can see is that Fielder has been trending toward more line drives lately at the expense of fly balls, which makes perfect sense with our theory that he’s trading big power for more contact and singles. But you’ll also notice that his line drive percentage this year is actually better than his very good 2011 season. He’s also hitting a lot more fly balls this year that he did in the last two seasons, but he has previously been successful hitting that many fly balls. Fielder’s approach is definitely different that in used to be in this respect, but it doesn’t appear to be detrimentally different.
He’s hitting more balls in the air, but they aren’t leaving the park like they should. He is HR/FB%:
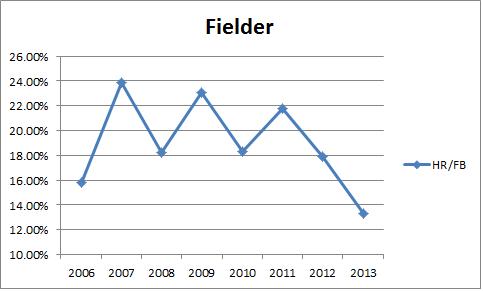
You’ll notice that it has fluctuated in his career, as we would expect given the fluky nature of HR/FB%, but his number in 2013 is noticeably lower than the typical fluctuation. In his best years he’s hitting 22% or better, but in his down years we expect it around 18%. Let’s imagine a scenario in which Fielder’s HR/FB% was 18% this season. That would be 23 HR instead of 17. Five additional homeruns is a meaningful difference.
His current 2013 wOBA (what’s wOBA?) is .352, which is good but not amazing. If we trade 5 outs for HR, what happens? It goes up to .377. That’s not in line with his great seasons, but it’s much better. That calculates out to a wRAA (what’s wRAA?) of 22.5, which is good for about 2.4 WAR offensively. He’s currently offering an offensive WAR of around 1.3. These 5 HR account for an entire win above replacement in value and something like 1.6 WAR extrapolated out over an entire season. He’s a 3.9 WAR offensive player if he hits exactly like this the rest of the season if he bring his HR/FB% in line with his previous lows. That’s much better. His defense and running will still cost him 1-2 wins before he positional and replacement level adjustment.
So we have to ask ourselves if the HR/FB rate is Fielder’s fault or just bad luck? And also, if he’s generally been unlucky on balls in play turning into outs. If it’s just bad luck, we don’t have to worry and we can easily expect him to regress to the mean and play better the rest of the way.
If we take a look at this Hard Hit Average leaderboard, Prince Fielder still ranks extremely well (H/T Mark Simon and ESPN Stats and Info):

If you can’t read it, he’s 14th in baseball with a hard hit average better than guys like Chris Davis, David Wright, and Paul Goldschmidt. It seems like he’s making hard contact at a high rate, but he’s simply not getting those balls to drop. The same thing happened to Victor Martinez earlier this season and everything corrected itself for him. If we believe that hard hit balls are predictive of good performance, and I do, then it looks like Fielder is just getting unlucky and everything should be fine. His hard hit average is down this year, but it’s still way above the MLB average of .170. When you hit the ball hard this often, the results are usually very good.
| Hard Hit Average | |
| 2010 | 0.244 |
| 2011 | 0.290 |
| 2012 | 0.269 |
| 2013 | 0.234 |
He’s getting fewer hits on balls in play, but he’s not hitting the ball weakly, he’s hitting it in the wrong place. Combine that with a fluky low HR/FB% and you can wash away Fielder’s offensive problems. The results matter for the team, but there doesn’t appear to be anything wrong with the process. And process is more predictive than results going forward and going forward is what we care about. Even if he’s lost a touch of power behind his swing, it’s still going to produce results better than this going forward.
Prince Fielder is having a down season in the second season of a huge contract, but it doesn’t look like this is the sign of an early decline. It’s mostly just some bad luck, and luck often turns.
