Why OBP Should Be Your New Batting Average

Part of my ethos as an educator is to take nothing for granted. Don’t assume your student knows something just because you know it. I want to bring a little more of that to baseball, especially when discussing modern statistics. One of the most basic sabermetric ideas is that On-Base Percentage (OBP) is a better way to measure players than batting average (AVG). This is something a lot of people understand, but not everyone does. That’s okay, I’d like to explain why you should use OBP instead of AVG when evaluating players and I’ll even teach you a trick to make it easier.
OBP = (H+BB+HBP)/(AB+BB+HBP+SF)
Let’s use 2012 David Wright as our example. Wright had a .306 AVG in 2012 as he got 178 hits in 581 AB. Batting average tells you the rate at which a player gets a hit in trips to the plate in which they don’t walk, get hit, or sacrifice. That’s useful information, but it is incomplete information. If you want to look at batting average to compliment OBP, that’s great, but don’t look at just AVG. Here’s why.
In this is example, you’ve ignore the times Wright reached base via a walk or hit by pitch. You’ve essentially removed that part of his value from the stat at which you’re looking. David Wright got on base 84 more times in 2012 that you wouldn’t know about if you only look at batting average. You’re right that a walk isn’t quite as good as a hit, but it is much, much better than an out. Walking puts you on base for someone else to move you over and in and getting on base correlates much more closely with runs scored than batting average.
To be specific, a walk is about 78% as good as a single. It’s perfectly reasonable to prefer a hit to a walk, but a walk is much better than an out and if you’re going to use a basic rate statistic, use a stat that includes walks. If you’re more ambitious, Weighted On Base Average (wOBA) actually weighs each outcome relative to its value, but let’s keep it simple and use OBP.
The point is simple. David Wright’s AVG is .306, but his OBP was .391. He was 17th in AVG, but 8th in OBP. If you ignore walks, you’re missing out on a big part of a player’s offensive game. You’re underrating him because you’re not considering how often he gets on base. If you want everything to count the same, OBP is the stat for you. If you’re looking for something even better, try wOBA. Don’t use batting average because it simply ignores and important part of baseball.
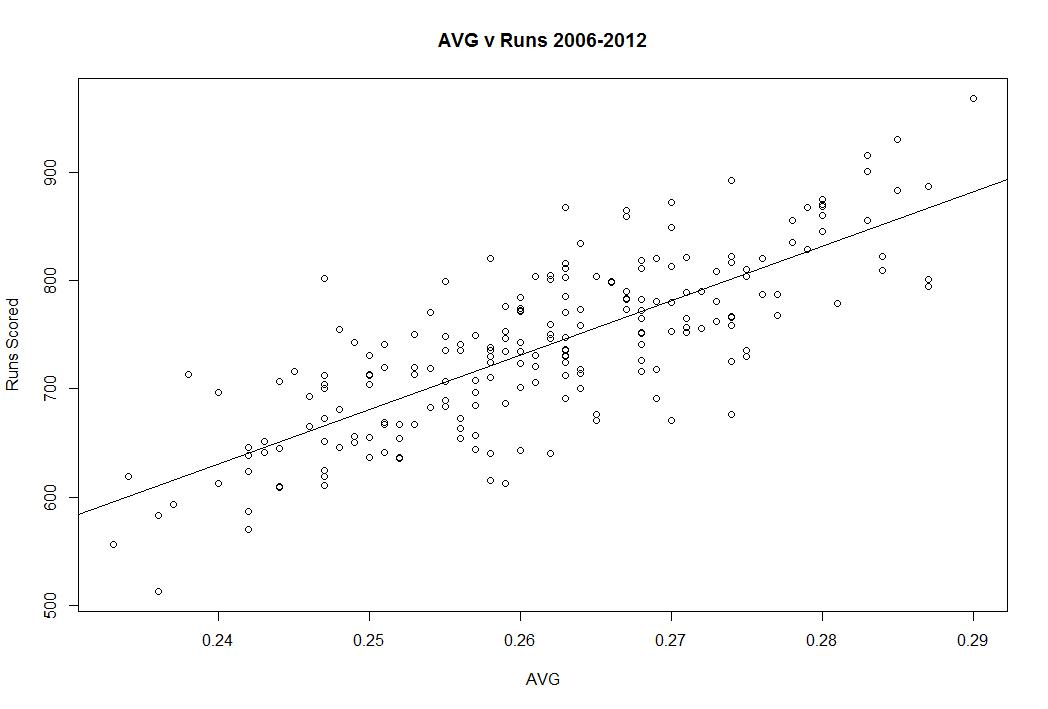
Let’s do something very simple to understand the power of OBP vs AVG. I took each team’s seasons from 2006-2012 and compared their runs scored to AVG and OBP. The correlation is much stronger for OBP than AVG. For batting average the adjusted R squared is .612. For OBP, it’s .7738. In other words, you can explain 61% of the variation in runs scored with batting average and 77% of the variation in runs scored with OBP. OBP is more highly correlated with scoring runs than batting average. Why wouldn’t you want to look at stats that better predict scoring? Here it is in graphical form (the vertical axes are the same):

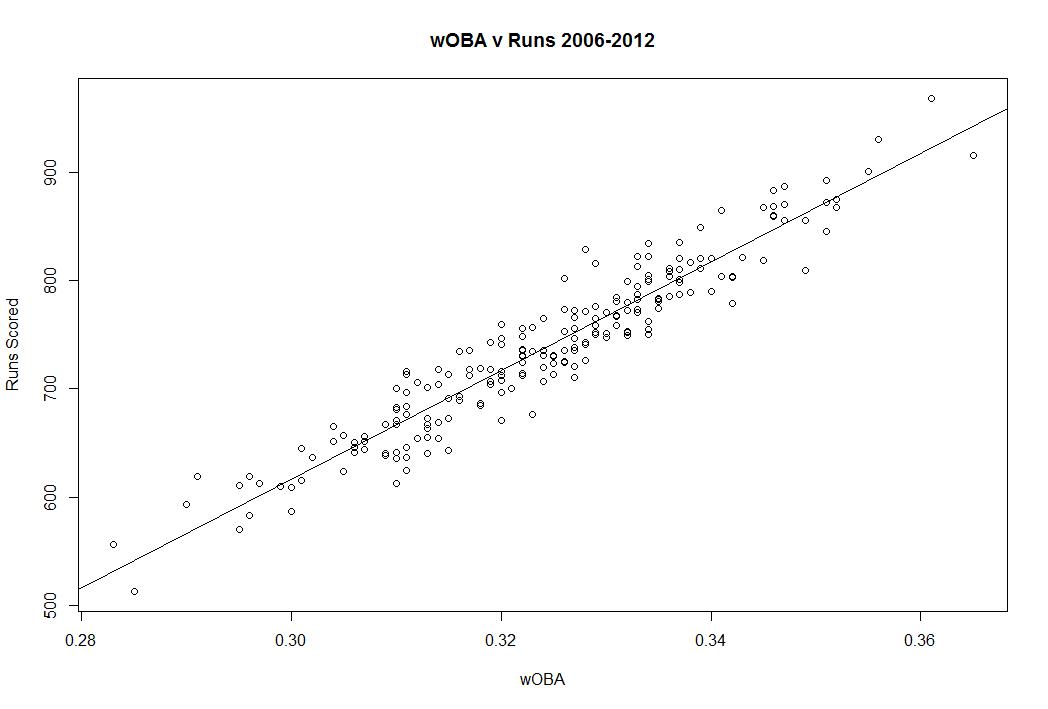
If you’re interested in going further, take a look at wOBA, because wOBA’s adjusted R squared is .9077, which is a lot better. wOBA tells you more about runs scoring than AVG and even more than OBP. Here it is in graphical form:
I think one reason people are resistant to OBP is because batting average is imprinted on the DNA of the game. We know that .300 is a good average and that .400 is iconic. You have a really good idea what each batting average means, but to use OBP you have to learn how to properly adjust your expectations. .300 is a good average, but you don’t really know what the equivalent OBP is. I’m going to help with a simple rule.
The 60 Rule. That’s it. Take a player’s OBP and subtract .060 from it to get it on the batting average scale. The average OBP is about 60 points higher and the standard deviations are similar. This rule won’t be perfect if you’re statistically savvy, but it will allow you to easily interpret OBP.
If a player has a .390 OBP, just drop 60 points and that is essentially as good as a player who hits .330 using batting average. So David Wright’s average last year was .306, but in reality, he was better than that because of his above average walk rate. He’s more like a .330 hitter than a .300 hitter when you factor in the walks if you choose to think in terms of the batting average scale you learned growing up.
If you’re interested in new stats, we have plenty of info in our Stat Primer page, but the key takeaway here is that little steps are important. OBP is telling you exactly what you think batting average should. It’s telling you how often someone gets on base, while batting average tells you how often they get on base when they get a hit in trips to the plate in which they didn’t walk. Which one makes more sense when you put it like that?
Take a look at OBP next time you scan the stats. It’ll help you understand the game a lot better. Ask questions and be curious. If you don’t agree with a statistic, ask yourself why. Think critically. Look at every stat, but OBP is where you should look if you’re interested in the concept batting average is going after.
The Morning Edition (July 23, 2013)
From Last Night:
- MLB suspends Ryan Braun for the remainder of the season
- Rangers acquire Garza from the Cubs
- Matt Moore gets the CGSO as the Rays beat the Sox, move to 18-2 in their last 20
- Feldman’s solid start lifts the O’s over the Royals
- Gee flirts with a no-no, but the Braves take the game in the 9th
- Grilli hurt in win over the Nats
What I’m Watching Today:
- Jarrod Parker and Jarred Cosart pitch in Houston (8p Eastern)
- Miller pitches against the Phils (8p Eastern)
- Jose Fernandez heads to Coors (830p Eastern)
- Corbin gets the Cubs (930p Eastern)
The Big Question:
- Thoughts on the Braun suspension?
Obviously the Braun news populated the headlines on Monday, and I have a lot of disjointed reactions I’d like to share. Recognize that these don’t all go together or in order:
- I want MLB or MLBPA to lay out the evidence they have against him. I understand Braun accepted the punishment, which is a partial admission of wrongdoing, but the info that has been made public is not grounds for punishment. I want to know what it is they have on him before I make my final judgments about a person’s character. I see no reason to rush to judgment.
- Braun broke the rules, it appears, and lied about it boldly. That was wrong, but let’s not act like this is such a terrible thing. He should be punished, but this is a sport that has no punishment for dangerous felonies like DUIs. Braun behaved badly, but this isn’t the worst thing an MLB player has done in the last two seasons. Perspective would be nice.
- Also, most people break rules to get advantages in life. Braun is to blame and deserves punishment, but you’re not perfect either.
- Braun being linked to BioGen doesn’t mean the failed test in 2011 was legitimate. The two may not be related. Again, I want to see some evidence. If they are related, my reaction will be different. Evidence is important, speculation is not.
- People are going to town on Braun for tearing down the “sample transporter” person from 2011 and think he should apologize. That person didn’t do his job correctly, even if Braun was dirty. Braun’s guilt doesn’t make up for that guy’s failure. Braun might not have been nice to him, but Braun’s career was at stake. You might have done the same.
- Finally, imagine how you would feel if it was you or a close family member. I’m not asking you to feel sorry for him, but I am asking you to temper your reaction accordingly. He’s a public figure and there are no consequences for anything you say behind a keyboard, so you probably feel okay spewing vitriol. But seriously, this is a person who made a bad choice. He didn’t kill anyone, he didn’t endanger others. The reaction to Braun is not properly weighted to the severity of the offense.
- If he’s guilty, he should be punished. But that’s it. The focus should be on the field, not on the people who made choices to take themselves off of it. Instead of vilifying Braun, why don’t you celebrate the ones left in the game.
The Nine Best Seasons Under 70 RBI
By now I’m sure you’ve seen our series explaining why RBI is not a good statistic for measuring individual value. The reasons are simple. RBI is simply too dependent on the quality of the team around you to be a good measure of individual value because the number of baserunners, location of baserunners, and number of outs are outside of a player’s control. To catch you up, we’ve already seen:
- How RBI can mislead you when comparing two players
- How you can have a lot of RBI during a bad season
- And how RBI don’t even out over the course of a career
Now, let’s turn the question on its head. Below you’ll find the best seasons since 1920 (when RBI became an official stat) in which a player had fewer than 70 RBI while also having 600 or more plate appearances. In other words, these are players who had a full season of at bats, played great, and didn’t have many RBI. The ranking uses wRC+ (what’s wRC+?) which is an offensive rate statistic that compares a player to league average and park, meaning that you can use it to compare across eras. 100 is average and every number above or below is a percent better or worse than league average.
| Rank | Season | Name | Team | PA | RBI | AVG | OBP | SLG | wRC+ |
| 9 | 1938 | Arky Vaughan | Pirates | 650 | 68 | 0.322 | 0.433 | 0.444 | 150 |
| 8 | 1993 | Rickey Henderson | – – – | 610 | 59 | 0.289 | 0.432 | 0.474 | 151 |
| 7 | 1968 | Pete Rose | Reds | 692 | 49 | 0.335 | 0.391 | 0.470 | 151 |
| 6 | 1975 | Ken Singleton | Orioles | 714 | 55 | 0.300 | 0.415 | 0.454 | 152 |
| 5 | 1987 | Tony Gwynn | Padres | 680 | 54 | 0.370 | 0.447 | 0.511 | 153 |
| 4 | 1974 | Rod Carew | Twins | 690 | 55 | 0.364 | 0.433 | 0.446 | 153 |
| 3 | 1968 | Jimmy Wynn | Astros | 646 | 67 | 0.269 | 0.376 | 0.474 | 159 |
| 2 | 1974 | Joe Morgan | Reds | 641 | 67 | 0.293 | 0.427 | 0.494 | 162 |
| 1 | 1988 | Wade Boggs | Red Sox | 719 | 58 | 0.366 | 0.476 | 0.490 | 167 |
What you can see from this list is that these are excellent seasons and none of them gathered more than 68 RBI. Let’s put this in the modern context. In 2012, only 8 players had a wRC+ of 150 or better. Cano, Encarnacion, Fielder, McCutchen, Braun, Posey, Cabrera, and Trout. On the other hand, 80 players had 70 or more RBI in 2012. Among them were Alexei Ramirez who had 73 RBI and a 71 wRC+ and Delmon Young who had 74 RBI and a 89 wRC+.
Usually big RBI numbers and high wRC+ go hand in hand, but there is a lot of variation that obscures the results. Good hitters usually have a lot of RBI, but not always. You’ve seen it in our previous posts on the subject and now you can see that great seasons don’t guarantee you anything in terms of RBI.
RBI isn’t the worst statistic in the world, but it just isn’t a good way to measure individual value when you consider how some players can have 100 RBI in a year and be 25% below average and some can have fewer than 70 RBI and be 50% better than league average. These numbers don’t even out over an entire career and you can’t use RBI to compare two players.
There isn’t a lot RBI can tell you about individual players. You can be good and not have them, you can be bad and have them, and this isn’t about small samples. RBI describe what happened on the field, but they are a blunt and unhelpful tool in measuring individuals. It’s time to move forward and stat lining up our valuations with better measures like wOBA, wRC+, and wRAA. If you use RBI to measure players, you going to end up thinking Ruben Sierra’s 1993 season in which he had 101 RBI is better than Rickey Henderson’s 1993 in which he had 59 RBI when in reality Sierra was 20% below average and Henderson was 50% below average. That’s way too big a mistake to make when there are much better alternatives.
Revisiting The Nine Best Shortstops for 2013
In the weeks leading up to the 2013 season, I unveiled my predictions for The Nine best players at each position. Some of the lists look good, some look terrible at this point, but that’s all part of the fun. Over the next few weeks I will be revisiting these lists to see how things are going so far, around the halfway mark.
Obviously, the early evaluations will feature fewer than half a season and the later lists will feature a bit more, but try to think of these as the state of the position at the halfway mark. I’ll be using Wins Above Replacement (WAR) to generate the rankings because it is the number that best captures the entire value of a player. It isn’t perfect, so don’t take the precise values too seriously, but it’s certainly the best way to make any type of holistic list. WAR values offense, defense, baserunning, and playing time, so it represents exactly what I was trying to capture when I made the rankings during Spring Training.
Here’s how this will work. Below, you’ll see all nine players I ranked in the preseason and any player who currently ranks in the top 9 at that position. The current ranking drives the order and the preseason ranking and their current WAR is noted. Hit, miss, and push distinctions are based on where their first half places them going forward. For example, I can miss on a player even if I expect them to play much better in the second half if their first half was so poor that it is impossible to make up the ground overall.
We’ve already covered the catchers, first basemen, and second basemen so let’s move on to first base. Here’s The Nine Best Shortstops for 2013. Numbers are as of the July 22.
35. Derek Jeter, Yankees (Preseason Rank: 8, 2013 WAR: 0.0)
When I wrote the list, the word on Jeter was that he’s going to be ready early in the season and that obviously didn’t reflect reality. I absorb some of the blame for not being more cautious on Jeter, but I also can’t do much more than trust a basic medical timetable. He’s played 0 games at SS this year and only one game at DH. MISS
22. Alcides Escobar, Royals (Preseason Rank: 9, 2013 WAR: 0.7)
Escobar was trending up offensively over the last few seasons but has been absolutely awful at the plate this season, posting a 59 wRC+ (what’s wRC+?). Escobar has done a nice job adding value on the bases and on defense so this pick wasn’t a massive whiff, but the previous gains at the plate have gone missing. MISS
21. Elvis Andrus, Rangers (Preseason Rank: 2, 2013 WAR: 0.7)
The Andrus story matches the Escobar one. He’s been a very solid offensive player over his first few seasons but has looked terrible to date in 2013 at the dish. He’s still adding tons of value on the field and on the bases, but at the dish he’s at 58 wRC+. Coming off a big contract it makes you sweat if you’re a Rangers fan because Andrus doesn’t need to be great to earn the deal, but he can’t be this bad.
18. Jimmy Rollins, Phillies (Preseason Rank: 6, 2013 WAR: 0.9)
Rollins is only a little off the pace I pegged him for at #6, but he’s not putting up the offensive numbers he needs to this season. Right now he’s playing like an average shortstop instead of an above average one and it’s to blame for his stop on this list. He’s getting older, but I bet he’s got another nice run in there somewhere. MISS
17. Jose Reyes, Jays (Preseason Rank: 3, 2013 WAR: 1.0)
Reyes is having a top 3 season right now when he’s on the field, but of course, he’s missed time with an injury. I gambled on health with my ranking, but he’s be matching it if he didn’t get hurt so I don’t feel too bad about the performance half of my judgement. I’m holding off on judgement because he could easily run off an amazing second half and get close to the top of the list. PUSH
10. JJ Hardy, Orioles (Preseason Rank: 5, 2013 WAR: 1.7)
The Hardy ranking is a little off mostly because of the other guys on the list. He’s having the season I’d have pegged him for, low OBP, nice pop, solid defense. The reason he’s at 10 instead of 5 is because I whiffed on a lot of guys ahead of him. I’m calling this a push for now, but it’s probably going to end up as a miss. PUSH
9. Alexei Ramirez, White Sox (Preseason Rank: N/A, 2013 WAR: 1.9)
Ramirez is getting much of his value from great defense and solid baserunning but he’s doing well enough at the dish (79 wRC+) to add some value at the plate given his position. He has no pop and no eye at the plate, but for now his BABIP is high enough that it is carrying him to a solid batting average. I don’t think this ranking sticks and he was just off my original list. HIT
8. Andrelton Simmons, Braves (Preseason Rank: 4, 2013 WAR: 1.9)
I thought Simmons would hit a bit better than this, but his amazing, all-world defensive is what carries him. He’s got a 14 UZR right now and is slugging pretty well for a SS despite his low OBP. He’s not going to be in the top 4, but he’s very good. MISS
7. Yunel Escobar, Rays (Preseason Rank: N/A, 2013 WAR: 2.3)
Yeah, I never know what to make of this guy. I’m sure I didn’t give him enough credit, partially for his non-baseball issues, but anytime the Rays trade for you, you’re worth watching. Solid bat and good defense for Escobar this year. MISS
6. Jhonny Peralta, Tigers (Preseason Rank: N/A, 2013 WAR: 2.7)
I figured Peralta for a bounce back season, but not to this degree. Peralta is the 5th best SS on our list at the plate and has put together a league average season in the field. Peralta is doing it with a high BABIP, but he’s kept it up for 90+ games, so it’s probably not going to come crashing down and totally erase his value. MISS
5. Everth Cabrera, Padres (Preseason Rank: N/A, 2013 WAR: 2.9)
So he’s a great baserunner and always has been. But he’s added 45 points in OBP and 70 points in SLG over last season. I don’t know what you want from me. If you saw this coming, you’re a better predictor of SS that me. MISS
4. Hanley Ramirez, Dodgers (Preseason Rank: N/A, 2013 WAR: 3.1)
I left Hanley just off the list because I was worried about his ability to stay healthy. Good call, Neil. He’s at 3 WAR in 42 games. Whatever, this is stupid. MISS
3. Jean Segura, Brewers (Preseason Rank: N/A, 2013 WAR: 3.3)
Segura is having a great season. He’s hitting like a madman. I didn’t know enough about his skills as a prospect coming into the season to rank him, but at least for now, I’ve missed. I don’t think this level is sustainable, but he’s certainly good enough to have made the list. MISS
2. Ian Desmond, Nationals (Preseason Rank: 7, 2013 WAR: 3.4)
So I’ll be honest, I have no idea what to make of Ian Desmond. No non-Ben Zobrist SS put up a higher WAR (5.4) in 2012, but it seemingly came out of nowhere. He walked no more than previous years and struck out no less. His BABIP ticked up a bit and UZR liked him better, but he also managed to hit for a lot higher average and more power. That’s generally a good sign, but it’s also a bit strange. He didn’t improve his approach at the plate and his BABIP didn’t shoot up, but he got a lot better. I’m generally favorable toward Desmond, but I just don’t know if we’re going to look back at last year as a fluke or not. I’m not quite ready to buy into him just year, but check back later in the season because he could make me a believer in no time.
That’s what I said about him before the season. I’m just going to let that stand. PUSH
1. Troy Tulowitzki, Rockies (Preseason Rank: 1, 2013 WAR: 3.6)
Tulo is the best SS in baseball despite missing 30 games. Great defender and he’s an elite hitter at any position. This is the best shortstop in baseball when he’s on the field, and apparently, sometimes when he isn’t. After a pretty bad ranking so far, I’m hanging my hat on not screwing this one up. HIT
The Morning Edition (July 22, 2013)
From Last Night:
- Harvey dominates the Phils over 7 innings, allows 3 H and 10 K as Lee struggles
- Masterson flirts with a no-hitter in a 7-1 win over the Twins
- Giants waste a great start from Bumgarner
- Colon drops a CGSO on the Angels
- Wainwright’s 8 strong innings lead the Cards over the Padres
- Felix turns in 6 solid inning as the Mariners thrash the Astros
- Peralta and Alvarez throw gems, but it takes a Gindl walk off in the 13th to finalize the Crew and Fish
- Kershaw throws well, Zimmermann gets rocked in Dodgers win at Nats
- Bailey K’s 12 but the Reds fall to the Bucs
- Rays win…again
What I’m Watching Today:
- Darvish comes to Yankee Stadium (7p Eastern)
- Scherzer and Sale (8p Eastern)
- Garza showcase continues against Skaggs in AZ (930p Eastern)
- Lincecum returns to the mound for the first time since his no-hitter (10p Eastern)
The Big Question:
- Should the Rays scare you?
The answer is yes under certain conditions. First, if you cheer for the Rays, no the Rays should not scare you. Also, if you’re team is wildly out of the race, then you should just enjoy baseball and not sweat the standings. But everyone else should be worried because the Rays are dangerous. They probably won’t sustain a 17-2 pace for the rest of the season but they are putting the East on notice. On May 7th, the Rays were 14-18 and looked like they weren’t going to be able to provide their usually excellent starting pitching. Since then, they are 44-23, which is a 106 win pace. This is a good team that just had their rough stretch early, which is often a nice way to lull your opponents into a false sense of security. I picked the Rays to win the East and haven’t wavered. They are baseball’s 3rd best offense and 11th best pitching staff and have one of baseball’s best managers and easily the best GM. This is a team that should scare you. They have one of the game’s best in Longoria, an excellent super utility guy in Zobrist, the underrated Jennings, the young Myers, and the lightning in a bottle Loney. Not to mention the pitching is back. They Rays are hot and are only going to cool off a little.
SOEFA Sunday: Reliever Rankings Update (July 21, 2013)
You’ll recall earlier this year we introduced our very own reliever rankings called SOEFA, which you can read about in detail here. For a brief refresher, it combines strand rate, expected OBP against, ERA-, and FIP- into a deviation from league average. Zero is average, and will generally range between -2.5 to 2.5. This includes all pitchers who have thrown at least 20 IP in relief. Should you wish to know the SOEFA for any other reliever, or on a day that isn’t Sunday, hit us on Twitter or in the comments section.
| Rank | Player | Team | SOEFA |
| 1 | Alex Torres | Rays | 1 |
| 2 | Joaquin Benoit | Tigers | 0.99 |
| 3 | Neal Cotts | Rangers | 0.97 |
| 4 | Drew Smyly | Tigers | 0.96 |
| 5 | Mark Melancon | Pirates | 0.89 |
| 6 | Sergio Romo | Giants | 0.88 |
| 7 | Greg Holland | Royals | 0.88 |
| 8 | Will Harris | Diamondbacks | 0.86 |
| 9 | Kenley Jansen | Dodgers | 0.81 |
| 10 | Jason Grilli | Pirates | 0.8 |
| 11 | Glen Perkins | Twins | 0.8 |
| 12 | Jesse Crain | White Sox | 0.78 |
| 13 | Javier Lopez | Giants | 0.77 |
| 14 | Casey Fien | Twins | 0.72 |
| 15 | Jordan Walden | Braves | 0.7 |
| 16 | Sam LeCure | Reds | 0.69 |
| 17 | Trevor Rosenthal | Cardinals | 0.68 |
| 18 | Koji Uehara | Red Sox | 0.68 |
| 19 | Joe Thatcher | Padres | 0.67 |
| 20 | Craig Kimbrel | Braves | 0.66 |
| 21 | Preston Claiborne | Yankees | 0.66 |
| 22 | Shawn Kelley | Yankees | 0.63 |
| 23 | Edward Mujica | Cardinals | 0.62 |
| 24 | Casey Janssen | Blue Jays | 0.62 |
| 25 | Brett Cecil | Blue Jays | 0.61 |
| 26 | Oliver Perez | Mariners | 0.61 |
| 27 | Sean Doolittle | Athletics | 0.58 |
| 28 | David Robertson | Yankees | 0.58 |
| 29 | Manny Parra | Reds | 0.56 |
| 30 | Francisco Rodriguez | Brewers | 0.55 |
| 31 | Junichi Tazawa | Red Sox | 0.54 |
| 32 | Boone Logan | Yankees | 0.54 |
| 33 | Seth Maness | Cardinals | 0.54 |
| 34 | Ernesto Frieri | Angels | 0.54 |
| 35 | Paco Rodriguez | Dodgers | 0.53 |
| 36 | Andrew Bailey | Red Sox | 0.52 |
| 37 | Dale Thayer | Padres | 0.51 |
| 38 | Brandon Kintzler | Brewers | 0.51 |
| 39 | Robbie Ross | Rangers | 0.5 |
| 40 | Sandy Rosario | Giants | 0.5 |
| 41 | Joel Peralta | Rays | 0.49 |
| 42 | Matt Belisle | Rockies | 0.48 |
| 43 | Edgmer Escalona | Rockies | 0.48 |
| 44 | Brian Matusz | Orioles | 0.48 |
| 45 | Andrew Miller | Red Sox | 0.48 |
| 46 | Jason Frasor | Rangers | 0.46 |
| 47 | Tommy Hunter | Orioles | 0.45 |
| 48 | Grant Balfour | Athletics | 0.45 |
| 49 | Aroldis Chapman | Reds | 0.45 |
| 50 | Darren O’Day | Orioles | 0.45 |
| 51 | Luis Avilan | Braves | 0.44 |
| 52 | Josh Collmenter | Diamondbacks | 0.43 |
| 53 | Scott Downs | Angels | 0.43 |
| 54 | Bobby Parnell | Mets | 0.43 |
| 55 | Luke Hochevar | Royals | 0.43 |
| 56 | Vin Mazzaro | Pirates | 0.43 |
| 57 | Kevin Gregg | Cubs | 0.42 |
| 58 | Matt Reynolds | Diamondbacks | 0.42 |
| 59 | Chad Gaudin | Giants | 0.41 |
| 60 | Chad Qualls | Marlins | 0.41 |
| 61 | Randy Choate | Cardinals | 0.41 |
| 62 | Jonathan Papelbon | Phillies | 0.41 |
| 63 | J.P. Howell | Dodgers | 0.39 |
| 64 | David Carpenter | Braves | 0.39 |
| 65 | Antonio Bastardo | Phillies | 0.39 |
| 66 | Tanner Scheppers | Rangers | 0.38 |
| 67 | Luke Gregerson | Padres | 0.38 |
| 68 | Addison Reed | White Sox | 0.37 |
| 69 | Tyler Clippard | Nationals | 0.36 |
| 70 | Tom Gorzelanny | Brewers | 0.35 |
| 71 | Steve Cishek | Marlins | 0.35 |
| 72 | Brad Ziegler | Diamondbacks | 0.34 |
| 73 | Cody Allen | Indians | 0.34 |
| 74 | James Russell | Cubs | 0.33 |
| 75 | Ryan Cook | Athletics | 0.33 |
| 76 | Rafael Soriano | Nationals | 0.32 |
| 77 | Jim Henderson | Brewers | 0.32 |
| 78 | Steve Delabar | Blue Jays | 0.31 |
| 79 | Jose Mijares | Giants | 0.3 |
| 80 | Craig Breslow | Red Sox | 0.27 |
| 81 | Michael Kohn | Angels | 0.27 |
| 82 | Pat Neshek | Athletics | 0.26 |
| 83 | Rafael Betancourt | Rockies | 0.26 |
| 84 | Alfredo Simon | Reds | 0.25 |
| 85 | Jean Machi | Giants | 0.25 |
| 86 | Jerome Williams | Angels | 0.25 |
| 87 | Tony Watson | Pirates | 0.25 |
| 88 | Fernando Rodney | Rays | 0.24 |
| 89 | Josh Outman | Rockies | 0.24 |
| 90 | Rex Brothers | Rockies | 0.23 |
| 91 | Nate Jones | White Sox | 0.23 |
| 92 | Justin Wilson | Pirates | 0.22 |
| 93 | Jamey Wright | Rays | 0.21 |
| 94 | Jim Johnson | Orioles | 0.21 |
| 95 | Jose Veras | Astros | 0.2 |
| 96 | Yoervis Medina | Mariners | 0.19 |
| 97 | Charlie Furbush | Mariners | 0.18 |
| 98 | Santiago Casilla | Giants | 0.18 |
| 99 | Jesse Chavez | Athletics | 0.17 |
| 100 | Anthony Swarzak | Twins | 0.16 |
| 101 | Joe Nathan | Rangers | 0.15 |
| 102 | Bryan Morris | Pirates | 0.13 |
| 103 | Dane de la Rosa | Angels | 0.13 |
| 104 | Alfredo Figaro | Brewers | 0.13 |
| 105 | Aaron Loup | Blue Jays | 0.13 |
| 106 | Mariano Rivera | Yankees | 0.11 |
| 107 | Matt Lindstrom | White Sox | 0.1 |
| 108 | Caleb Thielbar | Twins | 0.09 |
| 109 | Darren Oliver | Blue Jays | 0.09 |
| 110 | Jared Burton | Twins | 0.08 |
| 111 | Anthony Varvaro | Braves | 0.07 |
| 112 | John Axford | Brewers | 0.07 |
| 113 | Joe Kelly | Cardinals | 0.07 |
| 114 | Ross Wolf | Rangers | 0.06 |
| 115 | Logan Ondrusek | Reds | 0.06 |
| 116 | Tyson Ross | Padres | 0.05 |
| 117 | LaTroy Hawkins | Mets | 0.05 |
| 118 | Matt Thornton | – – – | 0.05 |
| 119 | Aaron Crow | Royals | 0.05 |
| 120 | Cesar Ramos | Rays | 0.05 |
| 121 | J.J. Hoover | Reds | 0.04 |
| 122 | Joe Smith | Indians | 0.04 |
| 123 | Drew Storen | Nationals | 0.04 |
| 124 | Tim Collins | Royals | 0.02 |
| 125 | Kevin Jepsen | Angels | 0.01 |
| 126 | Adam Ottavino | Rockies | 0 |
| 127 | A.J. Ramos | Marlins | 0 |
| 128 | Ryan Pressly | Twins | 0 |
| 129 | Tony Sipp | Diamondbacks | -0.01 |
| 130 | Mike Dunn | Marlins | -0.01 |
| 131 | Troy Patton | Orioles | -0.02 |
| 132 | Burke Badenhop | Brewers | -0.02 |
| 133 | Carter Capps | Mariners | -0.02 |
| 134 | Wilton Lopez | Rockies | -0.03 |
| 135 | Joe Ortiz | Rangers | -0.04 |
| 136 | Luke Putkonen | Tigers | -0.04 |
| 137 | Ryan Webb | Marlins | -0.06 |
| 138 | Chris Perez | Indians | -0.07 |
| 139 | David Hernandez | Diamondbacks | -0.07 |
| 140 | Heath Bell | Diamondbacks | -0.08 |
| 141 | Bryan Shaw | Indians | -0.09 |
| 142 | Brad Brach | Padres | -0.09 |
| 143 | Jake McGee | Rays | -0.09 |
| 144 | Darin Downs | Tigers | -0.11 |
| 145 | Scott Rice | Mets | -0.12 |
| 146 | Josh Edgin | Mets | -0.13 |
| 147 | Danny Farquhar | Mariners | -0.13 |
| 148 | Jerry Blevins | Athletics | -0.13 |
| 149 | Paul Clemens | Astros | -0.15 |
| 150 | Brad Lincoln | Blue Jays | -0.15 |
| 151 | Michael Gonzalez | Brewers | -0.15 |
| 152 | Matt Guerrier | – – – | -0.16 |
| 153 | Craig Stammen | Nationals | -0.16 |
| 154 | Greg Burke | Mets | -0.16 |
| 155 | Tim Stauffer | Padres | -0.17 |
| 156 | Brian Duensing | Twins | -0.18 |
| 157 | Tom Wilhelmsen | Mariners | -0.18 |
| 158 | Cory Gearrin | Braves | -0.18 |
| 159 | Joba Chamberlain | Yankees | -0.2 |
| 160 | Wesley Wright | Astros | -0.21 |
| 161 | Nick Hagadone | Indians | -0.21 |
| 162 | Jose Cisnero | Astros | -0.21 |
| 163 | Ronald Belisario | Dodgers | -0.24 |
| 164 | Blake Beavan | Mariners | -0.25 |
| 165 | Jonathan Broxton | Reds | -0.26 |
| 166 | Vinnie Pestano | Indians | -0.26 |
| 167 | Travis Blackley | Astros | -0.27 |
| 168 | Phil Coke | Tigers | -0.28 |
| 169 | Garrett Richards | Angels | -0.29 |
| 170 | George Kontos | Giants | -0.31 |
| 171 | Rich Hill | Indians | -0.31 |
| 172 | Josh Roenicke | Twins | -0.31 |
| 173 | Kyle Farnsworth | Rays | -0.32 |
| 174 | T.J. McFarland | Orioles | -0.36 |
| 175 | Mike Adams | Phillies | -0.39 |
| 176 | Clayton Mortensen | Red Sox | -0.4 |
| 177 | Al Alburquerque | Tigers | -0.42 |
| 178 | Matt Albers | Indians | -0.42 |
| 179 | Alex Wilson | Red Sox | -0.43 |
| 180 | Hector Ambriz | Astros | -0.44 |
| 181 | Pedro Strop | – – – | -0.45 |
| 182 | Brandon Lyon | Mets | -0.47 |
| 183 | Huston Street | Padres | -0.47 |
| 184 | Esmil Rogers | Blue Jays | -0.49 |
| 185 | Justin De Fratus | Phillies | -0.51 |
| 186 | Adam Warren | Yankees | -0.52 |
| 187 | Kelvin Herrera | Royals | -0.52 |
| 188 | Bruce Chen | Royals | -0.53 |
| 189 | Jeremy Horst | Phillies | -0.59 |
| 190 | Jeremy Affeldt | Giants | -0.64 |
| 191 | Henry Rodriguez | – – – | -0.7 |
| 192 | Carlos Marmol | Cubs | -0.72 |
| 193 | Michael Kirkman | Rangers | -0.72 |
| 194 | Anthony Bass | Padres | -0.9 |
| 195 | Hector Rondon | Cubs | -0.98 |
| 196 | Shawn Camp | Cubs | -1.02 |
| 197 | Brandon League | Dodgers | -1.66 |
RBI Are Misleading Even Over Entire Careers
In keeping with the recent theme, I’d like to take another look at RBI as a statistic. Recently, I’ve shown you why RBI can be misleading when comparing two players’ value and why having a lot of RBI doesn’t necessarily mean you had a good season. To catch up on these and other similar posts about baseball statistics, check out our new Stat Primer page.
Today, I’m turning my attention to RBI over entire careers. You’ve seen already that RBI aren’t a good way to measure players in individual seasons, but we’ve yet to see how well they do at explaining value in very large samples. The answer is not much better.
To evaluate this, I took every qualifying player from 1920 (when RBI became and official stat) to 2013 (2,917 in all) and calculated their career RBI rate by simply taking their RBI/Plate Appearances. This will allow us to control for how often each player came to the plate so Babe Ruth’s 10,000 PA can go up against Hank Aaron’s nearly 14,000. Next, I compared that RBI Rate to wRC+ (what’s wRC+?) which is a statistic that compares offensive value to league average while controlling for park effects. The simple explanation is that wRC+ is a rate statistic that controls for league average, meaning that a 110 wRC+ means the same thing in 1930 as it does in 1980. League average is 100 and every point above or below is a percent better or worse than league average in that era.
The results aren’t great for RBI as an individual statistic. Overall, the adjusted R squared is .4766 which means that about 48% of the variation in wRC+ can be explained by variation in RBI Rate. Put simply, players who have more RBI per PA are better hitters on average than those with fewer, but there is a lot of variation that isn’t explained by RBI Rate meaning you can’t just look at RBI and know how good a player was.
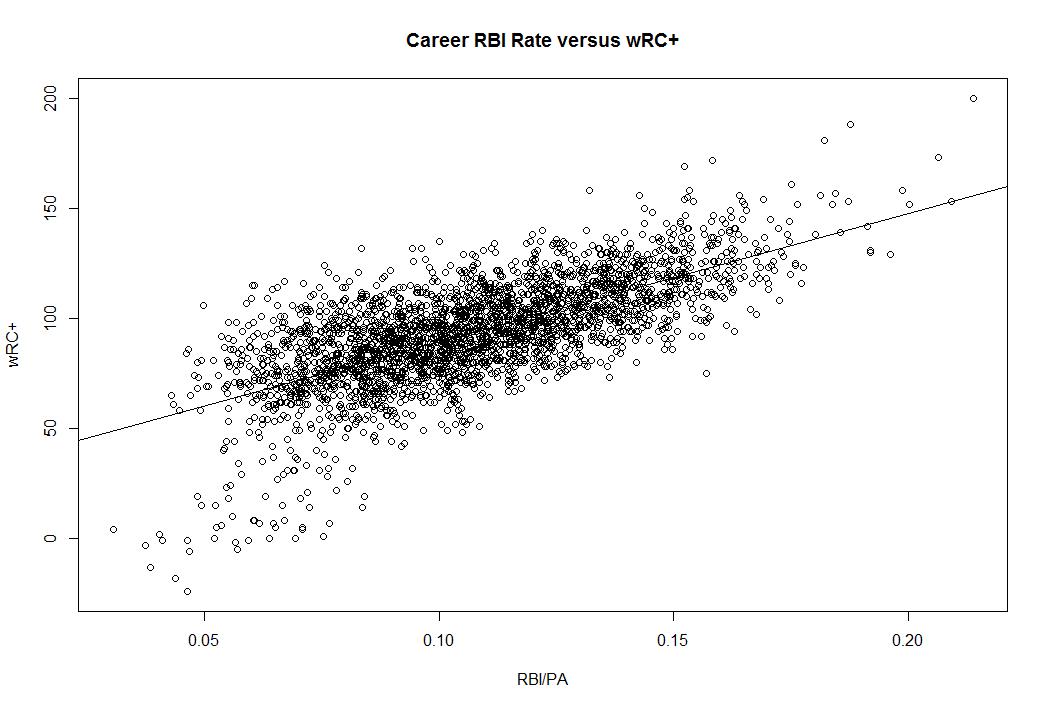
What this graph is showing you is quite striking. First, notice how many players have similar RBI Rates who have wildly different wRC+ and second notice how players with the same wRC+ have wildly different RBI Rates. Generally more RBI mean you’re better, but there’s a lot left unexplained by this stat.
Like I’ve said before, RBI isn’t a made up stat that is useless like wins for a pitcher because RBI reflects a real event on the field and is critical for score keeping. The problem with RBI is that it is too dependent on context and the team around you. Two players who are equally good on offense can have very different RBI Rates because they have a different number of opportunities to drive in runs. Similarly, players who drive in the same number of runs may be much different offensive players in terms of quality.
Even if you’re someone who thinks clutch hitting is a predictive skill, surely you can recognize that RBI is extremely context dependent. Your RBI total depends on how good you are, but also how many runners are on base, how many outs there are, and where the runners are positioned on the bases – all of which you have no control over as a hitter.
I’m on the front lines of the #KillTheWin movement, but I don’t think we should kill the RBI. The RBI just needs to be put in proper context and understood as a descriptive stat and not a measure of player value. Miguel Cabrera gets a lot of RBI, partially because he’s awesome, but also because his team gets on base in front of him all the time. Driving in runs is an important part of winning, it just isn’t an individual statistic. It’s a team statistic and we should view it as such.
You’ve seen that RBI can mislead you when comparing two players, that bad players can have a lot of RBI, and now you’ve seen that this isn’t something that evens out over time. RBI is simply not a good way to measure individual value when it can tell you the wrong thing this much of the time. There are better ways to measure the same concepts like wOBA, wRC+, and wRAA. Feel free to click on the links to learn more and check back for more on why you should put less stock in RBI.
The Morning Edition (July 21, 2013)
From Last Night:
- Mariners become the first team to ever score 4+ runs while getting just one hit as they beat the Astros in a game in which Bedard left the game without allowing a hit after 6.1 IP
- Indians waste a solid start by Kluber, fall to the Twins
- Kuroda shuts down the Sox, Yanks edge past Lackey
- Rays stay hot against the Jays
- Greinke and Gio pitch great, but the Nats take it in 10
What I’m Watching Today:
- Lee, Harvey…Oswald? at Citi Field (1p Eastern)
- Kershaw takes on Zimmermann in DC (130p Eastern)
- Felix goes to Houston, strikeout warning in effect (2p Eastern)
- Wainwright goes against the Padres (2p Eastern)
The Big Question:
- Who’s regretting the offseason now?
Something I noticed last night was that 11:25pm, the Blue Jays, Royals, and Angels (the 3 AL teams that made big moves this offseason) all have the same number of wins as the Mariners. All at 45. The lesson here is that big moves don’t make a good team. I’m not knocking what the Blue Jays did, but the Angels and Royals made poor moves. To recap, the Angels gave $125 million to Josh Hamilton (which is risky in itself) instead of doing anything to improve their pitching staff and the Royals traded away a great young hitter for a starting pitcher who can’t help the team win because they don’t score any runs. Even if Shields and Myers were a good swap in terms of dollars and value, it certainly didn’t make sense to trade from a weakness to get more pitching when that new pitching was only enough to make you a .500 team. Setting that aside, my point is that the national media latched onto the big moves and called these teams the big winners in the offseason. That was silly. You have to look at the whole picture and the whole picture almost always favors the club that adds complimentary pieces instead of big names. The media chases stories, MLB teams should chase wins. Remember that next time you’re reading offseason winners and losers. Texas “had a terrible offseason” if you listened to the writers. Funny how that works out.
The Nine Worst 100 RBI Seasons in MLB History
Yesterday we took a look at a case study in RBI to help explain why it’s a misleading statistic. The idea here is that RBI is very dependent on your team and the context you’re in. Two identical hitters will accumulate much different RBI totals depending on how many runners on base ahead of them and which bases those runners occupy. You can read all about it here.
Today, I’d like to start highlighting some broader evidence of the problems with RBI as a stat. You’ve already seen how a better season can result in fewer RBI depending on how the team around you performs, now let’s take a look at The Nine Worst 100 RBI Seasons in MLB History. This list is meant to show you that you can have a very poor season and still accumulate 100 RBI, which is often considered a magic number by people who value RBI. The phrase “100 RBI guy” is something you might here an analyst like John Kruk say when commenting on a player’s value. I’m here to show you that 100 RBI does not necessarily mean the player had a very good season.
Below, we have The Nine worst seasons by wRC+ since 1901 in which the player drove in 100 or more runs. wRC+ is a statistic that measures how a player stacks up to other players in the league and it factors in park effects. It’s easy to interpret the number. A wRC+ of 100 is league average and every point above 100 is a percent better than average a percent below average is a 99 wRC+. For example, an 85 wRC+ is a player who is 15% worse than a league average player. 115 wRC+ is 15% better than league average. You can read all about wRC+ here.
| Rank | Season | Name | Team | PA | RBI | AVG | OBP | SLG | wRC+ |
| 9 | 1927 | Glenn Wright | Pirates | 626 | 105 | 0.281 | 0.328 | 0.388 | 86 |
| 8 | 2006 | Jeff Francoeur | Braves | 686 | 103 | 0.260 | 0.293 | 0.449 | 84 |
| 7 | 1983 | Tony Armas | Red Sox | 613 | 107 | 0.218 | 0.254 | 0.453 | 84 |
| 6 | 1934 | Ray Pepper | Browns | 598 | 101 | 0.298 | 0.333 | 0.399 | 82 |
| 5 | 1990 | Joe Carter | Padres | 697 | 115 | 0.232 | 0.290 | 0.391 | 80 |
| 4 | 1993 | Ruben Sierra | Athletics | 692 | 101 | 0.233 | 0.288 | 0.390 | 79 |
| 3 | 1999 | Vinny Castilla | Rockies | 674 | 102 | 0.275 | 0.331 | 0.478 | 78 |
| 2 | 2004 | Tony Batista | Expos | 650 | 110 | 0.241 | 0.272 | 0.455 | 77 |
| 1 | 1997 | Joe Carter | Blue Jays | 668 | 102 | 0.234 | 0.284 | 0.399 | 72 |
What you have here is a list of players who are “100 RBI guys” who were substantially worse than league average. Perhaps some comparisons might be help. Let’s find a couple of current MLB players who slot in around 70-85 wRC+. Brendan Ryan has a career 72 wRC+. Jason Nix is at 72. Ramon Santiago is 75. Willie Bloomquist is 78. Ruben Tejada is 83. I’m not saying any of the guys on this list are bad players, I’m saying they all had bad seasons in which they still had 100 or more RBI. They guys had Ramon Santiago seasons at the plate and drove in over 100 runs.
Do you really want to place so much stock in a statistic that says a guy who hits like Brendan Ryan is among the league’s best hitters? I don’t. RBI is very much a team dependent statistic and we shouldn’t use it to value individual players. Players can’t control the situations you put them into, they can only control what they do in those situations. As seen here, even players who don’t do very well can still add RBI to their resumes if they are put into situations with many runners on base.
The Morning Edition (July 20, 2013)
From Last Night:
- Brandon Barnes hits for the cycle in a loss to the Mariners
- The Cards shell Marquis, but the Padres make it interesting
- Holland goes 8, but gives up 3 runs in a loss to the O’s
- The Phils pummel the Mets setting Kendrick up for a terrible start that still ends in a win
- The Rays win an 8 HR slugfest with the Jays
- Soriano coughs up a strong start for Strasburg
What I’m Watching Today:
- Hamles versus Wheeler at Citi (1p Eastern)
- Kuroda and Lackey (4p Eastern)
- Burnett takes on Latos (4p Eastern)
- Greinke goes against Gio (7p Eastern)
The Big Question:
- Where does the cycle rank among cool baseball achievements?
Obviously the cycle is awesome for it’s value (at least four times on base) and it’s cool factor (getting each type of hit) but where does it rank among other cool things. No-hitters, perfect games, 4 HR games, CGSO? Let’s take a look at the numbers since 1916:
- Perfect Games: 21
- No-hitters: 204
- Cycles: 240
- Cycles w/a walk: 39
- 4 HR: 14
- 15 or more K: 232
If you asked me I’d most prefer to attend a perfect game, no question, but all of them would be a lot of fun. I’ve been to about 3-4 near no-hitters and a 14 K game.
