How Was The Game? (June 26, 2013)

One that slowly slipped away.
Angels 7, Tigers 4
The Tigers got off to a good start with back to back homeruns from Hunter and Cabrera in the first inning, but Jose Alvarez (1-1, 16.2 IP, 3.78 ERA, 5.69 FIP, -0.1 WAR) allowed the equalizing homer to Trout in the 3rd inning. The Tigers came back with a run in the bottom half of the inning, but Leyland gave Alvarez a little too much leash as he was tiring in the 6th inning and he allowed a go-ahead homerun from Erick Aybar before being pulled after 5.2 innings and 4 runs. Smyly, unfortunately, surrendered 3 runs of his own even though he has been one of the better relievers in all of baseball this year. (New English D’s new SOEFA rankings put him at 5th entering the day!) After last night’s ugly one, this one was a more subtle defeat, but they count the same in the standings. They’ll try and salvage one on Thursday behind Doug Fister (6-5, 96 IP, 3.66 ERA, 2.86 FIP, 2.7 WAR) to make it a 5-5 homestand and avoid the season sweep at the hands of the Angels and he who shall not be named.
The Moment: Hunter and Cabrera go back to back to start the game.
A New Way To Measure Relief Pitchers: SOEFA
I’ve long been a critic of the save statistic, and I don’t need to rehash why it’s the scourge of the baseball world, but relief pitching is still an important part of the game and we often struggle to properly measure it. Won/Loss record and saves tell you nothing about a player’s individual skill, especially not relievers, and even things like ERA don’t do a lot of good because relievers aren’t charged for runners they let in belonging to another pitcher and can get charged with runs allowed by the pitchers who come after.
Strikeouts, walks, and homeruns allowed (the basis of FIP) are good measurements, but FIP inherently strips away context. And context does matter for relief pitchers. It’s an elite reliever’s job to come in and strand runners, so strikeouts are good and homeruns are bad, but sequencing is really important and it matters a lot when they get outs and when they allow baserunners.
In a sense, FIP and similar statistics are good, but they aren’t perfect because they’re context neutral and we might want some context in reliever stats. Win Probability Added (WPA) is a typical way to fix this, but this feels too context dependent for me. WAR is always a nice combination of these kinds of measures, but WAR is a counting stat so how much a reliever is used matters a lot, and relievers are often used incorrectly.
My point here is not that I can come up with something better, but rather that I want to try to add something. I always look at reliever stats and find logical holes more often than with position players and starters. I want a reliever stat that measures context, considers the peripheral numbers, and also understands the luck involved. I didn’t find one out there that satisfied me, so I went to work inventing one.
I’ll say this. This isn’t perfect and I want to improve it. Flaws you may find in the method should not cause you to discount it, but rather to add to the discussion. This is a first crack. I hope you find it useful.
The Goal
So first, I started with a question: What is the job of a relief pitcher? Here was my answer:
- Strand runners
- Don’t allow baserunners
- If you allow baserunners, don’t let them score.
With that outlined, I went to work thinking about how to measure each and came up with the following statistic that I will call SOEFA, pronounced like “sofa.” It stands for Strand On-base ERA FIP Average and should be thought of as a way to measure relievers from your sofa. Yes, I have a whimsical side.
It has four components, let’s walk through them.
The Formula
First is Strand Rate+, which I calculated as what percent better or worse a reliever is from league average at stranding runners. League average is 70%, so if you strand 100% of your inherited runners, your Strand Rate+ is .43 because you are 43% better than league average.
Second, is your Expected OBP+ or xOBP+ which is your opponents on base percentage calculated as a percentage deviation from league average just like SR+, except that I regress your hits allowed based on league average BABIP because sometimes batters get lucky hits.
Third, is my version or ERA+, which is just like normal ERA- except I scale mine to zero instead of 100 like the major stat sites and invert it. Same principles regarding deviation from average applies. FIP+ is exactly the same, except I use FIP-. These numbers are park adjusted.
To combine them, I add SR+ to xOBP+ and then add ERA+ to get eSOEFA. I then repeat the same process and replace ERA+ with FIP+ to get fSOEFA. A pitcher’s SOEFA score is the average between the two.
The output gives you a number that sets league average at zero and ranges technically from negative infinity to about 2.5, but generally speaking you won’t see a reliever fall below -2.5. Basically it’s a -3 to 3 scale that puts good relievers on the plus side and bad ones on the negative side.
Additionally, at my discretion, relievers who have inherited fewer than five baserunners during the season (this number will likely be fluid based on where we are in the season) are given a league average SR+ so that if you don’t ever inherit runners you aren’t unfairly punished because you are not given sufficient opportunity to strand them or you are not given credit for an awesome strand rate if you strand the only runner you inherit.
I’m pretty happy with the first round of results. The first run of results came from stats entering June 25th and it generally lines up with my impression of the best performing relief pitchers in baseball. I have no idea if this stat is predictive or how long it takes to stabilize. Right now, it correlates with ERA and FIP at -.73 and -.75 despite the fact that each is only 1/6 of the input and the R squared is around .6 using it to predict FIP, if those kinds of things interest you.
It’s experimental. It’s meant to be fun and maybe helpful.
A word of note is that Fangraphs and B-R seem to use different cutoffs for which relievers “qualify,” so this output may be missing a few relievers. I’m sorry about that. The great thing about this statistic is that I can easily produce the number for any reliever in baseball in less than two minutes. If you want to know how a reliever measures up or how a reliever did during a given season, just ask and I can provide the number based on a handy program I wrote. Hit me on Twitter @NeilWeinberg44 and I’d be happy to provide the SOEFA for any reliever.
Thanks for reading and I welcome any feedback. Who knows, maybe this will work.
Below are the SOEFA for the vast majority of qualifying relievers up through 6/24/13. If you want to know the SOEFA of a reliever not on this list or would like an update score, please let me know.
| Rank | Player | Team | SOEFA |
| 1 | Sergio Romo | Giants | 0.99 |
| 2 | Jason Grilli | Pirates | 0.95 |
| 3 | Junichi Tazawa | Red Sox | 0.92 |
| 4 | Kevin Gregg | Cubs | 0.92 |
| 5 | Drew Smyly | Tigers | 0.9 |
| 6 | Joaquin Benoit | Tigers | 0.89 |
| 7 | Jordan Walden | Braves | 0.88 |
| 8 | Robbie Ross | Rangers | 0.87 |
| 9 | Mark Melancon | Pirates | 0.85 |
| 10 | Jesse Crain | White Sox | 0.83 |
| 11 | Edward Mujica | Cardinals | 0.79 |
| 12 | Brett Cecil | Blue Jays | 0.79 |
| 13 | Greg Holland | Royals | 0.75 |
| 14 | Oliver Perez | Mariners | 0.74 |
| 15 | Trevor Rosenthal | Cardinals | 0.74 |
| 16 | Kenley Jansen | Dodgers | 0.72 |
| 17 | Glen Perkins | Twins | 0.71 |
| 18 | Koji Uehara | Red Sox | 0.7 |
| 19 | Preston Claiborne | Yankees | 0.69 |
| 20 | Sam LeCure | Reds | 0.68 |
| 21 | Casey Janssen | Blue Jays | 0.64 |
| 22 | Mariano Rivera | Yankees | 0.63 |
| 23 | Luke Gregerson | Padres | 0.62 |
| 24 | Craig Kimbrel | Braves | 0.62 |
| 25 | Sean Doolittle | Athletics | 0.6 |
| 26 | Edgmer Escalona | Rockies | 0.56 |
| 27 | Tommy Hunter | Orioles | 0.56 |
| 28 | Brad Ziegler | Diamondbacks | 0.54 |
| 29 | Joe Nathan | Rangers | 0.53 |
| 30 | Joe Smith | Indians | 0.53 |
| 31 | Vin Mazzaro | Pirates | 0.51 |
| 32 | Jim Henderson | Brewers | 0.5 |
| 33 | James Russell | Cubs | 0.49 |
| 34 | Casey Fien | Twins | 0.48 |
| 35 | Tim Collins | Royals | 0.47 |
| 36 | Shawn Kelley | Yankees | 0.47 |
| 37 | Brian Matusz | Orioles | 0.46 |
| 38 | Addison Reed | White Sox | 0.46 |
| 39 | Tanner Scheppers | Rangers | 0.45 |
| 40 | Rafael Soriano | Nationals | 0.44 |
| 41 | Aroldis Chapman | Reds | 0.44 |
| 42 | Joel Peralta | Rays | 0.43 |
| 43 | Matt Reynolds | Diamondbacks | 0.43 |
| 44 | Brandon Kintzler | Brewers | 0.43 |
| 45 | Ryan Cook | Athletics | 0.42 |
| 46 | Chad Qualls | Marlins | 0.42 |
| 47 | Cody Allen | Indians | 0.4 |
| 48 | Andrew Miller | Red Sox | 0.4 |
| 49 | David Robertson | Yankees | 0.38 |
| 50 | Seth Maness | Cardinals | 0.36 |
| 51 | Bobby Parnell | Mets | 0.36 |
| 52 | Matt Belisle | Rockies | 0.36 |
| 53 | Josh Outman | Rockies | 0.36 |
| 54 | Rex Brothers | Rockies | 0.35 |
| 55 | Jonathan Papelbon | Phillies | 0.35 |
| 56 | Dale Thayer | Padres | 0.35 |
| 57 | Darren O’Day | Orioles | 0.33 |
| 58 | Justin Wilson | Pirates | 0.33 |
| 59 | Luke Hochevar | Royals | 0.31 |
| 60 | Grant Balfour | Athletics | 0.3 |
| 61 | John Axford | Brewers | 0.29 |
| 62 | Ernesto Frieri | Angels | 0.29 |
| 63 | Drew Storen | Nationals | 0.27 |
| 64 | Bryan Shaw | Indians | 0.26 |
| 65 | Nate Jones | White Sox | 0.26 |
| 66 | Luis Avilan | Braves | 0.25 |
| 67 | Anthony Varvaro | Braves | 0.25 |
| 68 | Anthony Swarzak | Twins | 0.24 |
| 69 | Paco Rodriguez | Dodgers | 0.24 |
| 70 | Jean Machi | Giants | 0.2 |
| 71 | Tyler Clippard | Nationals | 0.19 |
| 72 | Matt Thornton | White Sox | 0.19 |
| 73 | Steve Delabar | Blue Jays | 0.18 |
| 74 | Craig Stammen | Nationals | 0.17 |
| 75 | Tony Watson | Pirates | 0.17 |
| 76 | Pat Neshek | Athletics | 0.16 |
| 77 | Jamey Wright | Rays | 0.16 |
| 78 | J.P. Howell | Dodgers | 0.16 |
| 79 | Cesar Ramos | Rays | 0.15 |
| 80 | Alfredo Simon | Reds | 0.15 |
| 81 | Troy Patton | Orioles | 0.15 |
| 82 | Matt Lindstrom | White Sox | 0.14 |
| 83 | Jim Johnson | Orioles | 0.12 |
| 84 | Carter Capps | Mariners | 0.11 |
| 85 | Ryan Pressly | Twins | 0.11 |
| 86 | Steve Cishek | Marlins | 0.11 |
| 87 | Darin Downs | Tigers | 0.1 |
| 88 | Antonio Bastardo | Phillies | 0.09 |
| 89 | Charlie Furbush | Mariners | 0.07 |
| 90 | Brian Duensing | Twins | 0.07 |
| 91 | Yoervis Medina | Mariners | 0.07 |
| 92 | Jerry Blevins | Athletics | 0.07 |
| 93 | Tom Gorzelanny | Brewers | 0.06 |
| 94 | Jared Burton | Twins | 0.05 |
| 95 | Jose Veras | Astros | 0.05 |
| 96 | Joe Kelly | Cardinals | 0.05 |
| 97 | David Hernandez | Diamondbacks | 0.04 |
| 98 | Ryan Webb | Marlins | 0.04 |
| 99 | Aaron Loup | Blue Jays | 0.03 |
| 100 | Wesley Wright | Astros | 0.01 |
| 101 | Bryan Morris | Pirates | 0.01 |
| 102 | Burke Badenhop | Brewers | 0 |
| 103 | Dane de la Rosa | Angels | -0.02 |
| 104 | Adam Ottavino | Rockies | -0.04 |
| 105 | LaTroy Hawkins | Mets | -0.04 |
| 106 | Cory Gearrin | Braves | -0.06 |
| 107 | Joe Ortiz | Rangers | -0.08 |
| 108 | Wilton Lopez | Rockies | -0.08 |
| 109 | Brandon Lyon | Mets | -0.08 |
| 110 | J.J. Hoover | Reds | -0.08 |
| 111 | Mike Dunn | Marlins | -0.09 |
| 112 | Fernando Rodney | Rays | -0.1 |
| 113 | Hector Ambriz | Astros | -0.1 |
| 114 | Paul Clemens | Astros | -0.13 |
| 115 | Tom Wilhelmsen | Mariners | -0.13 |
| 116 | Matt Guerrier | Dodgers | -0.13 |
| 117 | Josh Roenicke | Twins | -0.17 |
| 118 | Jose Mijares | Giants | -0.21 |
| 119 | Michael Gonzalez | Brewers | -0.23 |
| 120 | Jonathan Broxton | Reds | -0.25 |
| 121 | Jake McGee | Rays | -0.25 |
| 122 | Matt Albers | Indians | -0.26 |
| 123 | A.J. Ramos | Marlins | -0.26 |
| 124 | Scott Rice | Mets | -0.29 |
| 125 | Nick Hagadone | Indians | -0.31 |
| 126 | Travis Blackley | Astros | -0.33 |
| 127 | Vinnie Pestano | Indians | -0.34 |
| 128 | George Kontos | Giants | -0.35 |
| 129 | Mike Adams | Phillies | -0.39 |
| 130 | Clayton Mortensen | Red Sox | -0.4 |
| 131 | Garrett Richards | Angels | -0.43 |
| 132 | Heath Bell | Diamondbacks | -0.46 |
| 133 | Esmil Rogers | Blue Jays | -0.5 |
| 134 | Ronald Belisario | Dodgers | -0.51 |
| 135 | Jeremy Affeldt | Giants | -0.55 |
| 136 | Brandon League | Dodgers | -0.55 |
| 137 | Jeremy Horst | Phillies | -0.58 |
| 138 | Kelvin Herrera | Royals | -0.67 |
| 139 | Carlos Marmol | Cubs | -0.72 |
| 140 | Huston Street | Padres | -0.82 |
| 141 | Anthony Bass | Padres | -0.94 |
| 142 | Hector Rondon | Cubs | -1.24 |
Stat(s) of the Week: Defensive Runs Saved and Ultimate Zone Rating
Since I’ve twice written above defense in the last week, it’s high time I actually explain these defensive stats. Luckily, this is quite easy to explain and understand. There are two primary defensive metrics that people use. Defensive Runs Saved (DRS) and Ultimate Zone Rating (UZR), which are based on people watching video of every play and computer algorithms.
You can learn exactly how each is calculate here, DRS and UZR. But you don’t need to know how to calculate them in order to understand what they mean. It’s important to learn about these because Fielding % is problematic stat because it doesn’t factor in a player’s range, so you can have a good fielding percentage if you don’t make errors because you never get to difficult balls. We need numbers that measure how good players are at preventing runs and avoiding errors isn’t the only way to do that.
The numbers are scaled to position, so league average at every position is zero and positive numbers are good and negative numbers are bad.
For example a player with a +5 DRS or +5 UZR is five runs better than league average at their position. 10 runs is equal to 1 Win Above Replacement (WAR). These are counting stats, so you accumulate them as the season goes on, although I believe they are only updated weekly on the more popular statistics websites.
You can use either DRS or UZR depending on your preference, but Baseball Reference uses DRS in their WAR and Fangraphs uses UZR in theirs. It’s a preference thing. I always use Fangraphs WAR on this site, but I interchange the defensive stats on occasion because I don’t really have a favorite. If there is no label on this site, it is UZR.
Additionally, you might see UZR/150, which is simply UZR scaled into a full season of games as if you played at your current pace for a whole season.
As a rule of thumb, 0 is average, -5/+5 is above or below average, -10/+10 is poor or great, -15/+15 is awful or elite. It is also important to know that these statistics take a while to become predictive, so small samples can cause problems with defensive numbers but they generally all a good description of what has happened, even if it doesn’t predict what will happen next.
Dynamic Standings Projection (June 26, 2013)
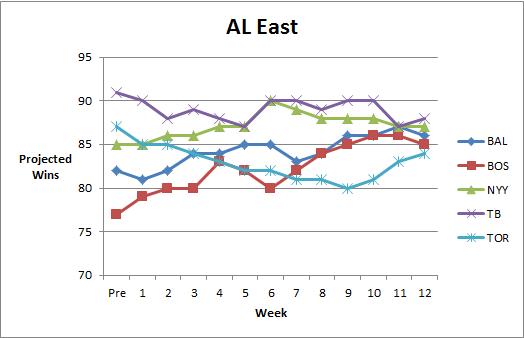
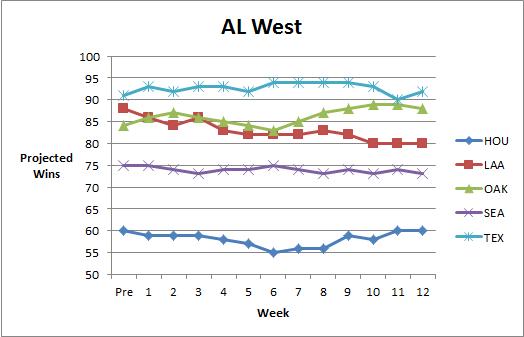
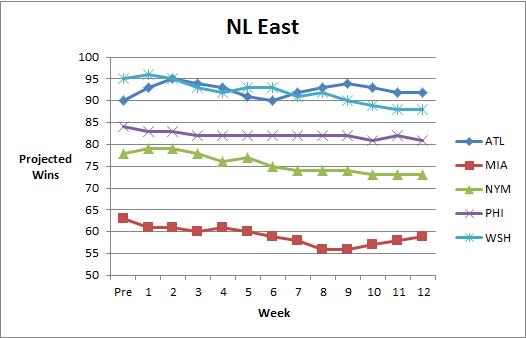
In case you missed it, in April we launched our Dynamic Standings Projection feature on New English D. A full explanation of the methodology can be found here or by clicking the tab at the top of the page. This project seeks to provide a reasoned and cautious approach to updating our beliefs about the baseball future. You can find a summarization of the original projections here. You’ll notice a column on the far right that indicates the difference in projected wins from the preseason prediction. Positive numbers mean teams are now projected to win more games and negative numbers mean a team is now projected to win fewer games. You’ll notice a series of graphs below the standings section that track how the projections have evolved over the course of the year.
This Dynamic Standings Projection is updated through the June 25 games.
| 26-Jun | W | L | PreDiff | |
| TB | 88 | 74 | 0.543 | -3 |
| NYY | 87 | 75 | 0.537 | 2 |
| BAL | 86 | 76 | 0.531 | 4 |
| BOS | 85 | 77 | 0.525 | 8 |
| TOR | 84 | 78 | 0.519 | -3 |
| W | L | PreDiff | ||
| DET | 92 | 70 | 0.568 | -2 |
| CWS | 77 | 85 | 0.475 | -6 |
| CLE | 77 | 85 | 0.475 | 6 |
| KC | 76 | 86 | 0.469 | 0 |
| MIN | 70 | 92 | 0.432 | 5 |
| W | L | PreDiff | ||
| TEX | 92 | 70 | 0.568 | 1 |
| OAK | 88 | 74 | 0.543 | 4 |
| LAA | 80 | 82 | 0.494 | -8 |
| SEA | 73 | 89 | 0.451 | -2 |
| HOU | 60 | 102 | 0.370 | 0 |
| W | L | PreDiff | ||
| ATL | 92 | 70 | 0.568 | 2 |
| WSH | 88 | 74 | 0.543 | -7 |
| PHI | 81 | 81 | 0.500 | -3 |
| NYM | 73 | 89 | 0.451 | -5 |
| MIA | 59 | 103 | 0.364 | -4 |
| W | L | PreDiff | ||
| STL | 94 | 68 | 0.580 | 6 |
| CIN | 93 | 69 | 0.574 | 1 |
| PIT | 90 | 72 | 0.556 | 8 |
| MIL | 74 | 88 | 0.457 | -5 |
| CHC | 68 | 94 | 0.420 | 0 |
| W | L | PreDiff | ||
| SF | 86 | 76 | 0.531 | -5 |
| ARZ | 85 | 77 | 0.525 | 3 |
| LAD | 81 | 81 | 0.500 | -7 |
| SD | 79 | 83 | 0.488 | 1 |
| COL | 72 | 90 | 0.444 | 9 |


The Morning Edition (June 26, 2013)
From Last Night:
- Chris Sale went 8, gave up 2 ER, had 13 K and left with the lead. He didn’t get the win. The guy who blew the save did.
- Matt Moore does a Matt Moore impression with 11 K and 6 BB, wins
- The Red Sox score 11 without a HR
- Ichiro walks off as Darvish and Kuroda are ordinary
- Casilla hit as many homeruns as Chris Davis, 1 each
What I’m Watching Today:
- Felix faces the Pirates (330p Eastern)
- Zimmermann takes the hill (7p Eastern)
- Cole Hamels against the Padres (10p Eastern)
- Kershaw and Lincecum (10p Eastern)
The Big Question:
- Come on guys, can we leave Chris Sale alone?
Seriously, I want to discredit the win stat too, but can it not keep happening to the same guy. But. BUT! Let’s play a game regarding Astros pitcher Erik Bedard. Let’s explore his ERA and FIP by month:

He’s getting a lot better each month. This is good news. I bet he’s striking out more batters than he was at the beginning of the season.
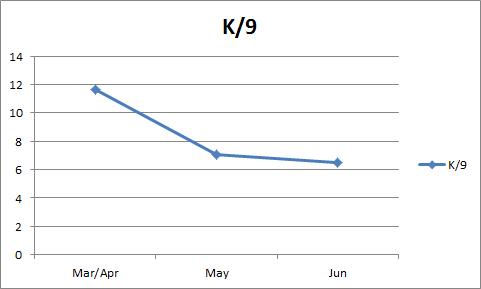
Oh. Well. I bet he’s walking fewer people!
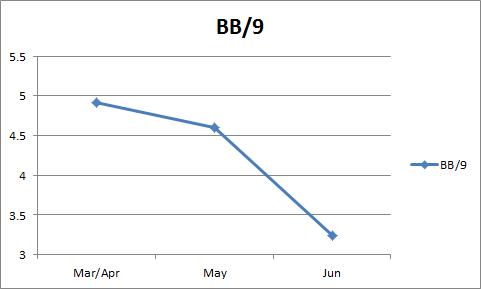
Well he is, but he’s still walking and awful lot of people. Hmmm, this is tricky. Maybe it’s because he is allowing fewer homeruns?

Yeah, that’s probably it. Sorry, Bedard this probably isn’t sustainable!
How Was The Game? (June 25, 2013)
Just dreadful.
Angels 14, Tigers 8
So I’m a believer in the theory, it might be my own, that there is exactly one game per season that isn’t fun. This was that game. Usually, I find enjoyment in the game even if it’s a loss, heartbreaking or otherwise. For example, the last time Porcello played the Angels, it was fun to watch Smyly dominate out of the pen. Tonight, I can’t think of anything worth celebrating. Rick Porcello (4-5, 80.1 IP, 5.15 ERA, 3.64 FIP, 1.3 WAR) did not pitch as poorly as the line indicates as a lot of groundballs found holes, but he wasn’t terribly sharp either after the first five batters. The offense had three nice outbursts, I suppose and actually scored a lot of runs, but they ruined that by making, I’m not kidding you, six errors. They made six errors. That’s like two weeks worth of errors. If you missed this game, don’t go look at the box score, I’ll spare you. Forget it happened. It’s done. It’s a loss, nothing more. We’ll wipe the slate clean and try again with Jose Alvarez (1-0, 11 IP, 2.45 ERA, 4.68 FIP, 0.1 WAR) on the mound Wednesday.
The Moment: Um…Cabrera hit a homerun.
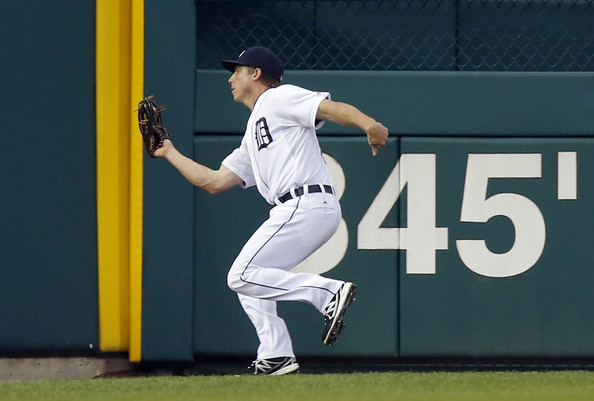
Andy Dirks’ Inverted Value: Trading Offense for Defense
Andy Dirks has been slumping with the bat lately. A lot of Tigers fans are unhappy with his performance lately and want to see more from the now-injured Tuiasosopo, Garcia, and Castellanos. I get that, I understand. The offensive numbers are down. You can see it in his rate stats from last year to this season:

He’s 100 PA shy of where he was last season (344 to 244), so the counting stats are going to be harder to compare, but something is incredibly interesting about Dirks this season. Last year, he was worth 1.6 WAR in 344 PA. This year he’s at 1.4 WAR in 244 PA. So he’s actually a little ahead of last year’s overall value despite being 100 PA behind and being a worse player across the board offensively.
Andy Dirks went from an above average hitter and below average defender last season to an elite fielder and below average hitter this season. Now, it could be a sample size issue. Certainly it could. But the change is pretty dramatic and pretty interesting in terms of where his value is coming from, so let’s just take a look with the caveat that this might not keep up.
If we take a look at this advanced defensive numbers, multiple measures line up. Defensive Runs Saved (DRS) and Ultimate Zone Rating (UZR) agree that Dirks was slightly below average/right around average in 2012 and way above average in 2013.

So Dirks’ bat is down and his defense is way up. If we look at where he is contributing runs to his team it has completely shifted (keep in mind replacement level and positional adjustments change a little year to year) from the bat to the glove (10 runs equals 1 WAR). Batting runs, fielding runs, and total runs above replacement look like this:
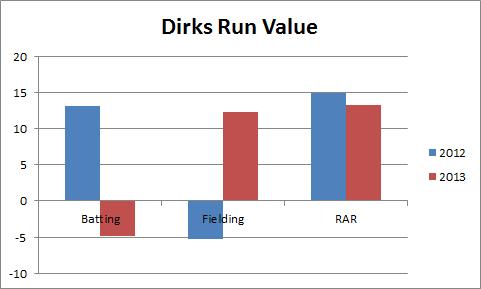
Basically, the takeaway point here is that while Dirks is struggling at the plate this season, he has made up for it with huge defensive value. I’ve watched almost every inning of Tigers baseball this year and I’m comfortable with the directional change, even if you want to quibble over his precise defensive numbers. Dirks has been great on defense especially compared to most guys who play left field.
Consider this, by UZR/150 which is essentially how many runs a player saves on defense per 150 games, Andy Dirks in LF is baseball’s best qualifying defender. His UZR/150 this year is 34.9. That’s like being a 3.5 WAR player just on defense. Granted, he’ll regress a little over time, but that is an elite level to this point. He’s the best defensive player in baseball by this measure! He’s 2nd in UZR (which isn’t scaled to a full season) and 8th in DRS. (These are all broken down by position and player so guys who play many different positions are unfairly knocked down)
So while I understand that fans are concerned about Dirks’ offensive performance you have to consider his defense as part of his overall value. That’s why Wins Above Replacement (WAR) is such a useful tool. It places a run value on everything and converts those runs into wins. I don’t care how a player adds value, I care if they add value. Dirks is adding value on defense instead of at the plate, and we can’t just ignore that.
Half of a player’s job is playing defense, even if it isn’t as sexy. And Andy Dirks is playing great defense.
The Morning Edition (June 25, 2013)
From Last Night:
- The Blue Jays finally lost after winning 11 straight
- There were four games, you don’t need me for this. Here are all the scores and boxes.
What I’m Watching Today:
- Darvish versus Kuroda at Yankees Stadium (7p Eastern)
- One of the only reasons to watch the Marlins, Jose Fernandez takes the hill (7p Eastern)
- Wheeler faces Sale (8p Eastern)
- The surprisingly impressive Jeff Locke faces the Mariners (10p Eastern)
The Big Question:
- So, are the Jays back in this?
A week ago, I questioned if the Blue Jays were buried despite recent success and they didn’t lose from that point until yesterday. They are back in it. Which gave me a new threshold for determining whether or not a team is or is not out of it. I heard someone else spout this idea, so I’m not taking credit for it, I’m merely buying into it. If a team is a good two week stretch away from being in contention, they aren’t out of it. I think this is a good barometer for teams thinking about selling at the deadline and that kind of thing. If we play our best baseball right now for two weeks, would we be in this race? That’s how I’m going to start thinking about the standings. Although, I make it a rule not to spend much time looking at the standings until after the break. But hey, that’s soon.
Amazing Facts Regarding Don Kelly
I am an unabashed Don Kelly fan. I’ll be clear. My agenda here is to highlight good things about Kelly and really just have some fun with small samples and arbitrary endpoints. One should not read this post as something other than a lighthearted love letter to the Tigers utility man.
He is not a great baseball player, but he is a very useful player to have on a major league team because of his versatility and decent all-around game. I’m a fan because I like utility players and I like players who are super-polite and just really enjoy playing baseball. For example, this Onion satire is based largely on me:
I am also, to my knowledge the only person on Earth who owns this article of clothing:

I’m weird, okay, let’s move past it. Let’s talk about Don Kelly’s 2013 season! Everything here is 100% true. Especially the last one.
1. Don Kelly currently has a .340 OBP, the best of his career. It is better than league average. It is also better than Albert Pujols’.
2. Don Kelly is currently walking more than he is striking out 13.2% to 12.3%. Only 7 players with 100 PA are doing that this year. Here they are:
| Name | Team | PA | BB% | K% |
| Norichika Aoki | Brewers | 316 | 8.50% | 5.40% |
| Coco Crisp | Athletics | 263 | 12.20% | 10.30% |
| Alberto Callaspo | Angels | 226 | 9.30% | 7.50% |
| Marco Scutaro | Giants | 284 | 7.70% | 6.70% |
| Don Kelly | Tigers | 106 | 13.20% | 12.30% |
| Munenori Kawasaki | Blue Jays | 183 | 13.10% | 12.60% |
| Dustin Pedroia | Red Sox | 345 | 12.20% | 11.90% |
3. Only 5 players have a higher wRC+ in June than Don Kelly (min 10 PA), if I gave you 100 guesses and no internet access, you wouldn’t guess more than one. Here they are:
| Name | Team | PA | wRC+ |
| Zoilo Almonte | Yankees | 14 | 345 |
| Chris Herrmann | Twins | 12 | 303 |
| Matt Tuiasosopo | Tigers | 21 | 273 |
| Gerald Laird | Braves | 13 | 265 |
| Wil Nieves | Diamondbacks | 17 | 243 |
| Don Kelly | Tigers | 19 | 241 |
4. Don Kelly is hitting 102 wRC+ on the season. That’s better than league average.
5. With runners in scoring position (RISP) this season, Don Kelly is 3rd in batting average (min 20 PA). Only Miguel Cabrera and Allen Craig are better.
6. With RISP this year Don Kelly has a .561 OBP. Only Miguel Cabrera is better. In baseball, not just on the Tigers.
7. He’s also 7th in SLG with RISP.
8. By wRC+, the best all around offensive rate stat, Don Kelly is the 2nd best hitter with RISP this season (min 20 PA) with 264 wRC+. Only Miguel Cabrear is better. Again, in baseball, not just the Tigers.
9. Don Kelly is having a good all-around season, but has decided to be superhuman with men in scoring position:
| AVG | OBP | SLG | wOBA | wRC+ | |
| Bases Empty | 0.220 | 0.339 | 0.380 | 0.322 | 101 |
| Men on Base | 0.244 | 0.340 | 0.390 | 0.327 | 104 |
| Men In Scoring | 0.444 | 0.565 | 0.778 | 0.561 | 264 |
10. Don Kelly has been in five 3-0 counts this season. He has walked every time.
11. Kelly has come in to pinch run 3 times this season. He scored twice.
12. When the game is tied, Don Kelly hits .360/.407/.560.
13. At home, Kelly hits .282/.391/.513.
14. Don Kelly has only 3 HR this season, but they have come against pitchers who collectively allow 1 HR every 50.65 batters. League average is 1 HR every 37.86 batters. The pitchers are Samuel Deduno, Justin Masterson, and of course, Yu Darvish.
15. Don Kelly has played all 9 positions in his career. No other active player has done that. Inge just needs to pitch. I was at this game, after insisting to my mother that we shouldn’t leave.

16. This is a picture of Don Kelly and his wife, Carrie. She is Neil Walker’s sister. Those are her parents. She’s is both beautiful, and given what I know about Don, likely a very lovely woman.

17. Don Kelly once lifted Prince Fielder. He is the only person in recorded history to do so.

Evaluating Defense: Web Gems or Advanced Metrics
I’m a huge believer in the value of defense in baseball and I’m also someone who believes in advanced statistics in baseball. You might already know that if you’re a regular reader. Some of the typical advanced stats regarding defense are Defensive Runs Saved (DRS), Ultimate Zone Rating (UZR), and UZR’s close cousin UZR/150 which scales that number based on a full season of games.
Critics and proponents alike will tell you these numbers aren’t perfect and do not always predict true skill in small samples, but they are reasonably good compared to any other defensive statistic we have and they are created by people watching baseball, not a computer algorithm. So they’re the best measure of defense we have even if there are flaws.
But another measure of defense is the number of spectacular, eye-popping plays. This measure is called the Web Gem and is brought to you by the people at Baseball Tonight.
Mark Simon, an ESPN Stats and Info researcher, often posts Web Gem data on Twitter and I’ve been wondering about Web Gems and advanced stats for a while. Today I stopped wondering and started doing. Here’s Simon’s most recent tweet regarding team level Web Gems:
Now if you’re a real scientist who knows about probability and stuff, you know there are a couple flaws in what I am about to do. Let me get them out of the way quickly:
- Web Gems are conditional what happens on a given day, the 6th best play (not a gem) on Monday might have been 1st on Tuesday (a gem) but due to the random distribution of gems, it doesn’t qualify even though it should.
- Terrible defensive plays don’t count against you in Gems, but do in DRS/UZR
- Team numbers aren’t best, but it’s all I have. A team’s defensive quality can vary, so if one play accumulates all of your gems they can still only account for a fraction of your DRS/UZR
So recognize that these are issues, but also ignore them for now because this is supposed to be fun and merely to satisfy my curiosity.
How well do Web Gems predict defense? Does a small number of great plays predict overall defensive value? The short answer, no. Not at all. Here is Web Gems plotted against DRS, UZR, and UZR/150.

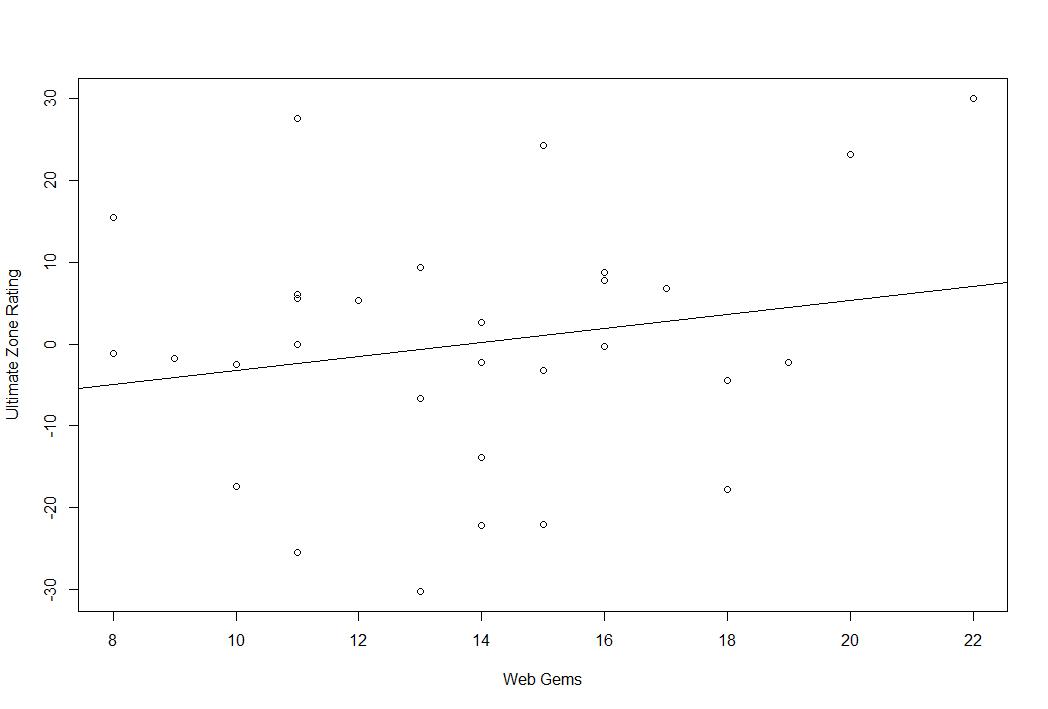
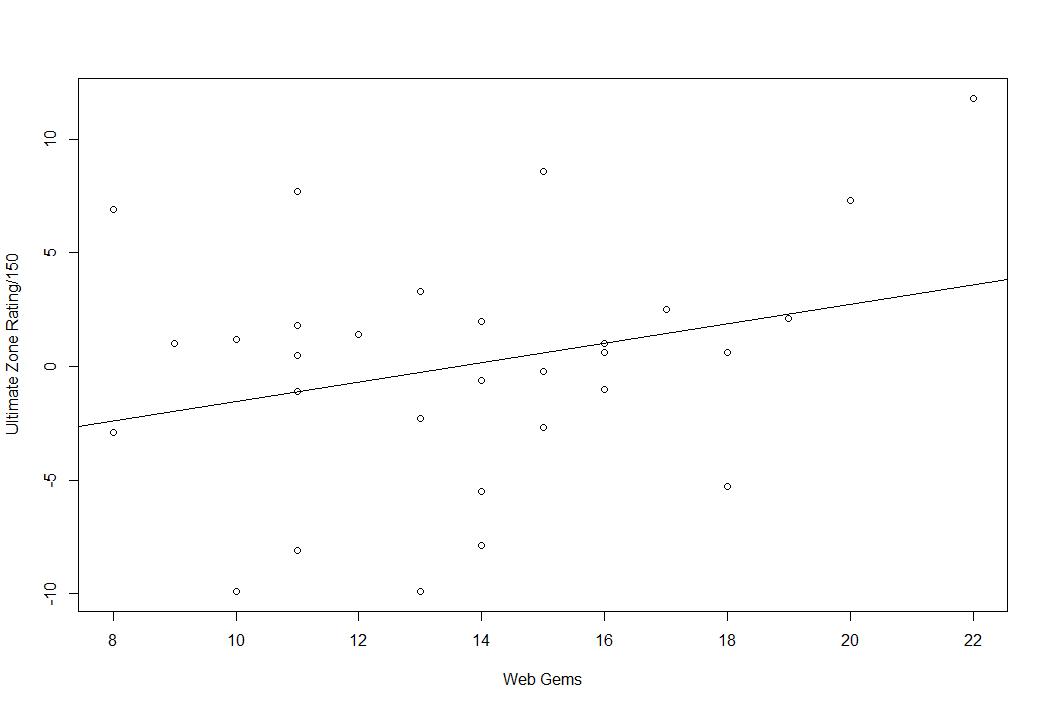
You may notice the line slops upward in each graph, meaning that as Web Gems increase, so too do the various metrics, but a positive slop doesn’t mean it’s a real effect. That’s just the line of best fit. In reality, these lines are not statistically significant. In fact, they are almost as insignificant as something can be (I know that’s bad statistical theory, it’s poetic license).
Here are the slope coefficients, standard errors, and adjusted r squares:
| WEB GEMS | DRS | UZR | UZR/150 |
| Parameter Estimate | 1.70 | 0.86 | 0.43 |
| Standard Error | 1.30 | 0.80 | 0.27 |
| Adjusted R squared | 0.03 | 0.00 | 0.05 |
As you can see, the adjusted r squares for each of these are remarkable tiny. In layman’s terms, what you are seeing here is this. More Web Gems, on average, mean higher DRS/UZR, but this is almost surely due to random chance. Web Gems also explain less than 10% of the overall variation in the defensive stats.
Basically, the takeaway here is that overall team defense is not related to a team’s overall number of Web Gems. That might not interest you, but I was curious. I’d like to do it with every player in the league, but I don’t have complete individual Web Gem data and I think the very high number of zeroes would probably make it a giant mess. I’m not sure.
But my curiosity has been satisfied and I feel better knowing that the ability to make ridiculous plays is not strongly related to the overall ability prevent runs.
