How Was The Game? (August 7, 2013)

A giant mess, but with a great ending.
Tigers 6, Indians 5 (14 innings)
Doug Fister (23 GS, 149 IP, 3.50 IP, 3.29 FIP, 3.2 WAR) didn’t match the brilliance of his previous two outings, but he gave the Tigers 6 innings of 7 hit, 2 run, 2 walk (1 HBP) and 8 strikeout baseball. He made a few mistake pitches but holding the Indians to 2 runs in 6 innings is nothing at which to sneeze. Unfortunately, Danny Salazar was the story on the other side. Iglesias singled in a run early and Jackson hit a solo homerun but the rookie overpowered the Tigers for most of the evening. That is, of course, until he was allowed to face Miguel Cabrera with a man on base in the 8th inning down a run. That didn’t end well for Salazar or the Indians as Cabrera effortlessly swatted a go-ahead bomb to right center field. Unfortunately, the Tigers gave one back in the bottom half and left us with the score tied entering the 9th. Extra innings were a blur of failed strategy and excellent pitching. I must have dozed off because I recall Jeremy Bonderman pitching and pitching effectively. It all came crashing down on the Indians in the 14th on a two run double from Fielder that scored Jackson and Perez. The win is the Tigers 11th straight, 15th of 16, and 24th in their last 31. They are 22 over .500 and now lead the Central by 6 games with just 4 left against Cleveland the rest of the way. They’ll go for the 4-game knockout sweep on Thursday with Max Scherzer (22 GS, 151.1 IP, 2.85 ERA, 2.71 FIP, 4.5 WAR) on the mound.
The Moment: Cabrera drives a game-winning homer to right center or…. Fielder doubles in the winning runs?
Should We Worry About Jackson?

In an all-around sense, Austin Jackson is an excellent baseball player. He’s well above average in the field no matter what statistic you look at or if you’re just a person with eyes and he’s also very good on the bases. His offense will be the difference between solid-starter and perennial all-star, so it will be the subject of this post.
The origin of the analysis comes from a Tweet sent out challenging the author:
While Cam and I are friends and he’s an occasional guest on New English D Audio, he’s hit on my role in the Tigers blogging community. Apparently, I’m the guy who finds out what’s wrong with players and tells you if you should worry or not. That’s fine, I’m on board. So first, is anything wrong with Jackson?
He’s on pace for something like a 3.5 WAR (what’s WAR?) season, which is very good, but it’s not quite like the 5.2 mark he posted a year ago. As I said before, the defense and baserunning are in line with his normal production, so it’s all about the bat (once we’ve corrected for his DL time).
Let’s start with some simple season by season comparisons of his AVG, OBP, and SLG and then we’ll use wRC+ (what’s wRC+?) to compare him to league average. Remember 100 is average and every point above or below is that percent better or worse than average.
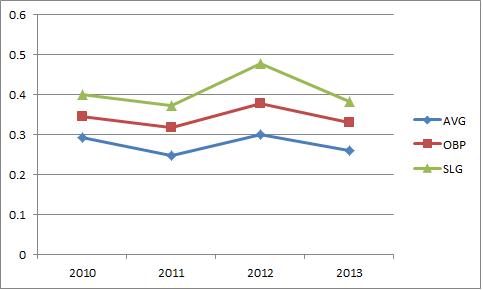

So the basic story is pretty clear. In the context of 2012, this year looks bad. In the context of the rest of his career it looks fine. Is he around average or is he a star? That’s our basic question. He’s been a very high BABIP guy (what’s BABIP?) in his entire career and these overall numbers trend along with BABIP.

So the issue with Jackson is that he’s hitting below his established BABIP. Now BABIP is a pretty fluky stat in small samples, but line drive hitters are usually above average in this department and he has always been a guy who maintains a big number. He’s closer to average (about .300) this year than ever before. Is that to blame and is that his fault?
Let’s consider this season in particular because I think it’s interesting. I don’t think it’s been all bad, I think we’re looking at a slump of some kind. Let’s check out his monthly splits. Remember he has fewer May and June PAs because of the injury:
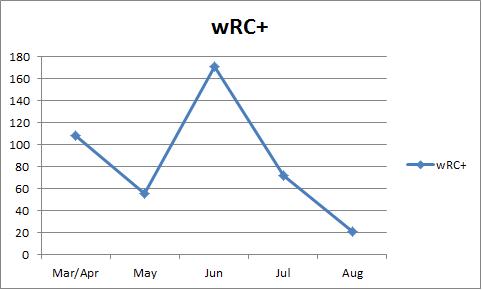 He hit well in April, struggled a little in May before the DL stint, played well at the end of June and hasn’t been great at all in July and August. Since July 1st, he’s hitting .215/.257/.356 (.280 BABIP). That’s not very good. Before July 1, he was .290/.374/.401 (.348 BABIP), which is very good for a CF, especially one who plays the rest of the game so well.
So the question is this. Is the first half Jackson the real one or is the second half Jackson the real one? Or is it the combination of the two?
My take is this. Jackson is a high BABIP guy who gets a lot of his value from getting more hits on balls in play than most, so he is susceptible to slumps based on luck. And sometimes those things snowball. I think he’s a good hitter, who will occasionally have these struggles. Let’s take a look at the batted ball data:
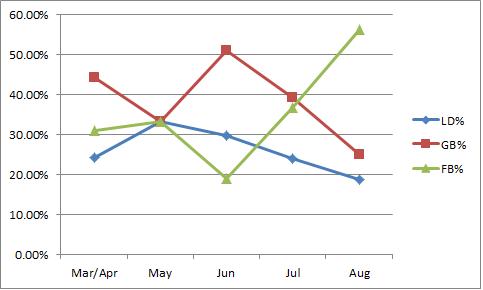 So keep in mind the varying sample sizes. Look at April and July most carefully. He’s hitting the ball in the air instead of hitting in on the ground and on a line. Remember what I said about BABIP and line drive hitters. Jackson will be more successful when he hits line drives and ground balls, so this correlates perfectly with the results. Jackson is performing worse because his BABIP is lower which is lower because he’s hitting the ball in the air more often. This is pretty straightforward, so now the question is if this is something Jackson is doing differently or if it’s just random noise that will correct itself.
I will point out that some of this is strikeouts, but not all of it. He was a 17.8% K guy in April-June and has been a 27.4% K guy since. But BABIP is only about balls in play. I’ve looked at the swing charts between the two periods and I don’t see a huge difference. If you look a spray charts, you see something of a difference:


He’s hitting fewer balls to the middle of the field and is using left and right more often since July 1. Remember the sample size is different, but the void up the middle is clear. Jackson is striking out more, but he was well below his career average entering July so you had so expect some change. As for the balls in play, it looks like he’s hitting the ball in the air too much and not back up the middle as much. To me, this is just an approach thing that needs a little work.
Jackson has the contact and pitch recognition skills to square up a ball, he’s just not doing it right now. With a little work with the hitting coaches, he should be able to get himself back on track. His swing can get long at times, and I think that’s all this is. Baseball players will go in and out of this kind of thing.
To me, it doesn’t look like this is basic random variation. I think there is something a little off with his approach, but it doesn’t look like something he can’t fix. We’ve seen him come out of stretches like this without a problem. Despite the streak, he’s still a league average hitter and an above average everything else.
Jackson is slumping a little, but nothing that can’t be fixed.
A Quick Verlander Release Point Recap
About two weeks ago I wrote a piece explaining how Verlander’s troubles this season can be chalked up to his inconsistent release point. You can read the entire thing here, in which I lay out the problem in the results, the causes of those problems, and the root cause – release point – that is behind the whole thing. I’ll trust that you’ll believe me or go back and read that piece so I don’t have to repeat myself here.
It’s August 6th and Verlander just twirled 8 excellent innings against the Indians and the initial thing that will catch your eye is his increased fastball velocity (average 96.9, top 100.8). But as you know, I’m not interested in the velocity issue, I’m interested in his release point. So how’d it look?
First, let me show you full season graphs from 2012 and 2013 to get you up to speed on what we’re looking for (from catcher’s perspective):


The difference is obvious. In the initial post I isolated it by pitch type, but let’s just keep it going. You’ll notice our goal is to keep everything to the left of the imaginary -1.5 line. You want the data points between -2.5 and -1.5. That’s the sweet spot. Also between 6 and 7 feet vertically, but that hasn’t been an issue this year.
How’d he do tonight?
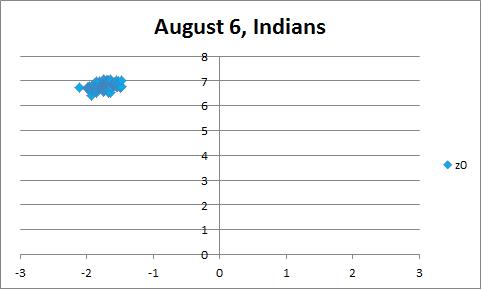
First allow me to apologize for using a different plotting source. The graphs above are from FanGraphs, which won’t update until tomorrow. Below is from Brooks Baseball. I’ll make two notes. One, I’ve looked at the actual numbers from the source and they confirm the graphic. Two, I’ve drawn in the lines of interest because I’m a super helpful guy.

The danger zone is empty. If you look at the source data, there are a couple points that are technically less than an inch over the -1.5 line, but the first two graphs aren’t super precise, so that’s not an issue. I would also like to point out, that thanks to reader suggestion, I checked to see if the Cleveland Pitch F/X setup could be influencing these results. Comparing Sanchez’s start on Monday compared to his last start at Comerica Park showed no systemic bias. In fact, if anything, my exploration of other Sanchez starts indicates that the Cleveland setup might actually be working against Verlander in the example I’m about to show you. I’m not going to wager my life savings on this, but JV’s improvement seems to be showing up despite any sort of technical issues.
If you take a look at the movement charts, there is still room left to improve. The curveball had nice depth, but it needs more horizontal tilt. That said, the velocity is up and the release point looks great. I’m encouraged. The process was good and the results were there against a very good offense. Want more evidence? Below I’ve done the plotting myself for consistency. The first is a terrible start against the worst offense in the AL, the second is tonight against the very good Indians:

Need I say more?
Guys, I think he’s back. The American League is on notice. (Editor’s note: The velocity and release point gains carried into his next start. Details here)
How Was The Game? (August 6, 2013)
Filled with everything you could ever want.
Tigers 5, Indians 1
So let’s recap what happened tonight. Justin Verlander (24 GS, 151.2 IP, 3.74 ERA, 3.32 FIP, 3.5 WAR) had one of his best starts since April with excellent velocity (96.9 MPH average FB, up to 100.8 MPH), terrific command, and a full helping of breaking pitches that allowed him to spin 8 innings of 4 hit, 1 run, 0 walk, 1 HBP, and 7 strikeout ball. Also, the Tigers extended their winning streak to 10 games and pushed their lead in the Central to 5 games. There was also the matter of Don Kelly being amazing with a 3-4 night that included the stomach punch homerun against Masterson. At the risk of being called for using a double negative, there simply wasn’t anything not to like. Verlander was great, Don Kelly led the way, and the Tigers won. That’s the whole story and it’s all you need. The Tigers will call upon Doug Fister (22 GS, 143 IP, 3.52 ERA, 3.26 FIP, 3.1 WAR) to clinch a series victory on Wednesday.
The Moment: Don Kelly turns on one in the 5th, sending it into the seats.
The Anatomy Of A Winning Streak
With a thrilling victory on Monday night, the Tigers pushed their season long winning streak to 9 games as they recorded their 13th win in their last 14 games. Based on a quick Baseball-Reference search, it looks like this is the 52nd 9 game winning streak in Tigers history. Now this includes the first 9 games of a 10 games streak and games 2-10 of that same streak, but a nine game streak is a nine game streak. By the same method, there are 24 10-game streaks. 12 11-game streaks. 7 12-game streaks. 4 13-game streaks and just 2 14-game streaks, which stand as the team record.
The 1909 and 1934 Tigers won 14 games in a row. The current Tigers are at 9. That’s five games, which is an eternity in winning streak years. It’s unlikely the Tigers will get there, but for now let’s just appreciate the ride on which we find ourselves.
They’ve scored 52 runs and allowed just 12, good for 5.8 runs per game and 1.3 runs per game allowed. The streak includes a three game sweep of the Phillies, a two game sweep of the Nationals, a three game sweep of the White Sox, and a win in Cleveland.
The first 8 games were at home and they sold out each one. They’ve gained just one game in the standings because the Indians have played well, but they started this streak with the a .554 winning percentage (89 win pace) and are currently sitting at .591 (95 win pace). The Tigers have won 95 games twice in the last 8 years, but haven’t won more since 1987.
When the streak began the Tigers had outscored their opponents by 99 runs, which was second best in baseball. They’re still second to the Cardinals, but now they’ve added 40 runs to that total.
First it was a pitcher’s duel. Then a blowout. Then another. Then they faced Strasburg and it looked close until Avila sent a grand slam deep into the night. The Tigers rocked Gio Gonzalez, snuck past Hector Santiago, Scherzer pitched a gem, and then the Tigers rallied back to win in extras after nearly giving it away. And then came the 9th inning comeback capped by an Avila long ball in Cleveland. (Sensing a theme?)
During the streak, the starting pitching has been great. But not just collectively, individually:
- Fister: 16 IP, 0.56 ERA, 2.23 FIP
- Scherzer: 13.2 IP, 0.00 ERA, 1.80 FIP
- Porcello: 13.2 IP, 2.63 ERA, 3.63 FIP
- Sanchez: 14.2 IP, 1.84 ERA, 3.11 FIP
- Verlander: 6 IP, 1.50 ERA, 3.54 FIP
And let’s recall that Miguel Cabrera hasn’t played much of a role in this whole affair. He’s had just 15 PA in the last 9 games. Sure he’s hit .385/.467/.615, but that’s no better than his season pace. Beyond that, Price Fielder’s 39 PA have turned in a .176/.282/.235 line. And Austin Jackson is hitting .179/.238/.308. The guys who should be the Tigers’ 3 best offensive players haven’t done anything during this streak either with poor performance or not being on the field.
It helps that Alex Avila has 32 PA in that span and is hitting .300/.344/.700. The erstwhile shortstop, Jhonny Peralta, hit .345/.406/.621 in 32 PA. Andy Dirks has posted 21 PA of .294/.429/.353. Torii Hunter has 29 PA with a .429/.414/.750 line (notice how his OBP is lower than his BA, fun!). And Victor Martinez is par for the course with 38 trips to the plate of .382/.447/.441.
The Tigers have won on the backs of great starting pitching and the bottom of the order. Tuiasosopo isn’t getting hits, but he’s got a .350 OBP in that span. Ramon Santiago’s fill in time has offered him 31 PA and he’s rewarded the Tigers with .400/.467/.480. Pena only has 7 PA, but he has a 1.429 OPS in that span.
Think about it, the Tigers have won 9 straight games with only 15 PA from Cabrera and no production from Fielder or Jackson. You can’t win more than 9 of 9 but the Tigers could be performing even better. The top of their order hasn’t been itself and they’re still running over the competition.
The strength of this team is its starting pitching, but the offense is also baseball’s best. The bullpen has pitched 20 innings and has allowed just 2 earned runs (0.90 ERA). They’ll never be a premium defensive team, but they’ve made some very nice plays and have committed just 2 errors during the streak.
What you’re watching is the peak of the 2013 Tigers. They have the best offense and best staff in baseball, good for the highest number of wins above replacement (what’s WAR?) of any club in the sport. As it stands, only the Pirates have fewer losses than the Tigers and only 4 clubs have higher winning percentages carried by playing more games so far.
The Tigers came into the season with big expectations and a bad taste in their mouths. They’ve played well the whole way, but you’re finally watching the correction between the underlying performance and the won loss record. Baseball Prospectus calculates something called 3rd Order Wins, which projects how many games you should win based on their underlying numbers and no one is better than the Tigers in that department. The real wins are catching up. The streak helps, but the overall stretch helping.
It’s not just 9 of 9. It’s 13 of 14. It’s 22 of 29. The Tigers have been on a role for a month. In the early Jim Leyland years, the Tigers were notorious for second half collapses, but in the last 3 seasons they’ve turned it on. In 2011 they won 12 straight to put the division away. Some called that the anti-collapse. Last year they finished strong. They’re doing it again.
The came 4 wins short of a title in 2012. 2013 looks like a team built to do it again and maybe even go a little further.
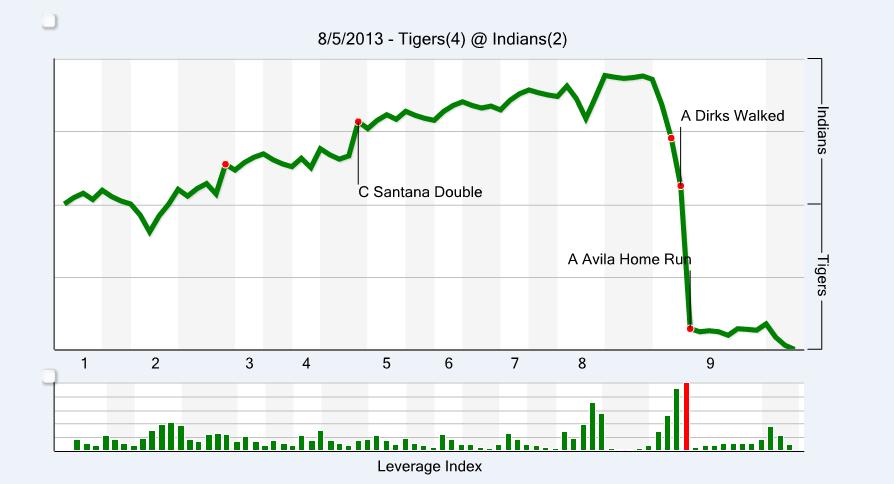
How Was The Game? (August 5, 2013)
A sign that all good things don’t have to come to an end.
Tigers 4, Indians 2
You can’t win them all, but the Tigers just might. They got an excellent outing from Anibal Sanchez (19 GS, 118.2 IP, 2.58 ERA, 2.36 FIP , 4.1 WAR) who went 7.2 innings, allowing 4 hits, 2 runs, 2 walks, and 11 strikeouts. The bats weren’t able to back Sanchez’s gem and two key baserunning mistakes, one by Hunter in the first and one by Jackson in the eighth, kept the Tigers from cashing in on their opportunities until they unloaded in the 9th. Fielder doubled, Martinez singled, Dirks walked, and then Alex Avila stepped in and sent Chris Perez to the showers with a homerun to eruption from the Tigers bench and faithful in Cleveland. This win probability graph from FanGraphs tells the entire story:
The win is the Tigers’ 9th in a row, 13th in their last 14, and pushes them to 20 games over .500 and 4 up on the Indians in the Central. They’ll celebrate this one and get ready for Tuesday’s game that features Justin Verlander (23 GS, 143.2 IP, 3.88 ERA, 3.41 FIP, 3.1 WAR) facing the Indian’s Justin, this one called Masterson.
The Moment: Avila puts the Tigers ahead in the 9th with a 3 run HR.
MLB Suspends Jhonny Peralta

On Monday, MLB finally let the other shoe drop and suspended more than a dozen players for their connection to Tony Bosch’s BioGenensis clinic. I won’t rehash the story, you know the deal. We learned today that Peralta was suspended and accepted a 50 game ban for his connection to the PED distributor Bosch. Barring rainouts, he will be eligible to return to the field on September 27th in Miami, ironically, for the final 3 games of the season. At this point, we have no specific information about what evidence MLB found regarding Peralta but he issued this statement:
“In spring of 2012, I made a terrible mistake that I deeply regret. I apologize to everyone that I have hurt as a result of my mistake, including my teammates, the Tigers’ organization, the great fans in Detroit, Major League Baseball, and my family. I take full responsibility for my actions, have no excuses for my lapse in judgment and I accept my suspension.
“I love the fans, my teammates and this organization and my greatest punishment is knowing that I have let so many good people down. I promise to do everything possible to try and earn back the respect that I have lost.”
The direct impact on the Tigers is clear. Peralta was having a great season, providing 126 wRC+ (what’s wRC+?) and 3.7 WAR (what’s WAR?), essentially functioning as the team’s second best everyday hitter overall. The Tigers have baseball’s best offense and the loss of Peralta isn’t a crippling blow, but it certainly isn’t ideal. He’ll be replaced with defensive wizard Jose Iglesias who should be able to make up a decent amount of Peralta’s lost value with his defensive skills because we’re only talking about 50 games.
Now we know. The uncertainly surrounding his situation is over and we can get on with our lives. Peralta did something against the rules, it seems, and will take the punishment for that infraction. I’ve been outspoken about this issue over the last few months in saying that the evidence that has been made public is extremely flimsy, but hopefully we’ll be able to get a better idea of what MLB has on these players that resulted in these suspensions now that the reckoning has come. I’ll reserve full judgement on their character until everything is made public.
For now, I’ll say this. Jhonny Peralta broke the rules. He cheated. I don’t know what he took. I just know his actions were enough to result in a suspension from MLB. But we should remember that taking PEDs isn’t some sort of giant affront to the Gods. These aren’t players who harmed others, drove drunk, or did anything to endanger anyone. They didn’t steal or abuse. They cheated, but we’re talking about taking a drug to make yourself better at a sport. Let’s not lose our heads.
I don’t mean to sound like I’m defending Peralta. I’m not. He did something wrong and it will hurt his team. My team. But I don’t think he’s a bad guy because of it. I imagine a lot of fans, if given the chance to take an illegal drug that would turn them into superstar athletes, would hardly think twice.
The only reason I can guarantee you that I wouldn’t is because I’m terrified of side effects and would never be able to take PEDs without giving myself debilitating panic attacks. Aside from that, I understand the temptation.
I’m not sure how much PEDs help baseball players. It’s not really a game of strength. I imagine in helps, but I don’t think you can take a nobody and make him a star with a few injections. Maybe it turns a AAA guy into someone who sticks in the show, but that’s about it. Peralta deserves what he is getting, but the reaction to PED use is really disproportionate to the offense.
This is a sport that has no punishment for drunk driving. It’s a sport that glorified the long ball after the 1995 strike. I want PED users punished and I want these punishments to deter others. It’s good for baseball, and it’s especially good for young athletes who won’t damage their bodies taking dangerous drugs. I don’t want sports to be a chemically enhanced freak show, but where is the line? Countless pitchers have a ligament from their leg implanted into their elbow. What about cortisone?
We’ve created an atmosphere that is so competitive and so cutthroat that guys will do anything to get ahead. Millions of dollars are at stake. I know people are upset about the validity of records and the tradition of the game, but some of our most hallowed records were set in an era in which only white people were allowed to play the sport. Not everything is so sacred.
I guess my point is this. These guys are rule breakers. They’re not horrible criminals. They are people with flaws who sometimes give into temptation and skirt the rules to get ahead. That’s wrong, but we’re not talking about a deadly sin here. The problem is with us if we expect our stars to perfect. If we demand perfection, we are asking to be deceived.
Give these guys a break, They’ll do their time. They’ll take the hit. They’ll be tested and scrutinized more in the future. That’s on them. But spare me the moralizing. You’ve all done things that were less than honorable.
What actually gets me isn’t that Peralta cheated (and I honestly don’t care much about the rest of them). What gets me is that Peralta put the Tigers in this position. Maybe the drugs made him better, but they also put him at risk to miss 50 games and the team will miss him for those 50. They probably don’t need him, but they might. It’s not really like he quit on us, but it’s a little bit like that.
I’m mad at him, but I forgive him. And I understand, but I’m furious.
I really don’t know how I’m supposed to feel. I’m upset for the career minor leaguers who did it clean and can’t break in, but I’m also really envious that they were blessed with enough talent to make it that far. Peralta’s the bad guy, but he’s not a bad guy. He made a very human mistake, he apologized, and took full responsibility.
It really comes down to this. He shouldn’t have done it, but it’s not as bad as most people will make it out to be. I don’t know when it happened, but somewhere along the way I lost my innocence. It’s probably been eroding for a long time. But I don’t have it in me to get worked up about this. Professional athletes are guilty of so much worse, why bother drawing our lines in the sand on this one issue? Where was the outrage about players who got arrested for DUI? How about the players who committed violence against women? Heck, what about the players who get in fights on the field?
I guess what I’m saying is I’ve outgrown getting angry just for anger’s sake. BioGenesis has been more annoying than anything else. I want it to be over and I don’t really care what the outcome is. I want the focus to be on the field. Peralta is to blame for taking himself off the field, but that doesn’t mean we need to follow him around while he’s gone and call him names.
I don’t expect people to be perfect and I won’t fault them when I find out they’re not. Maybe I’ll feel differently in 10 years and I know I felt different 10 years ago, but this is just part of life you have to accept. People do bad things and if you get worked up about all of them you’ll miss all the good things people do. Yeah Peralta did something stupid, but instead of spending our time on that, why don’t we glorify someone who did something great?
That’s what I’ll be doing and I’d love it if you would join me.
Reader Question: Cashing in Multiple Runners
I love finding answers and solving problems, which makes writing about baseball so rewarding. There are many questions and tons of information, and occasionally a reader sends in a question they’ve been wondering about but haven’t had the time or ability to figure out. This post seek to answer one of those questions, and I hope it encourages more. Last week, at a reader’s request I examined Torii Hunter’s defense. Today, I’m looking into a more complicated question.
So I’ll set the stage. Reader Dennis asked if there was anything to a team being able to driving in multiple runners with singles, doubles, and triples. His claim was that it seemed like the Tigers seemed to only score one run at a time (except on HR) early in the 2012 and he was wondering if there was anything to a team being able (or unable) to get hits that scored multiple runners.
Dennis rightly recognizes that this is a context dependent statistic like RBI, but his question centers around a team’s ability to score runs rather than judging an individual player based on his role in the run scoring process. I wasn’t really sure what I would find, but someone asked a question nicely and I couldn’t resist.
Let’s start with a simple calculation. Let’s just look at the team’s batting average on balls in play (BABIP) from 2012 with men on base and overall. This will tell us how often a team gets a single, double, or triple when they make contact with a ball that doesn’t go over the fence. In the first column is the team’s BABIP with men on base and the second column is the team’s total BABIP. The third column is how much worse they are with men on base.
| Team | mBABIP | tBABIP | DIFF |
| Braves | 0.285 | 0.296 | -0.011 |
| Yankees | 0.284 | 0.293 | -0.009 |
| Marlins | 0.281 | 0.289 | -0.008 |
| Cardinals | 0.31 | 0.316 | -0.006 |
| Blue Jays | 0.276 | 0.281 | -0.005 |
| Padres | 0.293 | 0.297 | -0.004 |
| Mets | 0.295 | 0.298 | -0.003 |
| Astros | 0.286 | 0.288 | -0.002 |
| Brewers | 0.297 | 0.299 | -0.002 |
| Giants | 0.313 | 0.315 | -0.002 |
| Reds | 0.294 | 0.296 | -0.002 |
| Red Sox | 0.3 | 0.301 | -0.001 |
| Twins | 0.297 | 0.298 | -0.001 |
| Angels | 0.311 | 0.311 | 0.000 |
| Dodgers | 0.298 | 0.298 | 0.000 |
| Cubs | 0.287 | 0.286 | 0.001 |
| Indians | 0.289 | 0.288 | 0.001 |
| Pirates | 0.294 | 0.291 | 0.003 |
| Rangers | 0.309 | 0.306 | 0.003 |
| Diamondbacks | 0.312 | 0.307 | 0.005 |
| Nationals | 0.314 | 0.308 | 0.006 |
| Orioles | 0.294 | 0.286 | 0.008 |
| Rockies | 0.329 | 0.321 | 0.008 |
| Tigers | 0.315 | 0.307 | 0.008 |
| Rays | 0.294 | 0.284 | 0.010 |
| White Sox | 0.3 | 0.289 | 0.011 |
| Mariners | 0.29 | 0.276 | 0.014 |
| Phillies | 0.304 | 0.29 | 0.014 |
| Royals | 0.316 | 0.302 | 0.014 |
| Athletics | 0.296 | 0.281 | 0.015 |
Interestingly enough, you’ll notice the Tigers actually got more hits on balls in play with men on base than they did overall, and therefore with no one on. Generally, you would expect a team to have a higher BABIP when men are on base because the first basemen is often out of position and the pitcher is in the stretch. But you can see with the chart that it’s actually pretty even between teams that are better or worse. There are a lot of factors involved in this that I’m not controlling for, but this is just a jumping off point. From here on out I’m going to use a case study approach because using data from all 30 teams would be very time consuming and quite difficult to present clearly. I’m going to take the 2012 Tigers and the 2012 Angels (who scored more runs in a more pitcher-friendly park) and compare how they scored their runs with respect to Dennis’ question.
Let’s start with some basic stats to get you started:
| Team | R | HR | BB% | K% | BABIP | AVG | OBP | SLG | wOBA | wRC+ |
| Angels | 767 | 187 | 7.3% | 18.2% | 0.311 | 0.274 | 0.332 | 0.433 | 0.331 | 113 |
| Tigers | 726 | 163 | 8.4% | 18.0% | 0.307 | 0.268 | 0.335 | 0.422 | 0.328 | 105 |
First you’ll notice that the Angels scored 41 more runs than the Tigers, mostly by out-slugging them and hitting more homeruns. If you correct for their ballpark advantage Angels were a better offensive club using wRC+ (what’s wRC+?) which is a statistic that measures a team compared to league average. The Angels were 8% better and the Tigers were 5% better than average correcting for park effects.
I’m using this example because the Angels outscored the Tigers and did so in a tougher park. Generally, they should have a harder time scoring runs but they scored more. Is it possible they were better at driving in multiple runs at a time or were they just better overall. That’s the question I’m looking to answer here, per Dennis’ question. Let’s just grab some quick numbers with men on base to get us going:
| Team | OBP | SLG | wOBA | wRC+ |
| Tigers | 0.349 | 0.425 | 0.332 | 107 |
| Angels | 0.335 | 0.432 | 0.329 | 111 |
Let me call you attention to this very important set of numbers. The Tigers and Angels derived similar unadjusted offensive production using wOBA (what’s wOBA?) and the Angels get a bump from their park in wRC+. But what is interesting is that the Tigers are getting more value from getting on base and the Angels are doing it with slugging. Let’s really dig deeper now.
The Tigers had 6,119 plate appearances in 2012. Of which, 912 came with more than one man on base. The Tigers had 912 opportunities to drive in multiple runs without hitting a homerun (Angels had 6,121 and 832). The question Dennis asks is how often did they do it?
Let’s break it down by outs, because it’s only fair to consider that the out profile is very important. Here the the raw numbers for the Tigers reflecting times when there were at least two men on base:
| Outs | PA | HR | Hit 1 RBI | Hit 2+ RBI | Non Hit RBI | 0 RBI Reached | 0 RBI Out |
| 0 | 171 | 5 | 22 | 7 | 14 | 20 | 103 |
| 1 | 350 | 7 | 58 | 21 | 47 | 39 | 178 |
| 2 | 391 | 7 | 47 | 26 | 4 | 52 | 255 |
And now here are the numbers for the Angels:
| Outs | PA | HR | Hit 1 RBI | Hit 2+ RBI | Non Hit RBI | 0 RBI Reached | 0 RBI Out |
| 0 | 157 | 7 | 20 | 5 | 24 | 17 | 84 |
| 1 | 299 | 9 | 51 | 19 | 39 | 26 | 155 |
| 2 | 376 | 4 | 45 | 29 | 6 | 46 | 246 |
The teams had the same number of total trips to the plate, but the Tigers had two or more men on base during 80 additional plate appearances. Let’s break this down by percentage for better comparison. What you see below is the raw number divided by PA with 0/1/2 outs. First the Tigers, then the Angels:
| Outs | PA | HR | Hit 1 RBI | Hit 2+ RBI | Non Hit RBI | 0 RBI Reached | 0 RBI Out |
| 0 | 171 | 2.92% | 12.87% | 4.09% | 8.19% | 11.70% | 60.23% |
| 1 | 350 | 2.00% | 16.57% | 6.00% | 13.43% | 11.14% | 50.86% |
| 2 | 391 | 1.79% | 12.02% | 6.65% | 1.02% | 13.30% | 65.22% |
| Outs | PA | HR | Hit 1 RBI | Hit 2+ RBI | Non Hit RBI | 0 RBI Reached | 0 RBI Out |
| 0 | 157 | 4.46% | 12.74% | 3.18% | 15.29% | 10.83% | 53.50% |
| 1 | 299 | 3.01% | 17.06% | 6.35% | 13.04% | 8.70% | 51.84% |
| 2 | 376 | 1.06% | 11.97% | 7.71% | 1.60% | 12.23% | 65.43% |
So what does this tell us? Are the Tigers bad at cashing multiple runs without a homerun? It turns out that Dennis’ perception was incorrect, at least when applied to the entire season. His comment was actually about the beginning of the season and he put it in context of the whole league and not the Angels, but presenting this data for all 30 teams would have been really hard to swallow. I picked the Angels because they scored more runs than the Tigers in a tougher park. Their offense was more successful than the Tigers, so I wanted to see if they were cashing in more effectively.
In reality, it’s just the opposite. The Angels hit more homeruns with two or more men on base than the Tigers and they drove in runs one at a time more often especially if you look in the Non-Hit RBI column. So I’ll apologize to Dennis for doing a case study instead of checking in on the entire league, but that would have just been too difficult to communicate to the readership. I worry this is already too much information.
What I find very interesting is that the Angels scored 375 of their 767 runs in these situations and the Tigers scored 374 of their 726 runs in these situations. The Tigers scored a higher percentage of their runs with multiple men on base than the Angels did despite hitting fewer homeruns.
So you can interpret this how you want to, but my guess is that Dennis was responding to a difference in baserunning ability. The Angels were about 3 wins above replacement better than the Tigers in the baserunning department in 2012 which can easily be the difference between scoring from second on singles and first on doubles on a number of occasions.
The lesson, I think, is that our perceptions are often clouded by flashpoint data. There was probably a stretch in early 2012 when the Tigers couldn’t get a hit with men on base to save their lives and that’s what Dennis remembered, but in reality, that was just part of the normal variation and the Tigers weren’t any worse than other teams in this department.
For a quick summary, the Tigers had 912 PA with two or more men on base. Let’s see how they did in each:
| PA | R | AB | 1B | 2B | 3B | HR | RBI | BB | IBB | SO |
| 912 | 374 | 782 | 157 | 49 | 3 | 19 | 361 | 76 | 15 | 155 |
| HBP | SH | SF | ROE | GDP | BA | OBP | SLG | OPS | BAbip |
| 10 | 9 | 35 | 8 | 71 | 0.292 | 0.348 | 0.435 | 0.783 | 0.325 |
And now the 832 PA for the Angels:
| PA | R | AB | 1B | 2B | 3B | HR | RBI | BB | IBB | SO |
| 832 | 375 | 711 | 146 | 37 | 3 | 20 | 356 | 63 | 11 | 149 |
| HBP | SH | SF | ROE | GDP | BA | OBP | SLG | OPS | BAbip |
| 6 | 17 | 34 | 14 | 47 | 0.29 | 0.338 | 0.435 | 0.772 | 0.323 |
The Tigers did pretty well getting hits in these situations and scoring in the way Dennis asked about and probably would have been better off driving in a few more runners with sacrifice flies. In fact you’ll notice that despite being in fewer of these situations, the Angels hit more HR and just one fewer sac fly. The Tigers cashed in with hits in play while the Angels were homering and hitting sac flies, which might be good evidence that scoring runs is scoring runs no matter how you do it. It was an interesting question and fun to look into. If you’re got questions like this, send them my way and I’ll try to fit them in.
How Was The Game? (August 4, 2013)
More of the same.
Tigers 3, White Sox 2 (12 innings)
The Tigers got another fantastic start, this time from Rick Porcello (20 GS, 120 IP, 4.28 ERA, 3.55 FIP, 2.1 WAR) who went 7.2 innings and allowed just 1 run on an Adam Dunn long ball in the 4th. Porcello continues to pitch well and improves his ERA and FIP to 3.45 and 3.23 since his laugher in LA on April 20th. He’s 16th in MLB in xFIP and continues to be baseball’s best 5th starter quite easily. The Tigers couldn’t get much going at the plate until the 7th inning when they pushed across two runs on an Avila double and Santiago sacrifice fly. Smyly got the final out in the 8th but surrendered the tying run in the 9th inning and Veras was called on to get three outs in the 9th to set up bonus baseball. Despite threatening in the intervening innings, it took a Cabrera PH single in the 12th and an eventual RBI single from Hunter to put this one away. The win is the Tigers’ 8th straight, completing a perfect homestand, and 12 wins in their last 13 games to push them 19 games over .500 with a four game set looming Cleveland starting Monday. The ball will be waiting for Anibal Sanchez (18 GS, 111 IP, 2.59 ERA, 2.46 FIP, 3.7 WAR) to start the series.
The Moment: Hunter singles in Tuiasosopo in the 12th.
The 2013 Tigers Are (Almost) The Best Rotation Ever
In mid-June I wrote that the Tigers’ starting rotation was on pace to be the best starting staff in MLB history by Fielding Independent Pitching (what’s FIP?) which is a statistic that measures the three true outcomes a pitcher has complete control over and scales it to look like ERA. Based on strikeouts, walks, and homeruns – the Tigers are on pace for an historic season.
If you don’t know much about FIP, click on the link above to see why it’s a better reflection of a pitcher’s true talent than ERA which depends a lot on the defense behind the pitcher. Another statistic, Expected Fielding Independent Pitching (xFIP), considers a pitcher’s GB/FB rate and averages out their HR/FB%, but unfortunately we don’t have batted ball data before 2002. We have FIP data all the way back to the beginning of MLB history. If we start in 1901 and run through Saturday, the Tigers have the third best FIP of all time. What I’m about to show you is FIP-, which is simply FIP adjusted for park effects and league average which allows us to compare teams in different run scoring environments. 100 is league average and a point above or below is a point better or worse than average. A FIP- of 95 is 5% better than average. Here are the top five FIP- in MLB history:
| Rank | Season | Team | FIP- |
| 5 | 1996 | Braves | 78 |
| 4 | 1997 | Braves | 78 |
| 3 | 2013 | Tigers | 78 |
| 2 | 2011 | Phillies | 77 |
| 1 | 1971 | White Sox | 77 |
Two months ago, the Tigers had a starting rotation FIP- of 64, and they’ve since come back to the pack because that would have been a crazy good number. Despite struggles from Verlander and a few bad starts from Fister, the Tigers still have the 3rd best rotation in MLB history.
They are getting contributions from everyone in the rotation, too. Here are a series of tweets I send out Saturday night about the Tigers rotation:
The rotation is deep. Here are some basic numbers:
| Name | IP | WAR | ERA- | FIP– |
| Anibal Sanchez | 111 | 3.7 | 63 | 61 |
| Max Scherzer | 151.1 | 4.5 | 70 | 67 |
| Doug Fister | 143 | 3.1 | 86 | 80 |
| Justin Verlander | 143.2 | 3.1 | 95 | 84 |
| Rick Porcello | 110.1 | 2.0 | 111 | 86 |
| Jose Alvarez | 19.2 | -0.2 | 123 | 147 |
Only Alvarez (and his 20 IP) has a FIP that isn’t at least 14% better than average and all of the main five starters have at least 2.0 wins above replacement or more (what’s WAR?). In fact, despite having an ERA a bit worse than their FIP due to some less than perfect defense behind them, the Tigers rank very well in both all time.

More teams have allowed fewer runs relative to average, but only two teams have ever done so thanks to better pitching. The Tigers aren’t a lock to set this record, but they are pitching very well right now and are currently hanging right around the strikeout rate record as well.
The Tigers are a good team top to bottom with a great offense, but their starting pitching is the flashy component. They have baseball’s best offense and best pitching staff – and the pitching staff might be one of the best all time. I’ve written a lot about the different Tigers starters and what makes them great this season. You can find every one of those pieces in our Tigers Breakdowns section along with a piece about how the Tigers are utilizing the changeup as a weapon more and more.
With 53 games to play, the Tigers are not in position to break the all-time record for FIP, but they are just 1% away from the top mark in history. With just a little better performance than they are on pace for, the Tigers could be the first team to ever have their starting staff pitch 26% better than league average for an entire season. It’s a remarkable record and one that isn’t nearly well-known enough.
National and local writers have made plenty out of the very good Tigers rotation, but with the exception of a piece by Dave Cameron at FanGraphs, I haven’t seen anyone else call attention to just how great this rotation truly is. The Tigers aren’t just pitching pretty well this season, they’re pitching better than all but two rotations in baseball history spanning more than 100 seasons.
With about two months left, this is going to be fun to watch.
