SOEFA Sunday: Reliever Rankings Update (July 14, 2013)

You’ll recall earlier this year we introduced our very own reliever rankings called SOEFA, which you can read about in detail here. For a brief refresher, it combines strand rate, expected OBP against, ERA-, and FIP- into a deviation from league average. Zero is average, and will generally range between -2.5 to 2.5. This includes all pitchers who have thrown at least 20 IP in relief. Should you wish to know the SOEFA for any other reliever, or on a day that isn’t Sunday, hit us on Twitter or in the comments section.
| Rank | Player | Team | SOEFA |
| 1 | Alex Torres | Rays | 1.05 |
| 2 | Joaquin Benoit | Tigers | 0.99 |
| 3 | Neal Cotts | Rangers | 0.97 |
| 4 | Drew Smyly | Tigers | 0.94 |
| 5 | Mark Melancon | Pirates | 0.88 |
| 6 | Greg Holland | Royals | 0.87 |
| 7 | Sergio Romo | Giants | 0.87 |
| 8 | Will Harris | Diamondbacks | 0.84 |
| 9 | Jason Grilli | Pirates | 0.81 |
| 10 | Jordan Walden | Braves | 0.79 |
| 11 | Oliver Perez | Mariners | 0.78 |
| 12 | Javier Lopez | Giants | 0.78 |
| 13 | Jesse Crain | White Sox | 0.77 |
| 14 | Sam LeCure | Reds | 0.76 |
| 15 | Glen Perkins | Twins | 0.75 |
| 16 | Kenley Jansen | Dodgers | 0.74 |
| 17 | Trevor Rosenthal | Cardinals | 0.74 |
| 18 | Edward Mujica | Cardinals | 0.71 |
| 19 | Casey Fien | Twins | 0.71 |
| 20 | Shawn Kelley | Yankees | 0.69 |
| 21 | Joe Thatcher | Padres | 0.69 |
| 22 | Craig Kimbrel | Braves | 0.65 |
| 23 | Koji Uehara | Red Sox | 0.64 |
| 24 | Brett Cecil | Blue Jays | 0.63 |
| 25 | Preston Claiborne | Yankees | 0.62 |
| 26 | Casey Janssen | Blue Jays | 0.62 |
| 27 | Kevin Gregg | Cubs | 0.61 |
| 28 | David Robertson | Yankees | 0.59 |
| 29 | Sean Doolittle | Athletics | 0.57 |
| 30 | Tommy Hunter | Orioles | 0.57 |
| 31 | Junichi Tazawa | Red Sox | 0.56 |
| 32 | Boone Logan | Yankees | 0.55 |
| 33 | Dale Thayer | Padres | 0.53 |
| 34 | Andrew Bailey | Red Sox | 0.52 |
| 35 | Francisco Rodriguez | Brewers | 0.52 |
| 36 | Edgmer Escalona | Rockies | 0.5 |
| 37 | Joel Peralta | Rays | 0.49 |
| 38 | Brian Matusz | Orioles | 0.49 |
| 39 | Manny Parra | Reds | 0.48 |
| 40 | Robbie Ross | Rangers | 0.48 |
| 41 | Sandy Rosario | Giants | 0.48 |
| 42 | Andrew Miller | Red Sox | 0.47 |
| 43 | Seth Maness | Cardinals | 0.47 |
| 44 | Ernesto Frieri | Angels | 0.47 |
| 45 | Paco Rodriguez | Dodgers | 0.46 |
| 46 | Bobby Parnell | Mets | 0.46 |
| 47 | Brandon Kintzler | Brewers | 0.45 |
| 48 | Matt Belisle | Rockies | 0.44 |
| 49 | Josh Collmenter | Diamondbacks | 0.44 |
| 50 | David Carpenter | Braves | 0.43 |
| 51 | Jason Frasor | Rangers | 0.43 |
| 52 | Aroldis Chapman | Reds | 0.42 |
| 53 | Matt Reynolds | Diamondbacks | 0.42 |
| 54 | Luis Avilan | Braves | 0.42 |
| 55 | Chad Gaudin | Giants | 0.41 |
| 56 | Steve Cishek | Marlins | 0.41 |
| 57 | Vin Mazzaro | Pirates | 0.41 |
| 58 | Grant Balfour | Athletics | 0.4 |
| 59 | Jonathan Papelbon | Phillies | 0.4 |
| 60 | Luke Hochevar | Royals | 0.4 |
| 61 | Scott Downs | Angels | 0.4 |
| 62 | Darren O’Day | Orioles | 0.39 |
| 63 | J.P. Howell | Dodgers | 0.38 |
| 64 | Chad Qualls | Marlins | 0.37 |
| 65 | Steve Delabar | Blue Jays | 0.37 |
| 66 | Luke Gregerson | Padres | 0.37 |
| 67 | Randy Choate | Cardinals | 0.36 |
| 68 | Ryan Cook | Athletics | 0.36 |
| 69 | Tanner Scheppers | Rangers | 0.35 |
| 70 | Tom Gorzelanny | Brewers | 0.35 |
| 71 | Rafael Soriano | Nationals | 0.34 |
| 72 | Brad Ziegler | Diamondbacks | 0.34 |
| 73 | Justin Wilson | Pirates | 0.34 |
| 74 | James Russell | Cubs | 0.33 |
| 75 | Addison Reed | White Sox | 0.32 |
| 76 | Antonio Bastardo | Phillies | 0.32 |
| 77 | Cody Allen | Indians | 0.31 |
| 78 | Alfredo Simon | Reds | 0.31 |
| 79 | Jim Henderson | Brewers | 0.29 |
| 80 | Tyler Clippard | Nationals | 0.28 |
| 81 | Tony Watson | Pirates | 0.26 |
| 82 | Craig Breslow | Red Sox | 0.26 |
| 83 | Jerome Williams | Angels | 0.26 |
| 84 | Fernando Rodney | Rays | 0.25 |
| 85 | Jean Machi | Giants | 0.25 |
| 86 | Rafael Betancourt | Rockies | 0.25 |
| 87 | Rex Brothers | Rockies | 0.24 |
| 88 | Caleb Thielbar | Twins | 0.23 |
| 89 | Jamey Wright | Rays | 0.22 |
| 90 | Michael Kohn | Angels | 0.22 |
| 91 | Anthony Varvaro | Braves | 0.21 |
| 92 | Jose Mijares | Giants | 0.2 |
| 93 | Josh Outman | Rockies | 0.2 |
| 94 | Yoervis Medina | Mariners | 0.2 |
| 95 | Pat Neshek | Athletics | 0.19 |
| 96 | Jose Veras | Astros | 0.19 |
| 97 | Jesse Chavez | Athletics | 0.17 |
| 98 | Nate Jones | White Sox | 0.17 |
| 99 | Greg Burke | Mets | 0.15 |
| 100 | Charlie Furbush | Mariners | 0.15 |
| 101 | Joe Nathan | Rangers | 0.15 |
| 102 | Matt Lindstrom | White Sox | 0.13 |
| 103 | Alfredo Figaro | Brewers | 0.13 |
| 104 | Aaron Loup | Blue Jays | 0.13 |
| 105 | Tim Collins | Royals | 0.12 |
| 106 | Jim Johnson | Orioles | 0.12 |
| 107 | Dane de la Rosa | Angels | 0.11 |
| 108 | Anthony Swarzak | Twins | 0.11 |
| 109 | Bryan Morris | Pirates | 0.11 |
| 110 | Matt Thornton | White Sox | 0.09 |
| 111 | Mariano Rivera | Yankees | 0.09 |
| 112 | Joe Ortiz | Rangers | 0.08 |
| 113 | Joe Smith | Indians | 0.07 |
| 114 | Tyson Ross | Padres | 0.07 |
| 115 | Ross Wolf | Rangers | 0.06 |
| 116 | Cesar Ramos | Rays | 0.06 |
| 117 | Darren Oliver | Blue Jays | 0.06 |
| 118 | Joe Kelly | Cardinals | 0.06 |
| 119 | Adam Ottavino | Rockies | 0.05 |
| 120 | John Axford | Brewers | 0.04 |
| 121 | LaTroy Hawkins | Mets | 0.04 |
| 122 | Aaron Crow | Royals | 0.03 |
| 123 | Carter Capps | Mariners | 0.02 |
| 124 | Josh Edgin | Mets | 0.02 |
| 125 | Kevin Jepsen | Angels | 0.02 |
| 126 | Jared Burton | Twins | 0 |
| 127 | Ryan Pressly | Twins | 0 |
| 128 | Danny Farquhar | Mariners | -0.01 |
| 129 | Tony Sipp | Diamondbacks | -0.01 |
| 130 | J.J. Hoover | Reds | -0.01 |
| 131 | Troy Patton | Orioles | -0.02 |
| 132 | A.J. Ramos | Marlins | -0.03 |
| 133 | Drew Storen | Nationals | -0.03 |
| 134 | Jake McGee | Rays | -0.03 |
| 135 | Tom Wilhelmsen | Mariners | -0.03 |
| 136 | Wilton Lopez | Rockies | -0.04 |
| 137 | Bryan Shaw | Indians | -0.04 |
| 138 | Luke Putkonen | Tigers | -0.04 |
| 139 | Burke Badenhop | Brewers | -0.05 |
| 140 | Mike Dunn | Marlins | -0.05 |
| 141 | Brad Brach | Padres | -0.07 |
| 142 | Ryan Webb | Marlins | -0.1 |
| 143 | Matt Guerrier | – – – | -0.1 |
| 144 | Heath Bell | Diamondbacks | -0.1 |
| 145 | Darin Downs | Tigers | -0.1 |
| 146 | David Hernandez | Diamondbacks | -0.1 |
| 147 | Logan Ondrusek | Reds | -0.12 |
| 148 | Chris Perez | Indians | -0.13 |
| 149 | Jose Cisnero | Astros | -0.13 |
| 150 | Craig Stammen | Nationals | -0.14 |
| 151 | Paul Clemens | Astros | -0.14 |
| 152 | Brad Lincoln | Blue Jays | -0.15 |
| 153 | Tim Stauffer | Padres | -0.15 |
| 154 | Joba Chamberlain | Yankees | -0.17 |
| 155 | Jerry Blevins | Athletics | -0.17 |
| 156 | Brian Duensing | Twins | -0.18 |
| 157 | Cory Gearrin | Braves | -0.19 |
| 158 | Michael Gonzalez | Brewers | -0.19 |
| 159 | Nick Hagadone | Indians | -0.2 |
| 160 | George Kontos | Giants | -0.2 |
| 161 | Scott Rice | Mets | -0.2 |
| 162 | Blake Beavan | Mariners | -0.21 |
| 163 | Wesley Wright | Astros | -0.23 |
| 164 | Rich Hill | Indians | -0.23 |
| 165 | Jonathan Broxton | Reds | -0.26 |
| 166 | Kyle Farnsworth | Rays | -0.27 |
| 167 | Garrett Richards | Angels | -0.27 |
| 168 | Vinnie Pestano | Indians | -0.3 |
| 169 | Josh Roenicke | Twins | -0.31 |
| 170 | Phil Coke | Tigers | -0.31 |
| 171 | Ronald Belisario | Dodgers | -0.31 |
| 172 | Travis Blackley | Astros | -0.32 |
| 173 | T.J. McFarland | Orioles | -0.36 |
| 174 | Hector Ambriz | Astros | -0.36 |
| 175 | Clayton Mortensen | Red Sox | -0.4 |
| 176 | Mike Adams | Phillies | -0.4 |
| 177 | Alex Wilson | Red Sox | -0.43 |
| 178 | Matt Albers | Indians | -0.45 |
| 179 | Brandon Lyon | Mets | -0.49 |
| 180 | Esmil Rogers | Blue Jays | -0.49 |
| 181 | Huston Street | Padres | -0.5 |
| 182 | Bruce Chen | Royals | -0.53 |
| 183 | Adam Warren | Yankees | -0.56 |
| 184 | Al Alburquerque | Tigers | -0.57 |
| 185 | Jeremy Horst | Phillies | -0.59 |
| 186 | Pedro Strop | – – – | -0.61 |
| 187 | Kelvin Herrera | Royals | -0.67 |
| 188 | Henry Rodriguez | – – – | -0.7 |
| 189 | Michael Kirkman | Rangers | -0.71 |
| 190 | Carlos Marmol | Cubs | -0.72 |
| 191 | Jeremy Affeldt | Giants | -0.79 |
| 192 | Anthony Bass | Padres | -0.88 |
| 193 | Shawn Camp | Cubs | -1.02 |
| 194 | Hector Rondon | Cubs | -1.05 |
| 195 | Brandon League | Dodgers | -1.65 |
The Morning Edition (July 14, 2013)
From Last Night:
- Greinke twirls a CGSO to beat the Rockies despite Chatwood’s CG, 1 ER gem.
- Davis homers again, but Orioles fall to the Jays
- Lincecum no hits the Padres, featuring 13 Ks. (Late out west, hence the lack of intense attention)
- The White Sox tops the Phillies with 2 in the 11th
- Hughes K’s 10, but gives up 4 as the Yanks fall to the Twins
- Haren and Fernandez pitch well, Marlins win in 10
What I’m Watching Today:
- Shields takes on the Indians (1p Eastern)
- Hamels tries to stay on a role (1p Eastern)
- Wainwright and Wood take the final stage before the break (8p Eastern)
The Big Question:
- Who will replace the Sunday starters and injured players on the All-Star rosters?
Enjoy the last day before the break. It’s going to be a slow few days!
12 Other Reasons To Kill The Win
Over the last few weeks I’ve been breaking down reasons to ignore the pitcher win and I think the case is pretty airtight. First I gave you the 9 best seasons under 9 wins, then I gave you the 9 worst 20 win seasons, and showed you that wins do not even out over a career. Finally, I presented a case study in wins using Cliff Lee and Barry Zito’s 2012 season. The evidence is clear, wins do not reflect individual performance and shouldn’t be used as such. But if you’re not convinced, read this and tell me what you think (all numbers for starting pitchers from 2013 entering 6/13):
- A pitcher has gone 6+ IP and allowed 0 ER and not earned a win 68 times.
- If you lower that to 5+IP and 0 ER, it goes up to 82 times.
- A pitcher has gone 6+ IP and allowed 4 or fewer baserunners and not earned a win 50 times.
- A pitcher has gone 6+ IP, allowed 4 or fewer baserunners AND allowed 0 ER and not earned a win 20 times.
- A pitcher has gone 8+ IP and allowed 1 or fewer ER and not earned a win 23 times.
- A pitcher has gone 8+ IP and allowed 1 or fewer ER and earned a LOSS 4 times.
- A pitchers has gone 5 IP or fewer and allowed 10 or more baserunners and earned a win 29 times.
- A pitcher has gone 6 IP or fewer and allowed 5 ER or more and earned a win 12 times.
- A pitcher has allowed 6 ER or more an earned a win 7 times.
- A pitcher has walked 6 or more batters and earned a win 9 times.
- A pitcher has allowed 12 baserunners or more and earned a win 23 times. Only two of them went 7 or more innings.
- A pitcher has gone 7+IP with 10+ K, 2 or fewer BB, and 3 or fewer ER and not earned a win 28 times.
So let’s review. You can have a great season and win fewer than 9 times. You can have a below average season and win 20. You can have a much better career than another pitcher and finish with the same winning percentage. A pitcher can dramatically out pitch another and have way fewer wins in a season. And finally, the above 12 things can happen…before the All-Star break.
I’ll close with this. In 2012 a pitcher went 7 or more innings and allowed 0 ER 363 times. They didn’t earn a win 57 times in those starts. Do we really care about a statistic that says a pitcher who goes 7 or more innings while allowing 0 ER shouldn’t get a win 16% of the time?
I know I don’t.
The Nine Most Average Homeruns of the First Half
Homeruns are popular. They’re valuable, but their popularity probably outweighs their actual awesomeness in my mind. That’s me. You’re welcome to have your own view. Below, courtesy of ESPN’s Homerun Tracker we have a lot of cool information about every homerun in MLB this season including distance, speed off the bat, peak height, and a number of other things.
I’m often interested in league averages and deviations from average, so this should serve as the baseline for which homers should be judged. Below is a list of The Nine Most Average Homeruns of the First Half of 2013 (excluding the final two days). To calculate the most average homers I took the percent deviations from average of distance, speed off the bat, and peak height, squared them, and summed them together. These are the homeruns with values closest to zero.
For reference: League Average Distance is 397 feet, League Average Speed Off The Bat is 103.4 mph, and League Average Peak Height (Apex) is 87.2 feet.
(Distance in Feet/MPH/Height in Feet)
9. Starling Marte, Pirates (May 4th off Stephen Strasburg)
399/101.2/87
8. Edwin Encarnacion, Blue Jays (June 11 off Jose Quintana)
390/102.4/87
7. Billy Butler, Royals (July 9 off CC Sabathia)
402/102.8/86
6. Mike Moustakas, Royals (May 8 off Chris Tillman)
398/104.7/86
5. Ryan Braun, Brewers (May 22 off Hyun-Jin Ryu)
403/102.6/87
4. Andrelton Simmons, Braves (May 6 off Bronson Arroyo)
394/103.9/87
3. Luis Valbuena, Cubs (April 19 off Marco Estrada)
398/104.3/87
2. Matt Carpenter, Cardinals (July 10 off Wesley Wright)
399/103.5/87
1. Jordy Mercer, Pirates (May 3 off Ross Detwiler)
396/103.5/87
I’m not sure how much this list can tell you about specific players, but hopefully it’s a nice demonstration about what the average homerun looks like. If you’re curious, the link to the ESPN list has video of each homerun so you can get an even better idea on video.
Craig Biggio: Double Play Escape Artist
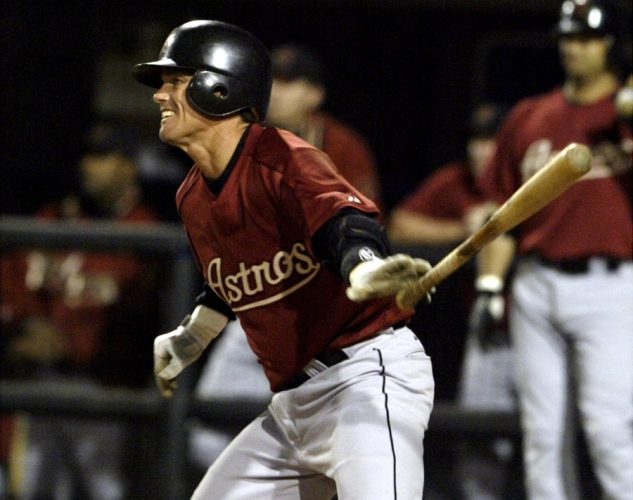
I recently wrote a piece over in the Community Research section at Fangraphs paying tribute to Craig Biggio’s amazing 1997 season. Not only did he lead the league in WAR, but he did so with one of the most balanced and complete seasons in recent memory. More interestingly, in my opinion, is that Biggio went the whole season without grounding into a single double play. In 78 chances, he hit into exactly 0 double plays. Only 7 qualifying MLB since 1939 (as far back as the data goes) have ever finished a season with zero GIDP and three did so in a strike shortened campaign.
The Morning Edition (July 13, 2013)
From Last Night:
- Price gives up 2 runs in a CG against the Astros and loses…to Jared Cosart in his MLB debut, who went 8 scoreless
- Kluber twirls a fine outing, Indians beat the Royals
- Marlins rough up Strasburg, chase him after two
- Chris Davis homers, Orioles win, lather, rinse, repeat.
- Pirates grab a walk off single in 11 against the Mets
- Arroyo shuts down the Braves, Dusty listens and drops Cozart to 7th
What I’m Watching Today:
- Burnett faces the Mets (7p Eastern)
- Lynn and Garza in Chicago (7p Eastern)
- Holland and Scherzer (7p Eastern)
- Jose Fernandez faces the Nats (7p Eastern)
- Felix against the Angels (10p Eastern)
The Big Question:
- Who are your first half ROY?
Let’s break it down by position players and pitchers. For the NL position player, Puig is a pretty good choice with his 2.1 WAR and 198 wRC+, but he’s short on games. Pollack (2.1 WAR), Gattis (1.8 WAR), Gyrko (1.8 WAR) are also good choices. It’s tough to pick rookies because you have to balance overall value and rate stats. Probably Puig, but Pollack would be a good choice too. For the AL position player it’s slim pickens, to this point it’s probably Jose Iglesias (1.6 WAR), but Nick Franklin, Gomes, and Martin have a case and they all have Wil Myers charging. AL pitching is thin, but it’s probably Straily if you want a starter, but there are a lot of good relievers too. Many the AL rookie class is weak. The NL pitchers are much more fun. Miller, Fernandez, Ryu, and Teheran. I love Shelby Miller, but Fernandez right there.
The Morning Edition (July 12, 2013)
From Last Night:
- Salazar impresses and helps beat the Jays in his debut with the Indians
- Reds lose to the Braves with Votto waiting on deck…again
- Kendrick squeaks past Zimmermann and the Nationals
- Both starters stumble, Red Sox beat the Mariners in 10
- Jeter returns to the Yanks, national media doesn’t spend much time talking about it
- Moore K’s 10 in 7.1 innings as he’s named to the ASG
- Tulo’s back!
What I’m Watching Today:
- Cosart makes his MLB debut against Price (7p Eastern)
- Strasburg heads to Miami (7p Eastern)
- Corbin goes against the Crew (930p Eastern)
- Kershaw welcomes the Rockies to LA (10p Eastern)
The Big Question:
- Does the media see the irony?
So recently there have been a number of things written about MLB’s problem getting good national TV ratings and some people have suggested more playoff teams and other stuff I don’t think will be a good idea, but today was the perfect example of how the media is responsible for the problem. Two shortstops came back from injuries today to help their clubs who are on the edge of the postseason race. 99% of the coverage was about Jeter and almost none was about Tulowitzki, who is one of the most dynamic players in the game. I don’t have anything against Jeter, and he’s had a wonderful career, but if you’re wondering why national ratings are down, it’s because the national media recycles the same tired stories about the same 3 or 4 teams. It’s time for Fox, ESPN, and MLB to plug players on smaller market clubs. Tulowitzki could easily be the face of MLB, but you don’t see many Rockies games on national TV.
Zack Cozart Can’t Hit Second
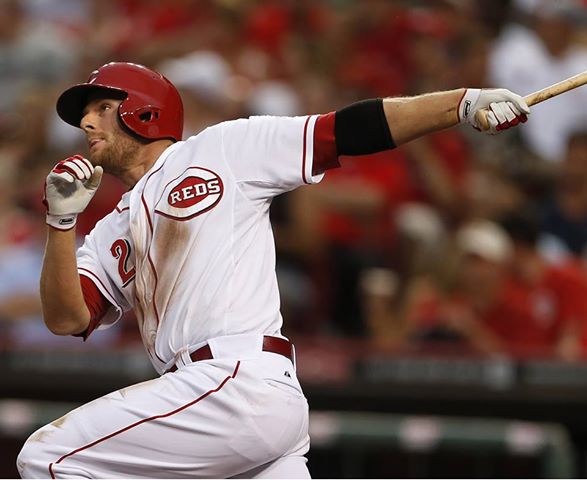
If you’re familiar at all with the program MLB Now, you know that it usually includes a segment in which Brian Kenny and Harold Reynolds argue about Dusty Baker. Sometimes it’s about how he uses his 9th inning reliever, Aroldis Chapman. Sometimes it’s about who should hit 4th in the Reds lineup. Thursday, it was about Zack Cozart and his time in the number two spot in the batting order.
During this edition, Eric Byrnes was filling in for Kenny, but he did a nice job making the point Kenny would have made. Zack Cozart cannot hit second. Reynolds provided three arguments for why he should hit second, including that he wants to hit his middle infielders at the top of the order to get them into the game early, Cozart can bunt, and that Cozart would be unsuccessful hitting anywhere else. I would like to address HR’s arguments and then make a very clear case of my own as to why Zack Cozart cannot hit second for the Reds.
Responding To Reynolds
Reynolds “next-level” argument about getting Cozart an at bat so that he is more ready in the field is actually the most persuasive because I can’t refute it with evidence. There might be something to this, but Cozart is a very good defensive player and I have a hard time believing that he isn’t prepared to make plays regardless of when his first at bat comes (plus Byrnes wanted to put the 2B there, so it seems like that should offset). I suppose we could do an analysis about the distribution of errors depending on lineup order, but I’m not going to bother because I think the rest of the argument is strong enough not to sweat it.
Second, HR wants Cozart there because he can bunt, which moves Choo over for Votto, so that Votto can drive him in. This is a silly argument. First of all, despite Choo’s great OBP, he’s still only on base 40% of the time and sometimes those hits are doubles and homers, so he’s on first even less often. Second, some of those cases will be with two outs and the sacrifice bunt will not be on the table. Third, if Choo gets on first with no outs, there is a higher chance you will score if you don’t bunt than if you move the runner over with one out. Finally, Zack Cozart is a below average bunter in his career. He’s only succeeded on 67% of sac bunt attempts, when MLB average is 69%.
Basically, there is a small subset of opportunities for Cozart to bunt Choo over, bunting rarely helps the offense score, and Cozart isn’t even great at it. That doesn’t sound like reason enough to bat him second when there are serious downsides.
His third argument is that Cozart wouldn’t succeed at the bottom of the order. That’s silly. Hitters do better when they hit in front of the pitcher. I don’t have complete data, but in 2012 NL 8th hitters had higher OBPs than AL 8th hitters because they hit in front of the pitcher. It would probably help Cozart, not hurt him. Second, you shouldn’t put a bad batter in the 2nd spot because he’d be worse in the 8 spot. That’s more bad at bats in more critical situations. That’s illogical in every way.
Why Cozart Can’t Hit Second
To start, Cozart is a below average hitter (.230/.261/.358, 64 wRC+ in 2013) this year and has been for his entire career. This isn’t a slump he has to work out of, it’s who he is as a hitter. He’s not the worst hitting shortstop in the league this season, but he’s not a good hitter overall. He’s got a great glove and runs the bases well and I have no problem with him hitting 8th and playing short for the Reds. He’s a valuable player if used correctly.
But not in the 2nd spot in the order.
First of all, many would argue the 2nd hitter should be your best hitter because the 2nd hitter will get the most at bats during a season except for the leadoff hitter and will bat with men on base more often than the leadoff hitter. This gets you the most at bats you can while not losing the opportunity to drive in runs by hitting 1st. Some say your fourth hitter should be your best, some say second, it doesn’t really matter. Your best hitters should hit 1-5. I really don’t care about the order very much, but you should bat your best guys up front because they will bat more often during the whole season and are more likely to come up in each individual game, therefore, maximizing the chances that they can provide a key hit that swings the outcome of the most games.
You also want good hitters in front of other good hitters. I don’t really care if Votto hits second, third, or fourth, but I do care that he bats with runners on base because he is an elite hitter and should be given the opportunity to hit with the bases occupied. Cozart makes the most outs of any regular Reds hitter, but he hits in front of the guy who makes the fewest.
That’s madness. You want guys on base for your best hitters and Cozart is the worst on the team at that. You’re giving Votto, Phillips, and Bruce fewer chances to drive in runs by putting a bad hitter second. There is no getting around that.
To win baseball games, you need to score more runs than the other team and the offense’s job is to maximize their run scoring output. To do that, they have to get on base and not make outs. Cozart makes the most outs of anyone on the Reds, so is therefore not on base for the guys who make the fewest outs. We can argue about who should hit 2nd, 3rd, and 4th based on who slugs what and who strikes out the least, but there is no question that you cannot have a terrible hitter in the middle of your offensive attack.
In 2012, the Reds 2nd spot came to the plate 108 more times than their 8th spot. Over the course of an entire season, you can bring Cozart to the plate 100 fewer times if you move him down. Let’s say he’s a .280 OBP guy. You’re talking about something like 80 fewer outs over a whole season. That’s one fewer out every other game. That can be the difference between winning and losing in some cases.
Even if you want someone who can bunt in the 2nd spot and think sacrifice bunting is great, surely you can appreciate that being able to bunt (which Cozart isn’t great at) doesn’t make up for how many outs you can save by moving Cozart down and replacing him with someone who makes fewer outs, and maybe even hits for extra bases. Even if you want to be able to bunt in the 2nd spot, no one on the Reds is significantly worse than Cozart at it that is makes up for the other outs he makes.
So allow me to summarize. Zack Cozart is the Reds worst hitter. This is clear. He’s costing the Reds scoring opportunities by making more outs than anyone else. The Reds can benefit from moving him into the 8th spot to get him fewer at bats and getting more at bats for their better hitters. Sacrifice bunts cost runs, and even if you choose not to believe that, Cozart isn’t great at it, so the small number of chances he gets to bunt combined with his success rate at it can be easily mimicked by anyone else.
Zack Cozart hits second because baseball tradition says you hit a contact hitter with who can bunt and run second. But that is not the best way to structure a lineup. It’s just wrong. The value in those skills is not best utilized in the 2nd spot. The two spot is for good hitters who extend innings and get on base. Moving runners over by bunting and giving yourself up is not a valuable skill if you cannot also get on base.
Cozart is a good player overall, but not a very good hitter. There is a place for a player like that in the major leagues, but he can’t hit second. Don’t accept conventional wisdom because it’s always been that way. There is no logical reason to hit Cozart second except that’s what we’ve always done. “What we’ve always done” is not a good reason to do something. If you deconstruct how runs are scored, you recognize that you need players who get on base to get on base ahead of other good hitters. If you put a bad hitter in that mix, you’re killing rallies plain and simple.
Zack Cozart cannot hit second and you shouldn’t accept the reasons given by Baker and Reynolds because they don’t make sense. Consider it for yourself. Would you rather get Choo to second with one out, or Votto batting with Choo on first and no outs. Think about Cozart coming to the plate with the game in the balance and making an out, leaving Votto on deck.
This is a problem all across MLB and it’s one of the easiest things to fix. Just start thinking differently.
The Morning Edition (July 11, 2013)
From Last Night:
- Wheeler great, Cain awful in a big Mets win
- Another great start for Turner in Miami
- The Angels unload on the Cubs, get a good start from Wilson
- Lee gives up four solo homeruns in a loss to the Nationals
- Toronto tops Cleveland after a wild 9th
- Nova and the Yanks handle the Royals easily
- Twins and Rays play deep into the night, Zobrist walks off
What I’m Watching Today:
- Sale and Sanchez in Detroit (1p Eastern)
- Zimmermann goes against the Phils (7p Eastern)
- Bumgarner (underrated) and Marquis (overrated) face off in Petco (10p Eastern)
The Big Question:
- How should we pick the ASG starter?
There’s been some debate, as there always is regarding ASG stuff, as to who should start for each side. Harvey is the frontrunner in the NL because he is having one of the best seasons and the game is at his home park. It’s not a lock that he should start on merit, but he’s in the conversation and the hometown thing probably pushes him over. I think it’s safe to say Harvey, Wainwright, and Kershaw are the contenders, but depending on what stats you like, you can make a case that any of them are the best starter so far. But should it be about the best starter so far this season? Should it be about the best starter for the last calendar year? The biggest star? The guy who we judge to be the best, because the game does count? It’s not a clear formula. For what it’s worth, Wainwright is schedule to pitch Sunday so he’s probably out. Kershaw and Harvey are both “stop what you’re doing and watch guys” who are having elite years and are top 10 guys since the last ASG. If you’re asking for six outs, they can both get them with the best of them. Is there really a way to separate who should get the start if we don’t have a fixed definition. If Kershaw was far and away having a better season, it might be different, but they’re pretty even, so it just makes sense to go with Harvey…I think. Kershaw’s about to get $200 million. Harvey could have that in his future, but he has more work to do. Let’s go with Harvey.
A Case Study in Wins
To bring you up to speed I’ve been laying out evidence over the last few weeks in an effort to help banish the pitcher win as a method for measuring individual performance. I’ve covered a number of topics such as:
- Pitchers who had great seasons and didn’t win
- Pitchers who had below average seasons and won a ton
- These numbers not balancing out over an entire career
The simple complaint with the win statistic is that it doesn’t measure individual performance but is used by people to reflect the quality of an individual. Wins are about pitchers, but they are also about run support, defense, the other team, and luck. We shouldn’t use such a blunt tool when measuring performance when we have better ones. I’ve provided a lot of evidence in the links above supporting this claim, but those have posts about the best and worst and about career long samples. Today, I’d like to offer a simple case study from 2012 to illustrated the problem with wins.
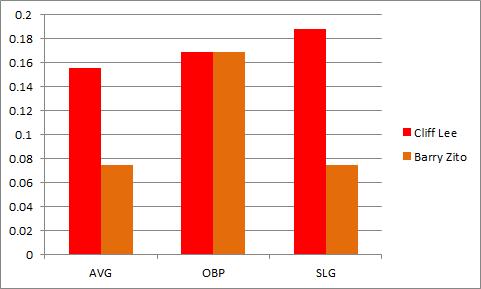
The faces I’ll put on this issue are Cliff Lee and Barry Zito, both of whom appeared on the lists above.
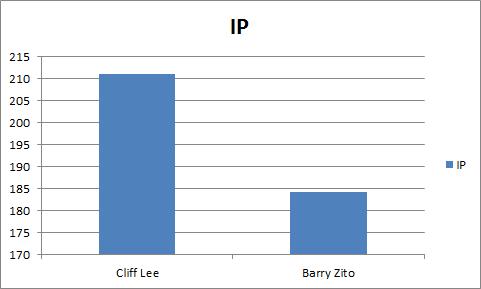
Let’s start with some simple numbers from their 2012 campaigns to get you up to speed. Lee threw more than 25 more inning than Zito and performed better across the board:
Lee had a much higher strikeout rate and much lower walk rate.

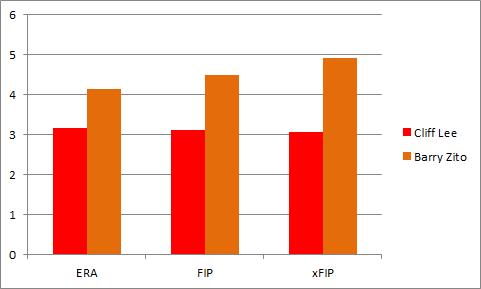
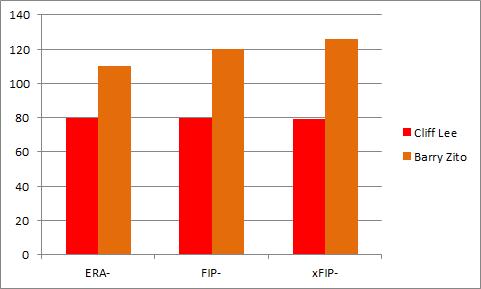
Lee had a lower ERA, FIP, and xFIP and if you prefer those numbers park and league adjusted, they tell the same story:
If you’re someone who likes Wins Above Replacement (WAR) or Win Probability Added (WPA) it all points in Lee’s favor as well:

By every reasonable season long statistic, Cliff Lee had a better season than Barry Zito. If you look more closely, you can see that Lee had a great year and Zito had a below average, but not terrible season. There is simply no case to be made that Barry Zito was a better pitcher than Cliff Lee during the 2012 season. None.
But I’m sure you can see where this is going. Cliff Lee’s Won-Loss record was 6-9 and Barry Zito’s was 15-8. Lee threw more innings, allowed fewer runs per 9, struck out more batters, walked fewer batters, and did just about everything a pitcher can do to prevent runs better than Barry Zito and he had a much worse won-loss record. Something is wrong with that. Let’s dig a bit deeper and consider their performances in Wins, Losses, and No Decisions.
Let’s start with something as simple as ERA. In Wins, Losses, and ND, Cliff Lee allowed fewer runs than Zito despite pitching his home games in a park that skews toward hitters and Zito in a park that skews toward pitchers:

In fact, Lee’s ERA in Losses is almost identical to Zito’s in No Decisions. He allowed the same number of runs when he pitched “poorly” enough to lose as when Zito pitched in a “neutral” way. If we take a look at strikeout to walk ratio, it looks even more lopsided:
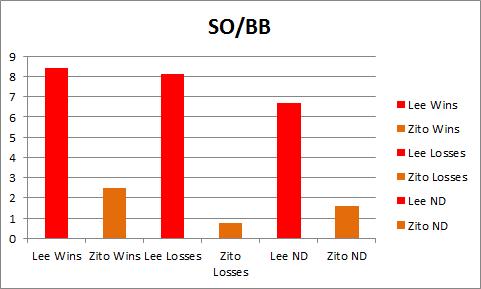
Lee way outperforms Zito in the measure even if you put Lee’s “worst” starts up against Zito’s “best” ones. Let’s take a look at OPS against in these starts, and remember, Lee pitches in a hitters’ park and Zito in a pitchers’ park:
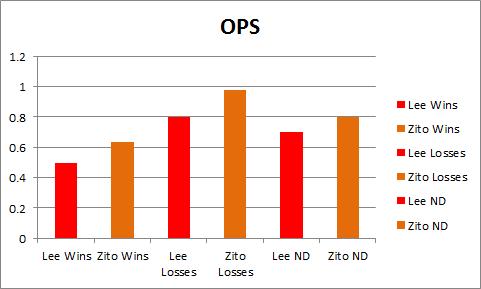
Again we find that Lee pitches as well in Losses and Zito does in No Decisions and performs much better across the board. Not only does Lee allow fewer runs in each type of decision, he has a better K/BB rate, and a lower OPS against in pitching environments that should favor Zito.
Everything about their individual seasons indicates that Cliff Lee had a much better season than Barry Zito and when you break it down by Wins, Losses, and Decisions, it is very clear that Lee performed better in all of these types of events. Lee was unquestionably better. No doubt. But Lee was 6-9 and Zito was 15-8. Zito won more games and lost fewer.
If we look at the earned run distribution, you can clearly see that Lee was better overall, on average, and by start:

You likely don’t need more convincing that Lee was better than Zito, in fact, you probably knew that from the start. Lee was better in every way, but Zito’s record was better. How can wins and losses be useful for measuring a player when they can be so wrong about such an obvious case?
Cliff Lee prevented runs better than Zito last season. He went deeper into games. More strikeouts, fewer walks, lower OPS against in a tougher park. He was better than Zito in Wins, Losses, and ND and often better in Losses than Zito was in ND. How can this be? It’s very simple. Wins and Losses aren’t just about the quality of the pitcher, not by a long shot. Even ignoring potential differences in defensive quality (Giants were slightly better) and assuming pitchers can control every aspect of run prevention it still isn’t enough. Lee was better and had a worse record. What good is a pitching statistic if it is this dependent on your offense? It isn’t any good.
Here friends, are their run support per 9 numbers. This should tell you the whole story:

The Giants got Zito 6 runs a game on average and the Phillies got Lee 3.2. It didn’t matter that Lee way out pitched Zito, he still had no shot to win as many games because the Giants scored runs for Zito and the Phillies didn’t score for Lee. The Giants during the entire season scored 4.4 runs per game. The Phillies scored 4.2. This isn’t as easy as saying that pitchers on better teams win more often. Lee’s team scored much less for him on average and the Giants scored much more for Zito on average.
You can’t just say that a pitcher with a great offense will win more often, it comes down to the precise moments in which they score. How can that possibly have anything to do with the pitchers this statistic hopes to measure? It can’t.
If my global evidence about the subjectivity and uselessness of wins didn’t get you, I hope that this has. There is no justification for using wins to measure pitchers when something like this can happen. Lee was much better than Zito in every way, but if you’re using wins and losses, you wouldn’t know it.
And, just in case you were wondering, Lee was a better hitter too.