The Morning Edition (July 6, 2013)

From Last Night:
- Wells delivers a walk off single to back Nova’s CG, 11 K performance
- Milone goes 8.1 to beat the Royals
- Hellickson goes 7, Ks 9 as the Rays defeat the White Sox
- 7 shutout innings from Buerhle push the Jays past the Twins
- Liriano goes the distance as the Bucs top the Cubs
What I’m Watching Today:
- Zimmermann welcomes the Friars to Nationals’ Park (4p Eastern)
- Bonderman and Latos (4p Eastern)
- Sale and Moore in Tampa (7p Eastern)
- Darvish versus the Astros, strikeout warning (7p Eastern)
The Big Question:
- Who will get picked to the ASG today?
Yesterday we unveiled our 2013 AL All-Stars and the NL team is coming today at 4pm. It’s always a controversial list, but I feel good about it. You can also catch up on our series chronicling the problems with the wins statistic, starting with great low wins seasons, showing that wins don’t even out over the course of a career, and later today we’re breaking down The Nine Worst 20 Win season in MLB history. Needless to say, it’s a controversial type week at New English D, but we’re all for it. Let’s talk baseball!
How Was The Game? (July 5, 2013)
Another fantastic game.
Tigers 7, Indians 0
Coming off three straight wins the Tigers rolled into Cleveland and had no trouble putting them away. The bats scored early and often, crossing the plate in four separate innings totally 7 runs with Dirks and Martinez in the center of the attack, but Rick Porcello (5-6, 93.1 IP, 4.82 ERA, 3.55 FIP, 1.7 WAR) was the story as he turned in 7 shutout innings of 5 hit, 2 walk, 6 strikeout baseball and pitched in almost no traffic all night long. He gave up a little bit of hard contact, but those turned into outs quickly and he didn’t let one baserunner turn into four baserunners as he sometimes does when he’s off his game. He had all his pitches working and went to the breaking ball and offspeed stuff very effectively, making him look more like the dominate, potential front-line starter he was during May and early June (a breakdown here). He is 8th in major league baseball in park adjusted xFIP-. Here’s are important graphs on the subject, first regarding his strikeout and walks rates and second regarding his varying fastball and excellent curve:


Everything went well for the Tigers, as it has for the last four nights running, moving them to 47-38 as they give the ball to Anibal Sanchez (6-5, 81.2 IP, 2.76 ERA, 2.07 FIP, 3.2 WAR) who comes off the DL looking to jump back on his Cy Young track on Saturday.
The Moment: Porcello strikes out 6 on his way to 7 scoreless innings.
Picking the American League All-Stars
With the All-Star rosters looming ahead this weekend, New English D weighs into the fray with these picks. We’ll cover the NL tomorrow. A few notes up front. First, I’ve conformed the roster size to the official requirements and have selected starters I feel are most deserving based on their 2013 seasons and have given no deference to the voting up through this point. My view is that the All-Star Game should showcase the game’s standout performers from the first half of 2013, not the best players over the last year or the best players by talent even if they haven’t performed. I think the game should highlight the players who play well, not the players MLB thinks are “marketable.” Every team is represented and I’ve given a list of players who are the first replacements for injuries and such. Clay Buchholz would have been selected, as noted, but is currently injured. As you know, this site appreciates advanced statistics, so should you choose to comment on these selections, please do so without using “RBI” or “Wins.”
Enjoy and feel free to criticize the 7 Tigers I put on the list. I can’t make a case that they aren’t deserving, even if you think I’m a homer.
| PLAYER | TEAM | POSITION |
| Joe Mauer | Twins | C |
| Chris Davis | Orioles | 1B |
| Jason Kipnis | Indians | 2B |
| Jhonny Peralta | Tigers | SS |
| Miguel Cabrera | Tigers | 3B |
| Mike Trout | Angels | OF |
| Jose Bautista | Jays | OF |
| Jacoby Ellsbury | Red Sox | OF |
| David Ortiz | Red Sox | DH |
| Max Scherzer | Tigers | SP |
| Carlos Santana | Indians | C |
| Edwin Encarnacion | Jays | 1B |
| Dustin Pedroia | Red Sox | 2B |
| Robinson Cano | Yankees | 2B |
| Jed Lowrie | Athletics | SS |
| Evan Longoria | Rays | 3B |
| Manny Machado | Orioles | 3B |
| Josh Donaldson | Athletics | 3B |
| Nate McClouth | Orioles | OF |
| Alex Gordon | Royals | OF |
| Brett Gardner | Yankees | OF |
| Adam Lind | Jays | DH |
| Derek Holland | Rangers | SP |
| Felix Hernandez | Mariners | SP |
| Chris Sale | White Sox | SP |
| Justin Verlander | Tigers | SP |
| Yu Darvish | Rangers | SP |
| Anibal Sanchez | Tigers | SP |
| Doug Fister | Tigers | SP |
| Bud Norris | Astros | SP |
| Brett Cecil | Jays | RP |
| Mariano Rivera | Yankees | RP |
| Drew Smyly | Tigers | RP |
| Jesse Crain | White Sox | RP |
| Clay Buchholz* | Red Sox | SP |
| FIRST REPLACEMENTS | ||
| Kyle Seager | Mariners | 3B |
| Omar Infante | Tigers | 2B |
| Howie Kendrick | Angels | 2B |
| Adrian Beltre | Rangers | 3B |
| Hisashi Iwakuma | Mariners | SP |
| Joaquin Benoit | Tigers | RP |
| Joe Nathan | Rangers | RP |
| * injured |
Stat of the Week: Batting Average on Balls in Play (BABIP)
Batting Average on Balls in Play (BABIP) is one of the most easily understood sabermetric statistics because it can be easily calculated at home like many of the basic descriptive stats, but it is also a very powerful tool. Let’s start with the basic idea (or you can read about it at Fangraphs).
BABIP is exactly what it says it is, a player or pitcher’s batting average (or average against) on balls that are put in play, meaning that strikeouts and homeruns are subtracted from at bats in the denominator while sacrifice flies are added and homeruns are subtracted from the numerator of batting average, it looks like this:
BABIP = (H – HR) / (AB – K – HR + SF)
Sac bunts aren’t included because you’re making an out on purpose, so it doesn’t really belong given that it doesn’t reflect a hitter or pitcher’s skill.
BABIP tells you what percentage of balls hit somewhere the defense could make a play go for hits and can tell us a lot about players. For hitters, defense, luck, and skill determine your BABIP. A good defense playing against you will lower your BABIP because they will catch balls that should be hits, luck will lower or raise your BABIP because sometimes hard hit balls go right at someone, and skill will influence your BABIP because line drive hitters and speedy runners are more likely to have higher BABIPs because they hit the ball in a way that is more likely to result in hits or they leg out infield singles.
We generally think of true talent levels for hitters between .250 and .350 with average being right around .300. If you see someone deviate greatly from .300 or so, there may be a legitimate reason, but it is also very likely about luck. Hitters can influence their BABIP, but BABIP is fluky and takes a while to settle down, meaning that in small samples your BABIP can be quite different from your true talent level. This is what we mean when we say someone’s success is BABIP driven. No one can sustain a .450 BABIP for a whole season, but they can do it for two weeks and that can inflate statistics like batting average and slugging percentage in small samples.
The same is true for pitchers, but it’s even more critical. Pitchers have very little control over what happens to the baseball once it is put in play. Strikeouts, walks, and homeruns rest solely on a pitcher, but once a hitter makes contact it’s out of their hands. Most pitchers will have BABIPs close to .300 and any serious deviation from that number means there is some serious luck or defense involved. Even pitchers who are easy to hit will still have BABIPs closer to average because their defense will still get to a high percentage of balls in play.
Using BABIP is very easy. Hitters can have higher or lower BABIPs based on their skills, but they are unlikely to post very high or very low BABIPs. For example, only 14 hitters in MLB history have BABIPs above .360 for their careers and only 26 hitters since WWII have BABIPs lower than .240. What you want to do is compare a hitter’s season BABIP to their previous seasons to see if it is in line. If you’re jump from a .310 career BABIP to a .360 the next season, it’s likely due for some regression to the mean. BABIP can be predictive like this if there is no underlying change in skill.
For pitchers it’s even better. If a pitcher has a BABIP the deviates heavily from average, it’s almost certainly a function of luck or bad defense.
It’s quite straightforward. If someone’s BABIP deviates heavily from .300 and has no history of a high or low BABIP, it means you’re likely looking at something fluky. Here’s a quick demonstration to prove the point. Here is every qualifying hitter season since 1990 by BABIP:
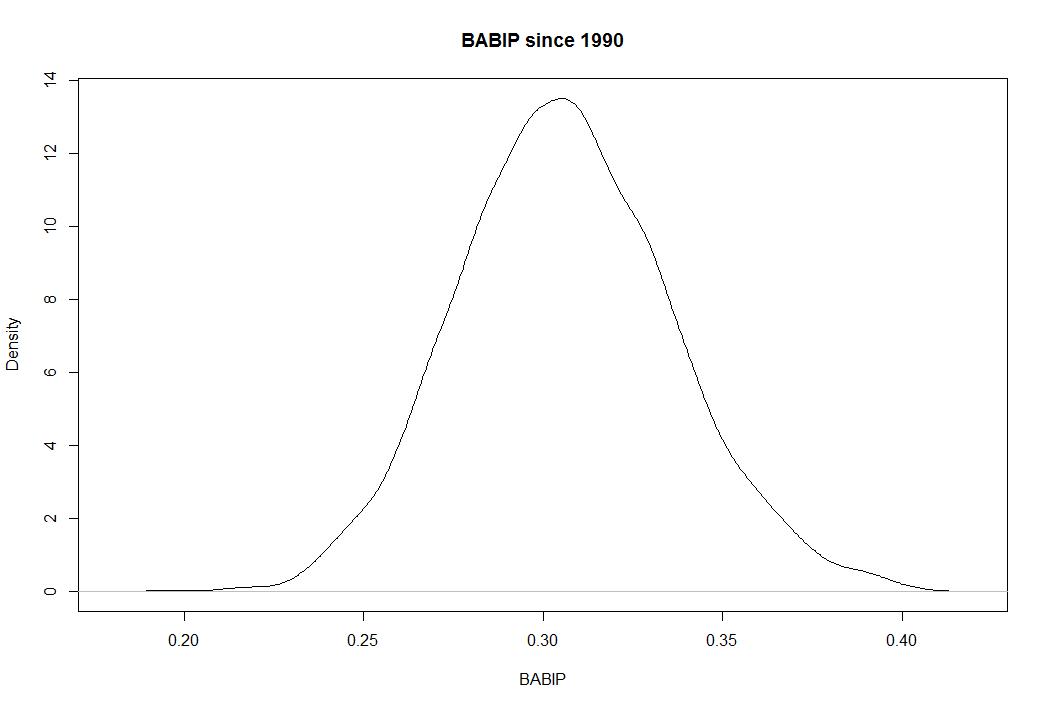
You can see how it centers on .300 and almost never extends beyond .250 and .350. But in small samples, it can be fluky and give you weird results that can inflate your batting average or other numbers. Let’s look at the last 14 days in MLB:

You’ll notice the normalized shape, but also notice the scale across the horizontal axis. Lots of players have BABIPs in the .400 and below .200 over the last two weeks, meaning lots of players are over and underperforming their true talent thanks to luck and random variation.
The takeaway is simple. BABIP is a place to look when deciding if a player’s improved (or worse) results are coming from a real change in skill or good fortune. If the BABIP looks funky, look closer. If the BABIP looks typical, there might be something real going on.
The Morning Edition (July 5, 2013)
From Last Night:
- Mets and Dbacks each score once in the 13th and 14th before the Snakes win it in 15
- Hamels looks great as he beats Cole and the Bucs
- The A’s takes the Cubs in a 1-0 pitchers’ duel
- Tampa beats the Astros in 11
- Shields struggles, but the Royals storm the Indians with 10 in the final 3 innings to win
- Quintana dominates, but Jones coughs it up for the Sox, only to walk off in the 9th
What I’m Watching Today:
- Lee takes on the Braves (7p Eastern)
- Zack Wheeler heads to Miller Park (8p Eastern)
- Jacob Turner gets the Cards (8p Eastern)
- Ryu and Cain out west (10p Eastern)
The Big Question:
- Who will be named All-Stars as the voting closes last night at midnight?
The interesting one is going to be the AL 3B spot. Obviously, Cabrera is going in as the starter, but between the players and Leyland it’s hard to imagine more than 2 others getting in, three at most. Here are the candidates though:
| Name | PA | HR | R | RBI | AVG | OBP | SLG | wOBA | wRC+ | WAR |
| Miguel Cabrera | 383 | 26 | 65 | 85 | 0.364 | 0.454 | 0.670 | 0.470 | 202 | 5.4 |
| Evan Longoria | 356 | 17 | 52 | 48 | 0.294 | 0.365 | 0.537 | 0.382 | 149 | 4.4 |
| Manny Machado | 392 | 6 | 53 | 42 | 0.319 | 0.349 | 0.481 | 0.359 | 125 | 4.2 |
| Josh Donaldson | 353 | 14 | 46 | 55 | 0.314 | 0.382 | 0.526 | 0.389 | 151 | 3.8 |
| Kyle Seager | 361 | 12 | 43 | 38 | 0.280 | 0.338 | 0.465 | 0.348 | 127 | 2.9 |
| Adrian Beltre | 354 | 15 | 47 | 43 | 0.299 | 0.339 | 0.494 | 0.358 | 121 | 2.2 |
Longoria and Machado are the most deserving overall, but Donaldson is the best overall hitter and no one really cares about defense when it comes to picking All-Stars. Plus Beltre has the name recognition and Seager should get some credit for being a great hitter on a terrible club. Third base in the AL is a deep spot. We’ll have more on the All-Star Selections as the happen.
What About Pitcher Wins With A Long Lens?
This season, the debate between those who like using wins to judge pitchers and those who want nothing more than to forget that statistic exists has heated up and we’ve seen the movement heavily publicized by MLB Network’s Brian Kenny, who takes on “wins” on a daily basis.
The argument against using wins is simple. The way pitcher wins are determined does not reflect individual pitcher performance, and therefore is an improper judge of how well someone performed. There are countless examples, most clearly Cliff Lee last season and James Shields and Chris Sale this season. Last week, we took on some of the best seasons ever by pitchers who won 9 or fewer times in a season. So much of what leads to wins is completely out of the pitcher’s control and they shouldn’t be judged based on how many runs their team scored for them. Run support, even if we strip away defense, the opposing pitcher, and dumb luck, is a clear and important factor in how many wins you have.
Last week, I gave you this graph which showed that in the 8,000+ qualifying seasons since 1901, wins did very little to explain overall performance:

But those numbers just reflect single seasons. I started wondering about bigger samples. Pitchers can get really lucky or unlucky in a given start and clearly they can in given seasons, but what about in their careers? Can you fake your way through an entire career of wins? It turns out that you can. Let’s take a look.
Below is a graph of Wins per Start (so as to control for guys who made 400 starts and guys who make 250 starts) and ERA- (which is simply ERA scaled to league average during that era and adjusted for park effects. Lower ERA- is better and 100 is league average, meaing ERA- of 90 is 10% better than average). What you see here is that wins fare no better in career samples than season ones (sample size of 2,155):
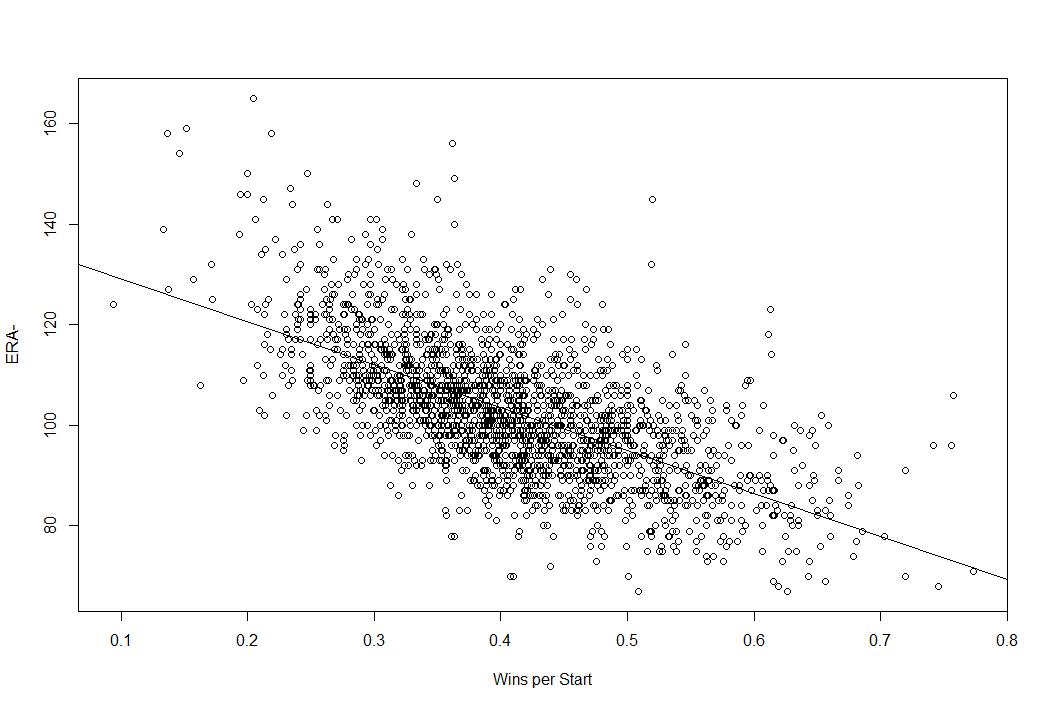
The trend line is clear in that the lower your ERA-, the more frequently you win, but there is significant variation at each point. For example, at a wins per start of 40%, some pitchers have ERA- of 80 and some have ERA- of 120. The adjusted R squared here is .3966, which means that only 40% of the variation in ERA- can be explained by Wins per Start. That’s less than half.
If we used FIP-, which is the scaled version of Fielding Independent Pitching (FIP), the results are even more troubling for wins.

The adjusted R squared here is only .2131, meaning that only about 21% of the variation in FIP- can be explained by Wins per Start. You can win 50% of your starts as the best pitcher of all time or as one of the worst.
The takeaway here is very simple and very important. Your ability as a pitcher to keep the other team from scoring (as seen with ERA-) and your ability to prevent runs based on only that which you can control (FIP-) are not that heavily correlated with winning. You can’t use a pitcher’s wins to predict how good they are because you can win if you prevent runs like a superstar or if you prevent runs like a Triple A long reliever. Even if you strip out defense and the quality of the other offense and give the pitcher credit for every single run he allows, there is still the issue of team run support that he has zero control over.
Last week I provided simple, straightforward evidence for why wins don’t reflect performance over the course of the season, but here I’ve shown that wins don’t even tell you much over the course of an entire career. It’s the job of a starting pitcher to limit the runs they allow, but the ability to limit runs doesn’t correlate very well with how often you win because so much of that is out of your hands.
Wins are not a good measure of individual performance and we should stop using them as such. This isn’t because sabermetricians don’t understand the point of the game, which is to win, but rather because we understand that “wins” as a stat for pitchers tells us nothing about how much they contributed to helping their team win. Pitchers try to prevent runs. That is only half of the game. They shouldn’t be praised or blamed for what happens on the other side.
How Was The Game? (July 4, 2013)
A great one all-around.
Tigers 11, Jays 1
After losing the last two in Tampa and the first one in Toronto, many fans started to stir with consternation, but the Tigers have since railroaded the Jays in three straight nights with the series finale placed in the capable hands of Justin Verlander (9-5, 112 P, 3.54 ERA, 3.01 FIP, 3.0 WAR), who retired the first 11 he faced and went 7 scoreless innings in which he allowed just 3 hits, 2 walks, and struck out 5. It was vintage Verlander for the first time in a few weeks as he cruised to victory in dominating fashion. The offense gave him plenty of room too, as they grabbed 2 in the 1st, 2 in 3rd, 3 in the 6th, 2 in the 8th, and 2 in the 9th thanks to standout games from Jackson, Hunter, Fielder, and Kelly. It was an excellent series win for the Tigers who move back to 46-38 with a four game set against the second place Indians at Progressive Field looming this weekend. They turn the ball over to Rick Porcello (4-6, 86.1 IP, 5.21 ERA, 3.65 FIP, 1.4 WAR) for game one on Friday.
The Moment: Verlander dominates for the first time in a while.
How To Pitch To Miguel Cabrera

A simple Google search of the above headline leads you to about 7 million pages, none of which appear terribly helpful. Some pose the question if one should pitch to Cabrera and some discuss recent attempts to pitch near Miguel Cabrera’s head. Others still just show you .gifs of Cabrera hitting homeruns, which seems pretty similar to just telling you that it’s tough to get this guy out.
In fact, he is the hardest hitter in baseball to get out, posting a league best .454 OBP. He makes the fewest outs in baseball and also does a considerable amount of damage, posting a .670 SLG, .470 wOBA, .306 ISO, and 202 wRC+, depending on which statistics you like to use to measure how much a player crushes a baseball. Heck, I’ll even cite the 26 HR and 85 RBI just because. Here’s the point, he’s hard to get out and when you don’t get him out, he makes you pay.
Which returns us to the original inquiry, how should you pitch to him?
Let’s start with some quick assumptions:
- You can’t walk him because at this point in the game it would be bad strategy.
- You are a RHP
- You are a reasonably competent, average starter with a full repertoire
From here, we’re going to breakdown the approach using Cabrera’s plate appearance data against RHP from 2013 because he’s presumably adapted throughout his career, so we shouldn’t try to get the 2009 version of him out. Let’s go for it.
First, let’s take a look at where in the strikezone Cabrera will swing and miss:
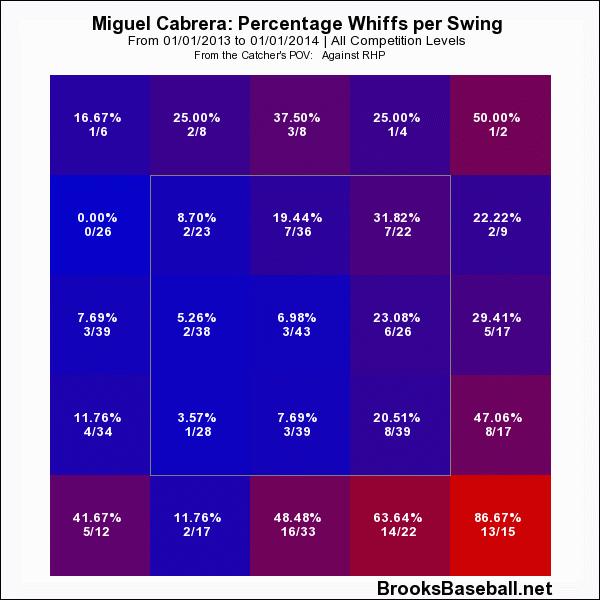
So overall, you can get Cabrera to swing and miss if you go low and away or if you elevated the pitch out over the plate. This stands to reason as his batting average zone plot looks like this:
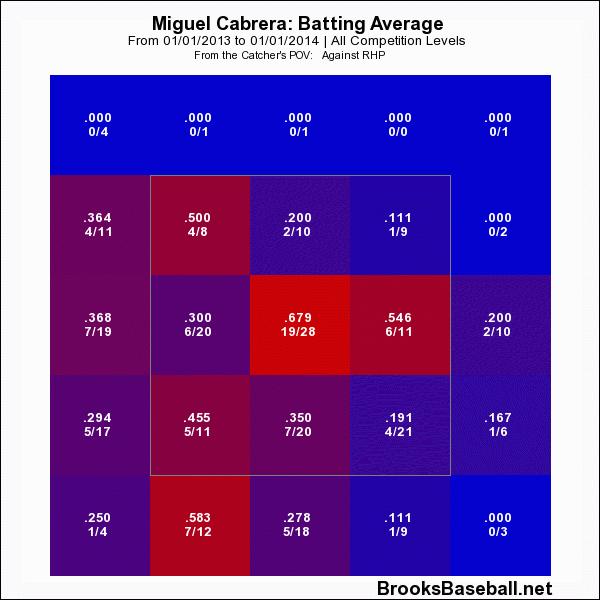
Generally, this shows us that you have to go down and away or up above the zone if you’re trying to limit contact. If you’re trying to limit the damage, as seen by his slugging percentage by location, the same holds true.

So we have a general idea about where to pitch Cabrera based on his 2013 performance. For reference, the same pattern holds true for the last few seasons. He’ll chase down and away and above the zone, and those are the two places he’ll get the fewest hits and the fewest extra base hits.
Let’s now break it down a little by pitch type. If you throw him hard stuff (various fastballs), you want to keep it away from him. This is his slugging percentage against hard stuff:

And again, whiffs per swing against fastball type pitches:
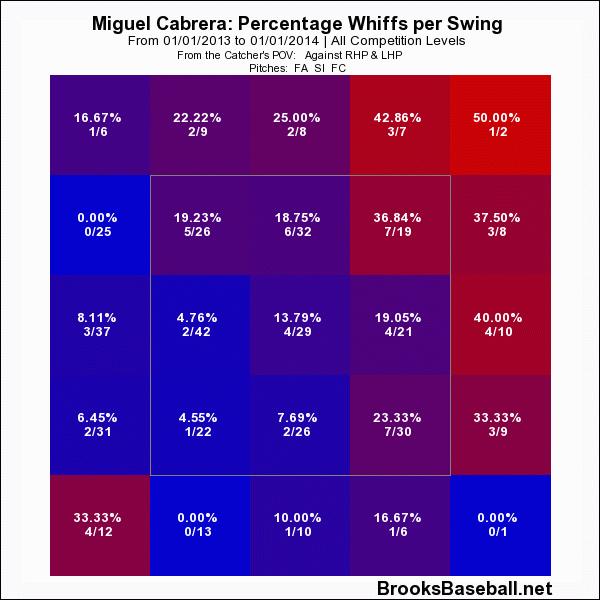
So we have a little more information now. We know that if we’re a right handed pitcher, when we go with the fastball we want to go up and away, and avoid the inside part of the plate at all costs. Let’s turn to breaking balls and offspeed pitches. Here’s the whiff per swing rate on soft stuff:
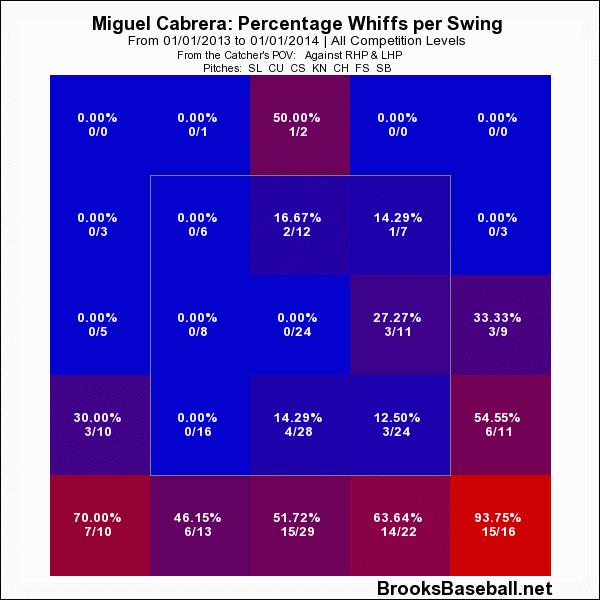
Now let’s take the slugging percentage against breaking balls and offspeed:

You can see here that Cabrera isn’t likely to swing at offspeed pitches inside and outside, but he will swing if they are over the plate and will crush them if they are in the zone.
So what have we learned? First, throw the fastball up and away and the changeup and breaking ball low and over the plate. Those are pretty much the only places to get Cabrera to chase and get himself out. We could break this all down by count, but that would get extremely long and messy. There are 12 possible counts to breakdown and that’s a lot of charts, so let’s just stop here with the zone breakdowns.
If we look by pitch type more generally, you can see there are pitches that work better.

He’s more vulnerable to sliders and splitters, and you can get him out with the cuvreball, but there is a big risk involved if you miss with that pitch because he may crush it.
Cabrera is baseball’s hardest out and he’s also one of the game’s most feared power hitters. There isn’t an easy way to get him out, but the way to do it is to work the fastball up and away and the breaking ball down and over the plate. That is, however, no guarantee. Because sometimes he does this (click to play if it isn’t running on your screen):

The Morning Edition (July 4, 2013)
From Last Night:
- Felix and Holland hold both clubs to 2 runs, but the bullpens settle it in 10 on a Seager bomb
- Gomes walks off on the Padres
- Nolasco does well in front of the scouts, beats the Braves
- Norris pitches well in trade audition to beat the Rays
- CC goes 7 to beat the Twins
- Grilli gives up 2 runs, gets a save anyway because the save rule is silly
- Lohse twirls a gem to top the Nats
What I’m Watching Today:
- Cain and Leake in Cinci (1p Eastern)
- Gerrit Cole Hamles matchup! (1p Eastern)
- Shields continues to get no help from his team (2p Eastern)
- Wainwright takes on the Angels (9p Eastern)
The Big Question:
- What’s your take on the no-hitter war?
Brian Kenny, who we’re quite fond of at New English D, took to the airwaves and Twitter on Wednesday to mock the attention give to no-hitters because walks and hit batters are part of the game and that separating it into hits and other ways to get on base is misguided. While I understand the sentiment and am I big believing in walks as offensive weapons, there is a different argument that Kenny hasn’t responded to at this point. No hitters are not always great performances, I fully agree. A one hit shutout is better than a 5 walk no hitter, but no hitters in all their forms are much rarer that no walk games. Since 1916, there have been more than 9,000 CG with no BB or HBP, but less than 300 CG with no hits. Less than 30 with no baserunners, period. The point here is that one baserunner is one baserunner no matter how he gets on, but it is much rarer to allow no hits than no walks and that is something worth celebrating. Kenny is right that the mainstream press doesn’t cover one hitters appropriately compared to no hitters with several walks, but I think the problem is in the other direction. Kenny thinks no-hitters are no big deal when the pitcher walks a couple guys, but I think we just don’t give enough credit to 1 and 2 hitters. Here at New English D, we make an attempt to highlight all great pitching performances, but do value the no hitter because the no hitter is rare and it’s quirky. After all, baseball is fun. I don’t usually disagree with Kenny, but on this issue I do.
How Was The Game? (July 3, 2013)
A little heated.
Tigers 6, Jays 2
The actual baseball part of Wednesday’s game went quite well for the Tigers as Max Scherzer (13-0, 116.2 IP, 3.09 ERA, 2.63 FIP, 3.7 WAR) made another fine start, going 6.1 innings, allowing just 2 runs, while walking 1 and striking out 8. He was supported (no way?!) by 6 runs, 3 coming on an Avila homer, 2 from Martinez on a single and a homer, and one from Peralta AND a ridiculous catch by Austin Jackson in centerfield. Things got quite heated, however, when Colby Rasmus injured Omar Infante on a dirty slide and then Jays pitcher Todd Redmond came up and in on Torii Hunter in the very next inning. The benches cleared, but Prince Fielder and company helped keep the peace. Scherzer gave way to Rondon, Smyly, and Benoit who held the lead and guaranteed the Tigers no worse than a split during their only trip north of the border. They’ll call on Justin Verlander (8-5, 105 IP, 3.77 ERA, 3.05 FIP, 2.8 WAR) to go for the outright series win on Thursday, and hopefully Jim Leyland won’t get him suspended like he did with Porcello.
The Moment: Jackson makes a leaping catch to rob the Jays of extra bases.

