Jason Marquis, Expectations, and Reality
 Should you be interested, I recently wrote a piece over in the Community Research section of Fangraphs breaking down the extreme difference between Jason Marquis’ very solid ERA and his all-time awful FIP. Not only is Marquis over-performing, he’s over-performing at an unprecedented level. I’ve mixed in some historical data and a comparison to a current MLB pitcher who has the same peripheral numbers but a much worse ERA. I hope you find the analysis interesting.
Check out the entire thing over at Fangraphs.
RBI Is A Misleading Statistic: A Case Study

One of our missions here at New English D is to help popularize sabermetric concepts and statistics and diminish the use of certain traditional stats that are very misleading. If you’re a return reader, you’ve no doubt seen our series about the pitcher win:
- The Nine Best Seasons Under 9 Wins
- The Nine Worst 20 Win Seasons
- Comparing Wins Over Entire Careers
- A Case Study from 2012 about Wins
- 12 Assorted Facts Regarding Wins
I encourage you to read those posts if you haven’t already, but I’m confident in the case I’ve laid out. Wins aren’t a good way to measure pitchers’ performance and I’ll let those five links stand on their own. Today, I’d like to move forward and pick up the mantle with another statistic that is very misleading based on how it is currently used: Runs Batted In (RBI).
I’ll have a series of posts on the subject, but I’m going to start with a case study in order to explain the theory. RBI are a bad statistic because they are a misleading measure of value. Most people consider RBI to be really important because “driving in runs” is critical to success, but RBI is very much dependent on the performance of the other players on your team. A very good hitter on a bad team will have fewer RBI than a good hitter on a good team because even if they perform in an identical manner, the first hitter will have fewer chances to drive in runners. Even if they have the same average, on base, and slugging percentages overall and with runners on and with runners in scoring position. The raw number RBI is a blunt tool to measure the ability to drive in runs.
Factors that determine how many RBI you have outside of your control are the number and position of runners on base for you, the number of outs when you come to the plate with men on base, and the quality of the baserunners. If you get a hit with runners in scoring position 40% of the time (a great number) but there are just 100 runners on base for you during a season, you will get no more than 40 RBI. If you get a hit 40% of the time and have 400 runners on base for you during a season, you could have 100 RBI. That’s a big difference even if you perform in the same way.
I’m not making the case here that RBI is completely meaningless and that hitting with runners on base is exactly the same as hitting with the bases empty, but simply that RBI as a counting stat is very misleading. Even if you think the best hitters are the guys who get timely hits and can turn it up in the clutch, you surely can appreciate that certain guys have different opportunities to drive in runs. RBI is very dependent on context and that means it’s not a very good way to measure individual players.
Allow me to demonstrate with a simple case study. Let’s start with comparing two seasons in which the following two players both played the same number of games.
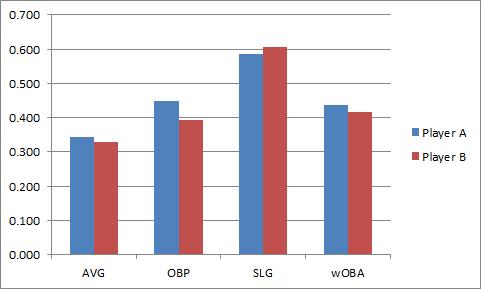
As you can see, Player A leads in average, OBP, and wOBA (what’s wOBA?) and is just a but behind in slugging. In wRC+, Player A leads 177 to 166 over Player B. If we take a look at BB% and K%, Player A looks much better.

All in all, Player A is the better player. We’ve looked at all of their rate stats and we’ve looked at wRC+ which controls for league average and park effect. It’s hard to argue that Player B is better. I couldn’t make a case to that effect.
Here’s the big reveal which some of you have probably figured out. Player A is Miguel Cabrera in 2011, Player B is Miguel Cabrera in 2012. This is the same player during two different seasons. In 2011, when Cabrera was clearly the better player, he had 105 RBI. In 2012, when he was worse, he drove in 139. Everything tells us he was better in 2011 except RBI. That should make use skeptical. It’s even more of a problem when you consider his situational hitting.
The graphs below are on identical scales:

Cabrera was better in 2011 in every situation and by each statistic except for his average (very close) and slugging percentage with no one on base. Which tells you nothing about how well he drives in runs. If you look at the HR distribution it tells you the same story.
| HRs | 2011 | 2012 |
| Bases Empty | 14 | 27 |
| Men on Base | 16 | 17 |
| Men in Scoring | 10 | 9 |
We can give him credit for those solo HR RBI from 2012, so let’s just lop 13 off the top. That still leaves 2012 Cabrera with 21 more RBI than 2011 Cabrera. Cabrera had a better season in 2011, but he had fewer RBI than in 2012. Most of this can simply be explained by the Tigers’ team OBP in the two seasons and where he hit in the lineup. If you subtract out Cabrera the Tigers got on base about 32% of the time in 2011 and 32.4% of the time in 2012 while Cabrera got to the plate a little less often because he hit 4th instead of 3rd. So there are more baserunners in general in 2012, but we can break this down even further.
In sum, Cabrera actually had more runners on base for him in 2011 than in 2012 but that doesn’t really tell the whole story. Let’s break it down by the number of baserunners on each base when he came to the plate:
| 2011 | 2012 | |
| Runner on 1B | 235 | 212 |
| Runner on 2B | 150 | 146 |
| Runner on 3B | 74 | 86 |
This should tell you the story even better. Cabrera had more baserunners in 2011, but the baserunners in 2012 were more heavily slanted toward scoring position. Cabrera had more runners closer to the plate so it’s easier to drive them in.
I intentionally chose Cabrera for this example because it strips away the idea that a given player just “has a knack” for driving in runs. Cabrera is an “RBI guy” if you subscribe to that idea. Miguel Cabrera had a better season in 2011 than 2012 when you break it down overall and in contextual situations. The only thing that helped 2012 Cabrera accumulate more RBI is that he had more runners on base closer to home when he got there. He played no role in getting those runners on base or closer to home, but he was able to more easily drive them and get credit in the RBI column. This is also isn’t as simple as converting RBI into a simple rate stat because where the baserunners are located and how many outs there are matter too, not just the number of situations.
This is the first step in a longer conversation but the takeaway point here is that RBI is stat that depends a lot on the team around you. Cabrera can’t control how many runners get on base and where they are on the bases when he comes to the plate. We shouldn’t judge a player for where he hits in the lineup and how the rest of the hitters on the team perform. It’s important to hit well with runners on base. I personally think we overvalue that skill over the ability to hit well in general, but I’ll leave that alone for now. Can we at least agree that a player who hits better with runners in scoring position and overall should be considered the better hitter? If that’s the case, then RBI is misleading you as an individual statistic. It’s that simple. I’m going to start laying out more evidence over the next couple weeks so stay tuned, but I’ll leave with this.
RBI is a descriptive statistic. It tells you who was at bat when a run scored and is critical to keeping track of a game in the box score. That’s why it was invented in the 1920s. You want to be able to scan a scorecard and recreate the game. RBI has a place in baseball, but only as a descriptive measure, not as a measure of value. Yet the RBI is still critical to MVP voting, arbitration salaries, and overall financial health of the players. They are judged by a statistic that doesn’t measure individual value and it is bad for their psyches. Players should focus on stats they can control and RBI isn’t one of those. It doesn’t measure individual value because as you can seen, in this very controlled example, RBI is misleading you.
The Morning Edition (July 19, 2013)
From Last Night:
- Sadness. There wasn’t baseball.
What I’m Watching Today:
- Strasburg faces the Dodgers (7p Eastern)
- Price looks to stay hot against the Jays (7p Eastern)
- Chen and Holland in Arlington (8p Eastern)
- Turner tries to keep it up in Milwaukee (8p Eastern)
The Big Question:
- Which team who’s out can make a run?
My own personal rule, and the rule of this site, is not to make anything about the standings until after the All-Star Break. You can discuss how individual teams have played, but you shouldn’t care about how they stack up until now. Every team is trying to win until now. At this point, teams take stock and think about buying and selling and whatnot. Now it’s okay to decide if you need some help or if it’s time to pack it in. There are currently 16 teams within 6 games of first place in their divisions, all of whom are at least in it for two more weeks. Some of those teams should sell because they’re not that good, but most of them are reasonably in it for now. Among those teams, the Nationals and Dodgers should be most on the radar as far as comebacks are concerned because the Dodgers are in a terrible division and the Nats have under performed. I bought the Nats in March and I’ll go down with the ship. This is a good team.
Revisiting The Nine Best Second Basemen for 2013
In the weeks leading up to the 2013 season, I unveiled my predictions for The Nine best players at each position. Some of the lists look good, some look terrible at this point, but that’s all part of the fun. Over the next two weeks leading up to the All-Star Game I will be revisiting these lists to see how things are going so far, around the halfway mark.
Obviously, the early evaluations will feature fewer than half a season and the later lists will feature a bit more, but try to think of these as the state of the position at the halfway mark. I’ll be using Wins Above Replacement (WAR) to generate the rankings because it is the number that best captures the entire value of a player. It isn’t perfect, so don’t take the precise values too seriously, but it’s certainly the best way to make any type of holistic list. WAR values offense, defense, baserunning, and playing time, so it represents exactly what I was trying to capture when I made the rankings during Spring Training.
Here’s how this will work. Below, you’ll see all nine players I ranked in the preseason and any player who currently ranks in the top 9 at that position. The current ranking drives the order and the preseason ranking and their current WAR is noted. Hit, miss, and push distinctions are based on where their first half places them going forward. For example, I can miss on a player even if I expect them to play much better in the second half if their first half was so poor that it is impossible to make up the ground overall.
We’ve already covered the catchers and first basemen, so let’s move on to first base. Here’s The Nine Best Second Basemen for 2013. Numbers are as of the All-Star Break.
81. Dustin Ackley, Mariners (Preseason Rank: 9, 2013 WAR: -0.6)
I would feel worse about Ackley if the rest of this list wasn’t as good as it is. I whiffed on this one. Ackley might have a future yet in MLB, but he’s not going to be a top 2B for 2013 unless something otherworldly happens. MISS
26. Aaron Hill, Dbacks (Preseason Rank: 4, 2013 WAR: 0.5)
Hill’s rate stats are great, he just got hurt and has only played 30 games after fracturing his hand. That’s not an “injury-prone” kind of injury, so it’s not like the kind of thing you should account for when considering a ranking because it could happen to anyone. This one is off, but for good reason. MISS
13. Ian Kinsler, Rangers (Preseason Rank: 5, 2013 WAR: 1.4)
Kinsler is much the same as Hill, as he missed time with an injury. The rate stats are good, but he hasn’t accumulated the value because he’s about 20-25 games short of his competitors. No sweat. PUSH
12. Neil Walker, Pirates (Preseason Rank: 7, 2013 WAR: 1.5)
Walker, too, is having a good season but missed a bit of time with an injury. He’s still pretty close to on track to finish 7th among 2B, so no issues here. HIT
10. Brandon Phillips, Reds (Preseason Rank: 6, 2013 WAR: 2.0)
Phillips is pretty much who I thought he’d be. A low on base, solid power guy who plays good defense. His precise ranking isn’t dead on, but it’s very close and there’s no reason to think he won’t be right around 6-8 when all is said and done. HIT
9. Marco Scutaro, Giants (Preseason Rank: N/A, 2013 WAR: 2.1)
Scutaro is a guy who has gotten better as he’s aged and is doing a nice job getting on base and limiting strikeouts. I had him out of the top 9, but not that far. I’ll call it a push and see how things go. He’d certainly have been 10-13th before the season. PUSH
8. Ben Zobrist, Rays (Preseason Rank: 2 among RF, 2013 WAR: 2.2)
Zobrist started the year in RF and I could only rank him in one place. I ranked him as the 2nd best RF in baseball. Nothing you can do about that. PUSH
7. Omar Infante, Tigers (Preseason Rank: N/A, 2013 WAR: 2.4)
Infante has done a very nice job improving his defensive and baserunning game, which has done a lot to improve his overall value. Infante was a middle of the pack guy for me, so I undershot him a little to this point. MISS
6. Howie Kendrick, Angels (Preseason Rank: N/A, 2013 WAR: 2.4)
Kendrick is another guy who I left just outside the list, and that’s on me. He’s having a strong year with the bat and it’s carrying him onto the list. MISS
5. Chase Utley, Phillies (Preseason Rank: 1, 2013 WAR: 2.6)
I’m a huge Utley fan and ranked him first as a bit of bold prediction that he’d stay healthy. He’s the best 2B in baseball in my book but he’s had trouble staying healthy, and despite missing about 25 games, he’s still 5th on this list. If he plays 65 games the rest of the way at the pace he’s on, we’re talking about a 5+ win player in 130 games. I’ll stand by him. He won’t finish first, but he’s definitely going to stick in the top five. HIT
4. Jason Kipnis, Indians (Preseason Rank: 8, 2013 WAR: 3.4)
Kipnis was one of those young players coming into the season who could easily have taken the leap or faded back. He’s done the former and has established himself as one of the game’s better power hitting second basemen with .514 SLG to go with his .383 OBP and good baserunning. Kipnis may not sustain this pace, but he’s a very good second baseman who I expect to finish in the 4-7 range this season. HIT
3. Dustin Pedroia, Red Sox (Preseason Rank: 3, 2013 WAR: 3.7)
Number 3, nailed it. Pedroia is just a great all-around player. I don’t think much else needs to be said about a guy who gets on base, hits for solid power, plays good defense, and runs the bases well. Pedroia is great. HIT
2. Robinson Cano, Yankees (Preseason Rank: 2, 2013 WAR: 3.8)
Another direct hit. Cano is a very good hitter, trailing only Kipnis and the guy who is 1st on the list in wRC+ and his defense and baserunning are about average. He’s been the only Yankees who can stay healthy and he’s setting himself up for a big payday. HIT
1. Matt Carpenter, Cardinals (Preseason Rank: N/A, 2013 WAR: 4.3)
I really like Carpenter as a player, I just had no idea he was going to turn into this guy. Pretty much everyone will tell you he’s turned himself into a much better player and when I wrote the original list he wasn’t even a lock to get the 2B job. He’s done a great job. He’s the best hitting 2B in baseball right now and is playing great defense. MISS
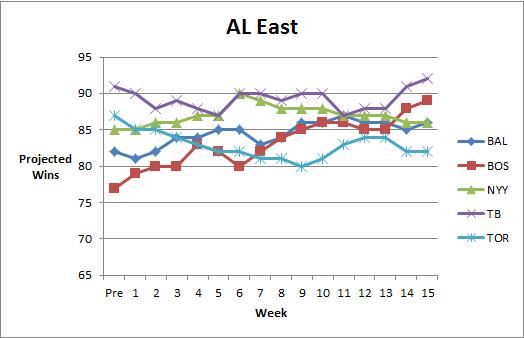
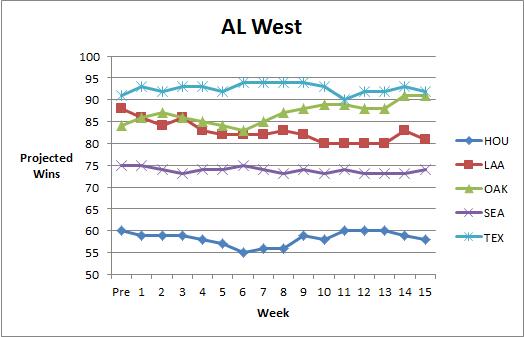
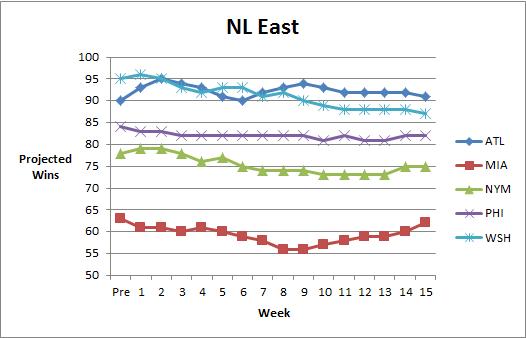
Dynamic Standings Projection (July 17, 2013)
In case you missed it, in April we launched our Dynamic Standings Projection feature on New English D. A full explanation of the methodology can be found here or by clicking the tab at the top of the page. This project seeks to provide a reasoned and cautious approach to updating our beliefs about the baseball future. You can find a summarization of the original projections here. You’ll notice a column on the far right that indicates the difference in projected wins from the preseason prediction. Positive numbers mean teams are now projected to win more games and negative numbers mean a team is now projected to win fewer games. You’ll notice a series of graphs below the standings section that track how the projections have evolved over the course of the year.
This Dynamic Standings Projection is updated through the All-Star break.
| 17-Jul | W | L | PreDiff | |
| TB | 92 | 70 | 0.568 | 1 |
| BOS | 89 | 73 | 0.549 | 12 |
| NYY | 86 | 76 | 0.531 | 1 |
| BAL | 86 | 76 | 0.531 | 4 |
| TOR | 82 | 80 | 0.506 | -5 |
| W | L | PreDiff | ||
| DET | 91 | 71 | 0.562 | -3 |
| CLE | 80 | 82 | 0.494 | 9 |
| KC | 76 | 86 | 0.469 | 0 |
| CWS | 73 | 89 | 0.451 | -10 |
| MIN | 67 | 95 | 0.414 | 2 |
| W | L | PreDiff | ||
| TEX | 92 | 70 | 0.568 | 1 |
| OAK | 91 | 71 | 0.562 | 7 |
| LAA | 81 | 81 | 0.500 | -7 |
| SEA | 74 | 88 | 0.457 | -1 |
| HOU | 58 | 104 | 0.358 | -2 |
| W | L | PreDiff | ||
| ATL | 91 | 71 | 0.562 | 1 |
| WSH | 87 | 75 | 0.537 | -8 |
| PHI | 82 | 80 | 0.506 | -2 |
| NYM | 75 | 87 | 0.463 | -3 |
| MIA | 62 | 100 | 0.383 | -1 |
| W | L | PreDiff | ||
| STL | 94 | 68 | 0.580 | 6 |
| CIN | 91 | 71 | 0.562 | -1 |
| PIT | 91 | 71 | 0.562 | 9 |
| MIL | 71 | 91 | 0.438 | -8 |
| CHC | 71 | 91 | 0.438 | 3 |
| W | L | PreDiff | ||
| LAD | 84 | 78 | 0.519 | -4 |
| ARZ | 84 | 78 | 0.519 | 2 |
| SF | 81 | 81 | 0.500 | -10 |
| SD | 75 | 87 | 0.463 | -3 |
| COL | 72 | 90 | 0.444 | 9 |


The Morning Edition (July 17, 2013)
From Last Night:
- The AL combines to shut out the NL to earn home field in the WS
- Cabrera scores the go ahead run
- MLB and players tribute Mariano Rivera as he comes in for a perfect 8th inning
What I’m Watching Today:
- Nothing. There is no baseball. This is the worst.
The Big Question:
- Did you like Leyland going to Rivera in the 8th?
Leyland did it to make sure he got in the game, but I liked it for a different reason. This way, Rivera got to walk off the mound to a standing ovation rather than have the team come out onto the field in the 9th. I think it allowed for a better tribute, and the actual inning doesn’t really matter. He’s known for pitching in the 9th, but he should be remembered for being the best reliever, period. The inning doesn’t matter. I enjoyed the game. Let’s get back to baseball.
A Real Fans’ Guide to Watching The All-Star Game
If you’re a real baseball fan, I’m sorry, but the All-Star Game isn’t designed to entertain you. It might entertain you anyway, but the game is for the casual fan. It’s announced by Joe Buck and Tim McCarver. They will interview celebrities. They will talk during the entire game about baseball stories that you are already well versed in. Go ahead and count the number of times they talk about a Yankee who isn’t playing in the game. It will be more than 5, I promised. They’re also going to get a lot of facts wrong about players because they aren’t equipped to handle preparation on 70 players and the season they are having.
“Brett Cecil? Who’s that?! Some guy from Canada, I think. He’s a reliever who doesn’t pitch the 9th inning and he’s in the ASG? What?” is something I would expect to hear Joe Buck say around 9:50pm tonight. You can also expect to hear something about the great seasons Matt Moore and Chris Tillman are having because they are 13-3 and 11-3, respectively. In case you’re wondering, they’re 13th and 22nd in ERA and 16th and 38th in FIP just among qualifying AL starters, but Buck and McCarver don’t know that because they only watch baseball when they are paid to broadcast it.
Basically, if you want to listen to thoughtful baseball analysis that includes accurate commentary on the first half, or simply about the game in front of you, that isn’t an option tonight. Tonight is about Fox pumping up their fall shows and their new 24 hour sports network, Fox Sports 1.
You also won’t see the game’s best players because some didn’t get picked because players and managers don’t look at the right statistics or because some of the game’s elite players didn’t have excellent first halves. The game should either be a showcase of great first halves or of the game’s biggest stars, and whichever side you prefer, tonight will be lacking for you if you actually know stuff about baseball.
So I’m sorry, this is how it is. But you can still have fun because it’s baseball. Here are five key steps:
1. Tune Out The Announcers
This is the simplest and more important of all my tips. Joe Buck and Tim McCarver have nothing important or interesting to say. The only reason to listen to them is if you’re planning to mock them on Twitter or if someone has invaded the press box and no one is live tweeting it. You’ll enjoy the game a lot more if you don’t hear the announcers say stupid things about baseball.
2. Keep MLB At Bat Open
I can’t stress this enough. Fox will not tell you when players are replaced if they’re on defense and they won’t tell you where they are now hitting in the batting order. Last year, there were about 5 changes one inning and they told you about one of them before just giving up and going back to talking about Josh Hamilton’s impending free agency. If you actually want to know who is playing in the game, it is your responsibility to stay on top of it.
3. Use Twitter
Just because Fox doesn’t care about the real fan doesn’t mean baseball writers and fans on Twitter don’t. If you want to see interesting stats or real commentary, jump on Twitter and follow along. It will be much better.
4. Do Your Homework
The key here is to familiarize yourself with pitchers who you haven’t had a chance to see with your own eyes very much. You know who Max Scherzer and Clayton Kershaw are and you’ve seen them throw 100 times because you, the real fan, enjoy beauty. However, you may not have had a chance to watch many Patrick Corbin starts. Head over to Brooks Baseball and pull up each pitcher’s repertoire so that you know if you should be looking for a breaking ball or high heat on the 1-2 pitch you’re about to see.
5. Focus On The Matchups
The All-Star Game can’t really be thought of as a real game, even though “it counts.” Players only play a few innings, starters go one or two innings, and managers make changes based on show. That’s fine, because it’s really an exhibition. But for the die-hard baseball fan who just needs to be watching baseball in order to properly live, it’s not the best offering because it’s not a real game. For you, focus on the matchups. You’re going to get to watch Matt Harvey face Trout, Cano, and Cabrera all in a row. Then it’s going to be Kershaw and against 3 more great hitters. You’re usually scouring MLB.TV to watch Sale versus Harper, but on this night, MLB is bringing every matchup to you. Appreciate the ease with which you’ll be able to watch these pitchers go after the hitters.
So as you sit down to watch tonight, remember that this game isn’t designed for the real baseball fan. This is a game that caters to people who think baseball is boring.

The coverage is going to be bad and the game won’t look anything like a matchup between two real baseball teams, but you’re going to watch because you can’t not watch baseball and you want to cheer for your team’s players and your league. These steps should help, but if they don’t just remember there will be real baseball tomorrow…Thursday…oh man…Friday?! Really? You’re on your own everyone.
The Morning Edition (July 16, 2013)
From Last Night:
- Cespedes defeats Harper in the finals of the HR Derby
What I’m Watching Today:
- Scherzer leads the AL into Citi Field against Matt Harvey (8p Eastern)
The Big Question:
- Can the AL’s power laden lineup return home-field to the Junior Circuit?
It’s good to see Jim Leyland didn’t listen to Cliff Floyd who wanted to put Adam Jones and his low OBP in the leadoff spot and decided to go with Trout. He’ll start the game in the box against Matt Harvey. The future of baseball.
Putting No Hitters Into The Shredder
A couple of weeks ago, Homer Bailey threw a no-hitter and almost everyone celebrated with the usual joy. I was among them. No hitters are fun and I love them for their drama and their rarity. One voice, however, stood out, not in opposition to Bailey, but it opposition to the attention given to no-hitters.
Brian Kenny made the case on Twitter and on MLB Now that no-hitters are not, by definition, the best set of starts even though that’s how most people treat them. Pitchers are trying to prevent runs and to prevent runs you want to limit baserunners. Baserunners reach via hits, walks, and HBPs and we shouldn’t place special focus on one type of way that hitters reach base. A one hit shutout is, according to Kenny (and basic logic) a much better performance than a 6 walk no-hitter.
Kenny is essentially making the other side of the batting average versus OBP argument. Getting on base is what matters for hitters, keeping guys off the bases is what matters for pitchers. He’s right. The quality of the start should be judged by baserunners rather than type of baserunner. I’m on board.
But no-hitters can still be celebrated for their rarity. Kenny makes the point that we shouldn’t celebrate no-hitters as much when the pitcher allows many baserunners because 6 walks is not better than 2 hits and 0 walks. I’m going to take a slightly different path. I’m going to argue we should celebrate no-hitters, but also the other great performances that aren’t no-hitters. We should recalibrate how we treat no-hitters, but that doesn’t mean they aren’t impressive. Five walks are bad, but it’s still really hard to not allow any hits.
Let’s go inside the numbers.
Most No-Hitters Are Great
Since 1916, there have been 204 no-hitters in MLB and all of our data will carry from 1916 through Saturday (7/13/2013) and will focus only on complete games. Let’s start with the number of baserunners allowed in each no hitter in MLB history:
| Baserunners | % of All No Hitters | Count |
| 0 | 10.3 | 21 |
| 1 | 20.6 | 42 |
| 2 | 17.6 | 36 |
| 3 | 14.7 | 30 |
| 4 | 14.2 | 29 |
| 5 | 7.8 | 16 |
| 6 | 5.4 | 11 |
| 7 | 3.9 | 8 |
| 8 | 3.4 | 7 |
| 9 | 0.5 | 1 |
| 10 | 1 | 2 |
| 11 | 0.5 | 1 |
What you can see here is that while some no-hitters aren’t great performances, most no hitters are excellent. 85% of all no-hitters contain 5 or fewer baserunners allowed with the average number of baserunners allowed coming in a 3.03 with a standard deviation of 2.31. What those numbers tell us is that most no-hitters are elite starts and only occasionally worthy of criticism.
But Many Equally Great Starts Aren’t No-Hitters
If you just looked at those numbers, you’d probably feel comfortable celebrating no-hitters because most no-hitters are, in fact, great starts. But there is another side that you don’t see with those numbers. What comes next is what percentage of complete games with a given number of baserunners are no hitters:
| Baserunners | NH/CG % |
| 0 | 100.000 |
| 1 | 30.435 |
| 2 | 7.725 |
| 3 | 2.591 |
| 4 | 1.234 |
| 5 | 0.399 |
| 6 | 0.181 |
| 7 | 0.103 |
| 8 | 0.077 |
| 9 | 0.010 |
| 10 | 0.022 |
| 11 | 0.013 |
This is a more troubling table. We can all agreed that perfect games are great, but aside from that these numbers tell us something else. What you see here is that, for example, 70% of all CG in which a starter allows 1 baserunner aren’t no-hitters. And it gets worse as we move down the list. 92% of all 2 baserunner starts don’t get recognized as no hitters. It’s 97% at 3 baserunners.
If we sit back and agree we should judge pitchers on baserunners allowed, no-hitters are quite deceptive. We’re leaving out a ton of great starts because a pitcher allowed a hit instead of a walk even though they allowed the same number of men to reach base. This is compelling evidence. If we’re looking at the game holistically, no-hitters are interesting because allowing no hits is very rare, but focusing on them is wrong because they make up such a small fraction of each set of complete games.
It’s really rare to see a no-hitter, and it’s rare to see no-hitters that aren’t excellent performances. But there are a ton of starts that are equally as valuable as no-hitters that get far less attention. Let’s put the numbers side by side.
| Baserunners | NH | Non NH CG |
| 0 | 21 | 0 |
| 1 | 42 | 96 |
| 2 | 36 | 430 |
| 3 | 30 | 1128 |
| 4 | 29 | 2321 |
| 5 | 16 | 3999 |
| 6 | 11 | 6079 |
| 7 | 8 | 7734 |
| 8 | 7 | 9121 |
| 9 | 1 | 9620 |
| 10 | 2 | 9070 |
| 11 | 1 | 7924 |
There are 96 1 hitters in MLB history with no other baserunners allowed. Those are better starts than the 29 no hitters with 4 baserunners allowed, but they don’t get the attention they deserve. 430 times a pitcher has allowed 2 baserunners in a start and not gotten credit for a no-hitter while 36 pitchers who had essentially the same outing are credited with no-hitters.
“So, Tell Me What To Think.”
I’m not anti-no-hitter. I love them and they are a lot of fun, but when you take a look at these numbers, you can easily see that we’re celebrating something because it’s rare, not necessarily because it’s the best. Plenty of starts that aren’t no hitters are better than starts that were no hitters, even before we look at strikeouts and great defensive plays.
Kenny is making a very good point when he tells you not to be bound by the statistics of the 1880s. Walks aren’t outs in disguise. They are valuable offensive tools and shouldn’t be brushed aside as meaningless for pitchers. No-hitters are a rare subset of starts, but they are not by definition, the best starts. Plenty of pitchers have thrown 2 hit shutouts who never got to celebrate like Tim Lincecum did when he allowed 5 baserunners. All I’m asking is that you give those guys some credit too.
You don’t have to stop enjoying no-hitters. In fact, you should enjoy them just the same. Baseball is fun and is meant to captivate you. I love no-hitters because they can vanish on every pitch. You can see walks coming when the pitcher allows the 3 ball. They’re super important, but are much less dramatic.
All told, the evidence tells us that no-hitters shouldn’t be revered as great starts, but rather as particularly interesting ones. We should also give more credit to great starts in which pitchers allow hits because those guys are getting short changed. A one hit shutout with 10 strikeouts is an amazing start. A 4 walk no hitters with 4 strikeouts is just very good.
Consider each start in isolation. Allowing no hits is difficult, but if you walk a bunch of batters, you’re not doing your job. What Kenny is really asking you to do is to think for yourself and to analyze the world around you. No-hitters are fun and usually great. But not always. And non no-hitters are sometimes better. You can judge for yourself. The following lines are from Saturday. I know which I’d take if you asked which was better.
Greinke: 9 IP, 2 H, 0 R, 1 BB, 9 K (110 pitches) vs Colorado
Lincecum: 9 IP, 0 H, 0 R, 4 BB, 1 HBP, 13 K (148 pitches) vs SD
The Morning Edition (July 15, 2013)
From Last Night:
- Archer dominates the Astros with a CGSO, 0 BB, 8 K performance
- Iwakuma leads the M’s past the Angels
- Workman flirts with a no-no for the Red Sox but Donaldson walks off for the A’s
- Stop me if you’re heard this, Davis homers, O’s win
- The Phillies beat the White Sox in extras…again
- 3 runs in the 10th get the Nats past the Fish
- The Twins shell Sabathia
What I’m Watching Today:
- HR Derby (8pm Eastern)
The Big Question:
- Will Chris Davis carry his homerun streak into the derby?
I’m not a huge fan of the HR Derby. It’s a fine event, but I think ESPN makes it pretty boring to watch with their interviews with players from the Yankees and Red Sox and commentary about the first half from analysts I don’t really want to listen to. A lot of people have offered ways to freshen the competition, but I think freshening the coverage could be just as good. Instead of Chris Berman screaming “back, back, back…” I’d like to see more coverage focusing on player reactions. We could mic up 15 or 20 players and just bounce around as they talk to each other about the season and the big swings. I think that would be cool. Or we could just get Vin Scully. Either way, I’m pulling for Prince, but will take Davis to win.
