SOEFA Sunday: Reliever Rankings Update (July 21, 2013)

You’ll recall earlier this year we introduced our very own reliever rankings called SOEFA, which you can read about in detail here. For a brief refresher, it combines strand rate, expected OBP against, ERA-, and FIP- into a deviation from league average. Zero is average, and will generally range between -2.5 to 2.5. This includes all pitchers who have thrown at least 20 IP in relief. Should you wish to know the SOEFA for any other reliever, or on a day that isn’t Sunday, hit us on Twitter or in the comments section.
| Rank | Player | Team | SOEFA |
| 1 | Alex Torres | Rays | 1 |
| 2 | Joaquin Benoit | Tigers | 0.99 |
| 3 | Neal Cotts | Rangers | 0.97 |
| 4 | Drew Smyly | Tigers | 0.96 |
| 5 | Mark Melancon | Pirates | 0.89 |
| 6 | Sergio Romo | Giants | 0.88 |
| 7 | Greg Holland | Royals | 0.88 |
| 8 | Will Harris | Diamondbacks | 0.86 |
| 9 | Kenley Jansen | Dodgers | 0.81 |
| 10 | Jason Grilli | Pirates | 0.8 |
| 11 | Glen Perkins | Twins | 0.8 |
| 12 | Jesse Crain | White Sox | 0.78 |
| 13 | Javier Lopez | Giants | 0.77 |
| 14 | Casey Fien | Twins | 0.72 |
| 15 | Jordan Walden | Braves | 0.7 |
| 16 | Sam LeCure | Reds | 0.69 |
| 17 | Trevor Rosenthal | Cardinals | 0.68 |
| 18 | Koji Uehara | Red Sox | 0.68 |
| 19 | Joe Thatcher | Padres | 0.67 |
| 20 | Craig Kimbrel | Braves | 0.66 |
| 21 | Preston Claiborne | Yankees | 0.66 |
| 22 | Shawn Kelley | Yankees | 0.63 |
| 23 | Edward Mujica | Cardinals | 0.62 |
| 24 | Casey Janssen | Blue Jays | 0.62 |
| 25 | Brett Cecil | Blue Jays | 0.61 |
| 26 | Oliver Perez | Mariners | 0.61 |
| 27 | Sean Doolittle | Athletics | 0.58 |
| 28 | David Robertson | Yankees | 0.58 |
| 29 | Manny Parra | Reds | 0.56 |
| 30 | Francisco Rodriguez | Brewers | 0.55 |
| 31 | Junichi Tazawa | Red Sox | 0.54 |
| 32 | Boone Logan | Yankees | 0.54 |
| 33 | Seth Maness | Cardinals | 0.54 |
| 34 | Ernesto Frieri | Angels | 0.54 |
| 35 | Paco Rodriguez | Dodgers | 0.53 |
| 36 | Andrew Bailey | Red Sox | 0.52 |
| 37 | Dale Thayer | Padres | 0.51 |
| 38 | Brandon Kintzler | Brewers | 0.51 |
| 39 | Robbie Ross | Rangers | 0.5 |
| 40 | Sandy Rosario | Giants | 0.5 |
| 41 | Joel Peralta | Rays | 0.49 |
| 42 | Matt Belisle | Rockies | 0.48 |
| 43 | Edgmer Escalona | Rockies | 0.48 |
| 44 | Brian Matusz | Orioles | 0.48 |
| 45 | Andrew Miller | Red Sox | 0.48 |
| 46 | Jason Frasor | Rangers | 0.46 |
| 47 | Tommy Hunter | Orioles | 0.45 |
| 48 | Grant Balfour | Athletics | 0.45 |
| 49 | Aroldis Chapman | Reds | 0.45 |
| 50 | Darren O’Day | Orioles | 0.45 |
| 51 | Luis Avilan | Braves | 0.44 |
| 52 | Josh Collmenter | Diamondbacks | 0.43 |
| 53 | Scott Downs | Angels | 0.43 |
| 54 | Bobby Parnell | Mets | 0.43 |
| 55 | Luke Hochevar | Royals | 0.43 |
| 56 | Vin Mazzaro | Pirates | 0.43 |
| 57 | Kevin Gregg | Cubs | 0.42 |
| 58 | Matt Reynolds | Diamondbacks | 0.42 |
| 59 | Chad Gaudin | Giants | 0.41 |
| 60 | Chad Qualls | Marlins | 0.41 |
| 61 | Randy Choate | Cardinals | 0.41 |
| 62 | Jonathan Papelbon | Phillies | 0.41 |
| 63 | J.P. Howell | Dodgers | 0.39 |
| 64 | David Carpenter | Braves | 0.39 |
| 65 | Antonio Bastardo | Phillies | 0.39 |
| 66 | Tanner Scheppers | Rangers | 0.38 |
| 67 | Luke Gregerson | Padres | 0.38 |
| 68 | Addison Reed | White Sox | 0.37 |
| 69 | Tyler Clippard | Nationals | 0.36 |
| 70 | Tom Gorzelanny | Brewers | 0.35 |
| 71 | Steve Cishek | Marlins | 0.35 |
| 72 | Brad Ziegler | Diamondbacks | 0.34 |
| 73 | Cody Allen | Indians | 0.34 |
| 74 | James Russell | Cubs | 0.33 |
| 75 | Ryan Cook | Athletics | 0.33 |
| 76 | Rafael Soriano | Nationals | 0.32 |
| 77 | Jim Henderson | Brewers | 0.32 |
| 78 | Steve Delabar | Blue Jays | 0.31 |
| 79 | Jose Mijares | Giants | 0.3 |
| 80 | Craig Breslow | Red Sox | 0.27 |
| 81 | Michael Kohn | Angels | 0.27 |
| 82 | Pat Neshek | Athletics | 0.26 |
| 83 | Rafael Betancourt | Rockies | 0.26 |
| 84 | Alfredo Simon | Reds | 0.25 |
| 85 | Jean Machi | Giants | 0.25 |
| 86 | Jerome Williams | Angels | 0.25 |
| 87 | Tony Watson | Pirates | 0.25 |
| 88 | Fernando Rodney | Rays | 0.24 |
| 89 | Josh Outman | Rockies | 0.24 |
| 90 | Rex Brothers | Rockies | 0.23 |
| 91 | Nate Jones | White Sox | 0.23 |
| 92 | Justin Wilson | Pirates | 0.22 |
| 93 | Jamey Wright | Rays | 0.21 |
| 94 | Jim Johnson | Orioles | 0.21 |
| 95 | Jose Veras | Astros | 0.2 |
| 96 | Yoervis Medina | Mariners | 0.19 |
| 97 | Charlie Furbush | Mariners | 0.18 |
| 98 | Santiago Casilla | Giants | 0.18 |
| 99 | Jesse Chavez | Athletics | 0.17 |
| 100 | Anthony Swarzak | Twins | 0.16 |
| 101 | Joe Nathan | Rangers | 0.15 |
| 102 | Bryan Morris | Pirates | 0.13 |
| 103 | Dane de la Rosa | Angels | 0.13 |
| 104 | Alfredo Figaro | Brewers | 0.13 |
| 105 | Aaron Loup | Blue Jays | 0.13 |
| 106 | Mariano Rivera | Yankees | 0.11 |
| 107 | Matt Lindstrom | White Sox | 0.1 |
| 108 | Caleb Thielbar | Twins | 0.09 |
| 109 | Darren Oliver | Blue Jays | 0.09 |
| 110 | Jared Burton | Twins | 0.08 |
| 111 | Anthony Varvaro | Braves | 0.07 |
| 112 | John Axford | Brewers | 0.07 |
| 113 | Joe Kelly | Cardinals | 0.07 |
| 114 | Ross Wolf | Rangers | 0.06 |
| 115 | Logan Ondrusek | Reds | 0.06 |
| 116 | Tyson Ross | Padres | 0.05 |
| 117 | LaTroy Hawkins | Mets | 0.05 |
| 118 | Matt Thornton | – – – | 0.05 |
| 119 | Aaron Crow | Royals | 0.05 |
| 120 | Cesar Ramos | Rays | 0.05 |
| 121 | J.J. Hoover | Reds | 0.04 |
| 122 | Joe Smith | Indians | 0.04 |
| 123 | Drew Storen | Nationals | 0.04 |
| 124 | Tim Collins | Royals | 0.02 |
| 125 | Kevin Jepsen | Angels | 0.01 |
| 126 | Adam Ottavino | Rockies | 0 |
| 127 | A.J. Ramos | Marlins | 0 |
| 128 | Ryan Pressly | Twins | 0 |
| 129 | Tony Sipp | Diamondbacks | -0.01 |
| 130 | Mike Dunn | Marlins | -0.01 |
| 131 | Troy Patton | Orioles | -0.02 |
| 132 | Burke Badenhop | Brewers | -0.02 |
| 133 | Carter Capps | Mariners | -0.02 |
| 134 | Wilton Lopez | Rockies | -0.03 |
| 135 | Joe Ortiz | Rangers | -0.04 |
| 136 | Luke Putkonen | Tigers | -0.04 |
| 137 | Ryan Webb | Marlins | -0.06 |
| 138 | Chris Perez | Indians | -0.07 |
| 139 | David Hernandez | Diamondbacks | -0.07 |
| 140 | Heath Bell | Diamondbacks | -0.08 |
| 141 | Bryan Shaw | Indians | -0.09 |
| 142 | Brad Brach | Padres | -0.09 |
| 143 | Jake McGee | Rays | -0.09 |
| 144 | Darin Downs | Tigers | -0.11 |
| 145 | Scott Rice | Mets | -0.12 |
| 146 | Josh Edgin | Mets | -0.13 |
| 147 | Danny Farquhar | Mariners | -0.13 |
| 148 | Jerry Blevins | Athletics | -0.13 |
| 149 | Paul Clemens | Astros | -0.15 |
| 150 | Brad Lincoln | Blue Jays | -0.15 |
| 151 | Michael Gonzalez | Brewers | -0.15 |
| 152 | Matt Guerrier | – – – | -0.16 |
| 153 | Craig Stammen | Nationals | -0.16 |
| 154 | Greg Burke | Mets | -0.16 |
| 155 | Tim Stauffer | Padres | -0.17 |
| 156 | Brian Duensing | Twins | -0.18 |
| 157 | Tom Wilhelmsen | Mariners | -0.18 |
| 158 | Cory Gearrin | Braves | -0.18 |
| 159 | Joba Chamberlain | Yankees | -0.2 |
| 160 | Wesley Wright | Astros | -0.21 |
| 161 | Nick Hagadone | Indians | -0.21 |
| 162 | Jose Cisnero | Astros | -0.21 |
| 163 | Ronald Belisario | Dodgers | -0.24 |
| 164 | Blake Beavan | Mariners | -0.25 |
| 165 | Jonathan Broxton | Reds | -0.26 |
| 166 | Vinnie Pestano | Indians | -0.26 |
| 167 | Travis Blackley | Astros | -0.27 |
| 168 | Phil Coke | Tigers | -0.28 |
| 169 | Garrett Richards | Angels | -0.29 |
| 170 | George Kontos | Giants | -0.31 |
| 171 | Rich Hill | Indians | -0.31 |
| 172 | Josh Roenicke | Twins | -0.31 |
| 173 | Kyle Farnsworth | Rays | -0.32 |
| 174 | T.J. McFarland | Orioles | -0.36 |
| 175 | Mike Adams | Phillies | -0.39 |
| 176 | Clayton Mortensen | Red Sox | -0.4 |
| 177 | Al Alburquerque | Tigers | -0.42 |
| 178 | Matt Albers | Indians | -0.42 |
| 179 | Alex Wilson | Red Sox | -0.43 |
| 180 | Hector Ambriz | Astros | -0.44 |
| 181 | Pedro Strop | – – – | -0.45 |
| 182 | Brandon Lyon | Mets | -0.47 |
| 183 | Huston Street | Padres | -0.47 |
| 184 | Esmil Rogers | Blue Jays | -0.49 |
| 185 | Justin De Fratus | Phillies | -0.51 |
| 186 | Adam Warren | Yankees | -0.52 |
| 187 | Kelvin Herrera | Royals | -0.52 |
| 188 | Bruce Chen | Royals | -0.53 |
| 189 | Jeremy Horst | Phillies | -0.59 |
| 190 | Jeremy Affeldt | Giants | -0.64 |
| 191 | Henry Rodriguez | – – – | -0.7 |
| 192 | Carlos Marmol | Cubs | -0.72 |
| 193 | Michael Kirkman | Rangers | -0.72 |
| 194 | Anthony Bass | Padres | -0.9 |
| 195 | Hector Rondon | Cubs | -0.98 |
| 196 | Shawn Camp | Cubs | -1.02 |
| 197 | Brandon League | Dodgers | -1.66 |
RBI Are Misleading Even Over Entire Careers
In keeping with the recent theme, I’d like to take another look at RBI as a statistic. Recently, I’ve shown you why RBI can be misleading when comparing two players’ value and why having a lot of RBI doesn’t necessarily mean you had a good season. To catch up on these and other similar posts about baseball statistics, check out our new Stat Primer page.
Today, I’m turning my attention to RBI over entire careers. You’ve seen already that RBI aren’t a good way to measure players in individual seasons, but we’ve yet to see how well they do at explaining value in very large samples. The answer is not much better.
To evaluate this, I took every qualifying player from 1920 (when RBI became and official stat) to 2013 (2,917 in all) and calculated their career RBI rate by simply taking their RBI/Plate Appearances. This will allow us to control for how often each player came to the plate so Babe Ruth’s 10,000 PA can go up against Hank Aaron’s nearly 14,000. Next, I compared that RBI Rate to wRC+ (what’s wRC+?) which is a statistic that compares offensive value to league average while controlling for park effects. The simple explanation is that wRC+ is a rate statistic that controls for league average, meaning that a 110 wRC+ means the same thing in 1930 as it does in 1980. League average is 100 and every point above or below is a percent better or worse than league average in that era.
The results aren’t great for RBI as an individual statistic. Overall, the adjusted R squared is .4766 which means that about 48% of the variation in wRC+ can be explained by variation in RBI Rate. Put simply, players who have more RBI per PA are better hitters on average than those with fewer, but there is a lot of variation that isn’t explained by RBI Rate meaning you can’t just look at RBI and know how good a player was.
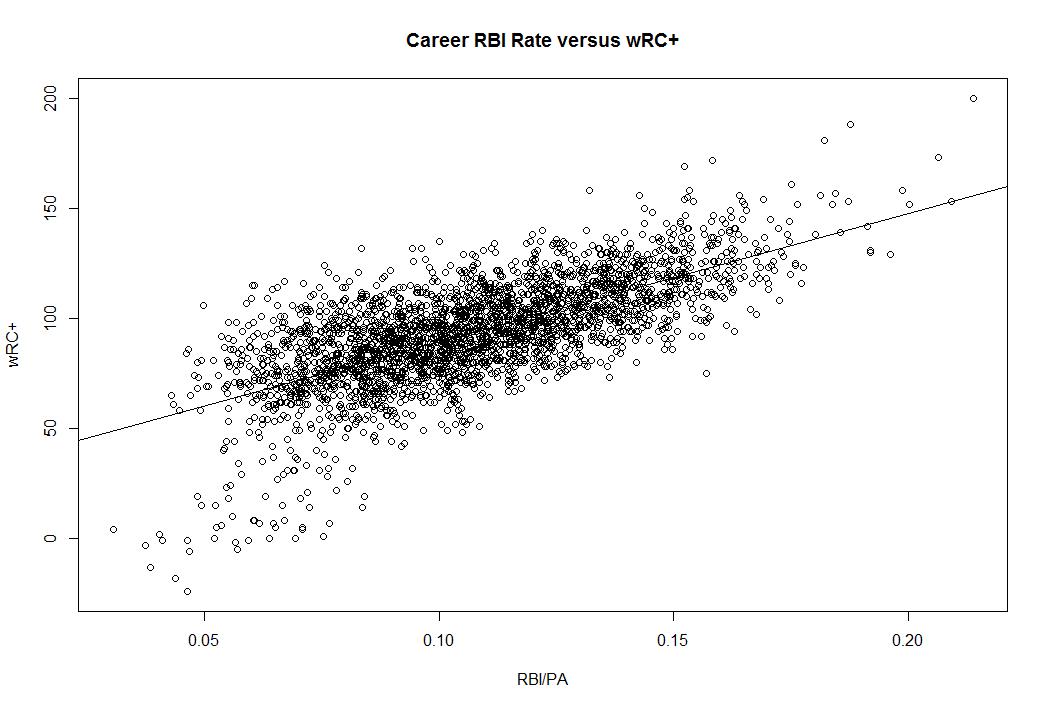
What this graph is showing you is quite striking. First, notice how many players have similar RBI Rates who have wildly different wRC+ and second notice how players with the same wRC+ have wildly different RBI Rates. Generally more RBI mean you’re better, but there’s a lot left unexplained by this stat.
Like I’ve said before, RBI isn’t a made up stat that is useless like wins for a pitcher because RBI reflects a real event on the field and is critical for score keeping. The problem with RBI is that it is too dependent on context and the team around you. Two players who are equally good on offense can have very different RBI Rates because they have a different number of opportunities to drive in runs. Similarly, players who drive in the same number of runs may be much different offensive players in terms of quality.
Even if you’re someone who thinks clutch hitting is a predictive skill, surely you can recognize that RBI is extremely context dependent. Your RBI total depends on how good you are, but also how many runners are on base, how many outs there are, and where the runners are positioned on the bases – all of which you have no control over as a hitter.
I’m on the front lines of the #KillTheWin movement, but I don’t think we should kill the RBI. The RBI just needs to be put in proper context and understood as a descriptive stat and not a measure of player value. Miguel Cabrera gets a lot of RBI, partially because he’s awesome, but also because his team gets on base in front of him all the time. Driving in runs is an important part of winning, it just isn’t an individual statistic. It’s a team statistic and we should view it as such.
You’ve seen that RBI can mislead you when comparing two players, that bad players can have a lot of RBI, and now you’ve seen that this isn’t something that evens out over time. RBI is simply not a good way to measure individual value when it can tell you the wrong thing this much of the time. There are better ways to measure the same concepts like wOBA, wRC+, and wRAA. Feel free to click on the links to learn more and check back for more on why you should put less stock in RBI.
Torii Hunter Has Kept It Up

Aside from re-upping with Anibal Sanchez, the Tigers big offseason move was signing Torii Hunter to a two year deal to man RF at Comerica Park. He was coming off of a career year in which he posted a rather high Batting Average on Balls In Play (BABIP) which led most to believe he wouldn’t perform as well in 2013 as he did in 2012.
That’s a pretty simple belief and one that had a lot of merit. Players don’t often make dramatic changes to their offensive approach in their late 30s and have career renaissances. But after almost 100 games in 2013, it’s starting to look like Hunter’s change is real and sustainable and that he might just be the player he was last year.
Let’s start with a couple quick points. His defensive and baserunner numbers are way down this season. He’s playing around league average in the field and on the bases despite very good numbers in 2012. I can fully confirm the defensive issues as Hunter has made his share of bonehead plays in RF. In general, he’s not the great defender he once was, but he’s been perfectly serviceable out there and is a big step up from Brennan Boesch.
This post is about his offense because that’s the interesting thing. Let’s start with the basic career trends before we get into the last two seasons. If we just look at his basic offensive rate, he’s aged pretty well (what’s wRC+?)

But the key with Hunter was that he used to hit for more power with a lower on base. As he’s aged, those numbers have trended in opposite directions:

It’s not the easiest thing to see, but notice how his OBP has been picking up late in his career while his slugging is consistently much lower than it was from 2002-2009. This might make some sense if Torii was becoming a more selective hitter who drew more walks, but that’s not happening:
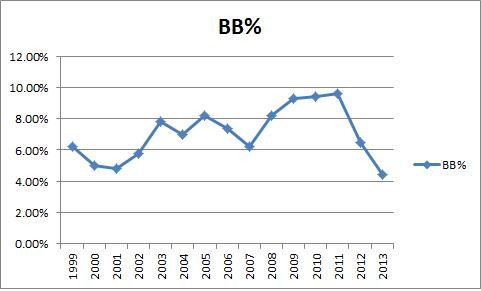
Um…what? Hunter is getting his offensive value from his new found OBP, but he’s walking substantially less that he used to. This is quite interesting. Obviously, you’ve figured out by now that the only way to do this is to substantially improve your batting average:

So this is a pretty clear story. Hunter is picking up his offensive value as he’s gotten older by getting on base via hits more often and hitting for less power than his younger self. In 2012 he posted a career high batting average and in 2013 is just ahead of that pace as I write this. Hunter is having another great offensive season relative to his career norm and age, and he’s doing it with fewer walks and long balls and more base hits.
He’s where the sustainability comes into play. As you can read about at the BABIP link above, you know that significant deviations from career BABIP norms are usually the kind of thing that won’t sustain themselves and players will revert back to normal. Here’s Hunter’s BABIP:
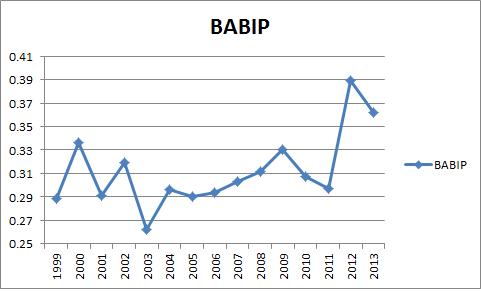
So that’s way different from anything he’s ever done. Early in his career he pushed .330 a couple times but he’s above .360 the last two seasons. What’s going on here? Well the reports are he has changed his approach as he’s aged in acknowledgement that he is no longer the power bat who hits for extra bases, but now it’s his job to get on for Pujols last year and Cabrera this year.
At the end of last season the word on Hunter was that he had a great year but a lot of it was luck driven by a high-unsustainable BABIP. Well he’s doing it again. We’re now at the point where Hunter has done this for almost 1,000 plate appearances, so it’s time to start believing. The Angels gave him Pujols in 2012 and then he moved to the Tigers in 2013 and got Cabrera, which instructed Hunter that his role would now be different and he would change his approach accordingly.
I’m now at the point where I think this is a real sustainable change. We’ve heard him talk about changing as he’s aged, but anyone can have a lucky year. We’re now to the point where it looks like this is for real. Take a look at his 2012 and 2013 numbers next to each other. Remember LA is a tougher park, but otherwise, this is crazy:
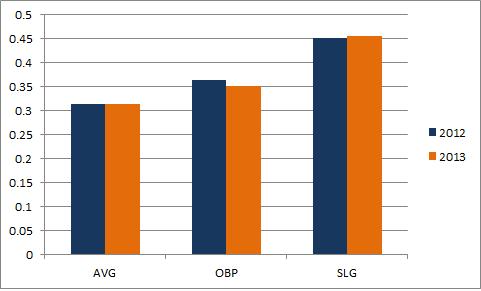
Hunter is doing pretty much the exact same thing he did last season. More hits, fewer walks, less power than his career numbers and a much higher BABIP. This is the new Torii Hunter and it’s real. It’s not luck. He’s different and it’s working. He may not be the defender or runner he once was, but he’s still league average in a corner and is something close to 20% better than league average at the plate. He’s gone from a power guy with a low on base like Adam Jones to a high OBP, lower power guy that’s just as valuable. That’s pretty good adaptation.
He’s posting the highest swing percentage and highest contact rates of his career. Here’s where it gets good. You can see it in other data. Check out his batted ball data, which only exists back to 2002:
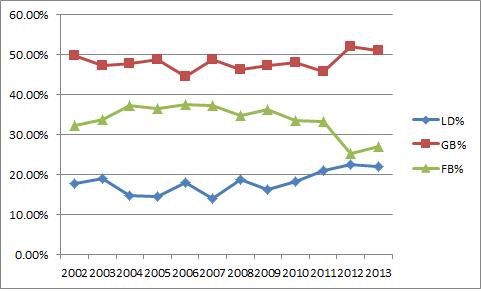
He’s cutting down on fly balls in exchange for more line drives and ground balls. He knows he doesn’t have the power he used to, so now he’s becoming a singles hitter who occasionally swings for the fences. It’s this type of change that leads me to believe the BABIP change is real and sustainable. Hunter is swinging more and making more contact while hitting the ball in the air less. That’s exactly what I’d tell someone to do if they were aging and trying to stay valuable without a great eye at the plate. Hunter has had some good walking years, but it’s never been his strong suit. Instead of adding discipline in his golden years, he’s adding singles. And it’s working.
Torii Hunter is on track for a 2.5-3.0 WAR season despite very pedestrian defensive and baserunning numbers. He’s doing a very nice job at the plate and there’s no reason to think it’s a fluke. The Tigers gambled on Hunter’s new approach being real and it’s working for them as much as it’s working for him.
The Nine Worst 100 RBI Seasons in MLB History
Yesterday we took a look at a case study in RBI to help explain why it’s a misleading statistic. The idea here is that RBI is very dependent on your team and the context you’re in. Two identical hitters will accumulate much different RBI totals depending on how many runners on base ahead of them and which bases those runners occupy. You can read all about it here.
Today, I’d like to start highlighting some broader evidence of the problems with RBI as a stat. You’ve already seen how a better season can result in fewer RBI depending on how the team around you performs, now let’s take a look at The Nine Worst 100 RBI Seasons in MLB History. This list is meant to show you that you can have a very poor season and still accumulate 100 RBI, which is often considered a magic number by people who value RBI. The phrase “100 RBI guy” is something you might here an analyst like John Kruk say when commenting on a player’s value. I’m here to show you that 100 RBI does not necessarily mean the player had a very good season.
Below, we have The Nine worst seasons by wRC+ since 1901 in which the player drove in 100 or more runs. wRC+ is a statistic that measures how a player stacks up to other players in the league and it factors in park effects. It’s easy to interpret the number. A wRC+ of 100 is league average and every point above 100 is a percent better than average a percent below average is a 99 wRC+. For example, an 85 wRC+ is a player who is 15% worse than a league average player. 115 wRC+ is 15% better than league average. You can read all about wRC+ here.
| Rank | Season | Name | Team | PA | RBI | AVG | OBP | SLG | wRC+ |
| 9 | 1927 | Glenn Wright | Pirates | 626 | 105 | 0.281 | 0.328 | 0.388 | 86 |
| 8 | 2006 | Jeff Francoeur | Braves | 686 | 103 | 0.260 | 0.293 | 0.449 | 84 |
| 7 | 1983 | Tony Armas | Red Sox | 613 | 107 | 0.218 | 0.254 | 0.453 | 84 |
| 6 | 1934 | Ray Pepper | Browns | 598 | 101 | 0.298 | 0.333 | 0.399 | 82 |
| 5 | 1990 | Joe Carter | Padres | 697 | 115 | 0.232 | 0.290 | 0.391 | 80 |
| 4 | 1993 | Ruben Sierra | Athletics | 692 | 101 | 0.233 | 0.288 | 0.390 | 79 |
| 3 | 1999 | Vinny Castilla | Rockies | 674 | 102 | 0.275 | 0.331 | 0.478 | 78 |
| 2 | 2004 | Tony Batista | Expos | 650 | 110 | 0.241 | 0.272 | 0.455 | 77 |
| 1 | 1997 | Joe Carter | Blue Jays | 668 | 102 | 0.234 | 0.284 | 0.399 | 72 |
What you have here is a list of players who are “100 RBI guys” who were substantially worse than league average. Perhaps some comparisons might be help. Let’s find a couple of current MLB players who slot in around 70-85 wRC+. Brendan Ryan has a career 72 wRC+. Jason Nix is at 72. Ramon Santiago is 75. Willie Bloomquist is 78. Ruben Tejada is 83. I’m not saying any of the guys on this list are bad players, I’m saying they all had bad seasons in which they still had 100 or more RBI. They guys had Ramon Santiago seasons at the plate and drove in over 100 runs.
Do you really want to place so much stock in a statistic that says a guy who hits like Brendan Ryan is among the league’s best hitters? I don’t. RBI is very much a team dependent statistic and we shouldn’t use it to value individual players. Players can’t control the situations you put them into, they can only control what they do in those situations. As seen here, even players who don’t do very well can still add RBI to their resumes if they are put into situations with many runners on base.
Jason Marquis, Expectations, and Reality
 Should you be interested, I recently wrote a piece over in the Community Research section of Fangraphs breaking down the extreme difference between Jason Marquis’ very solid ERA and his all-time awful FIP. Not only is Marquis over-performing, he’s over-performing at an unprecedented level. I’ve mixed in some historical data and a comparison to a current MLB pitcher who has the same peripheral numbers but a much worse ERA. I hope you find the analysis interesting.
Check out the entire thing over at Fangraphs.
RBI Is A Misleading Statistic: A Case Study
One of our missions here at New English D is to help popularize sabermetric concepts and statistics and diminish the use of certain traditional stats that are very misleading. If you’re a return reader, you’ve no doubt seen our series about the pitcher win:
- The Nine Best Seasons Under 9 Wins
- The Nine Worst 20 Win Seasons
- Comparing Wins Over Entire Careers
- A Case Study from 2012 about Wins
- 12 Assorted Facts Regarding Wins
I encourage you to read those posts if you haven’t already, but I’m confident in the case I’ve laid out. Wins aren’t a good way to measure pitchers’ performance and I’ll let those five links stand on their own. Today, I’d like to move forward and pick up the mantle with another statistic that is very misleading based on how it is currently used: Runs Batted In (RBI).
I’ll have a series of posts on the subject, but I’m going to start with a case study in order to explain the theory. RBI are a bad statistic because they are a misleading measure of value. Most people consider RBI to be really important because “driving in runs” is critical to success, but RBI is very much dependent on the performance of the other players on your team. A very good hitter on a bad team will have fewer RBI than a good hitter on a good team because even if they perform in an identical manner, the first hitter will have fewer chances to drive in runners. Even if they have the same average, on base, and slugging percentages overall and with runners on and with runners in scoring position. The raw number RBI is a blunt tool to measure the ability to drive in runs.
Factors that determine how many RBI you have outside of your control are the number and position of runners on base for you, the number of outs when you come to the plate with men on base, and the quality of the baserunners. If you get a hit with runners in scoring position 40% of the time (a great number) but there are just 100 runners on base for you during a season, you will get no more than 40 RBI. If you get a hit 40% of the time and have 400 runners on base for you during a season, you could have 100 RBI. That’s a big difference even if you perform in the same way.
I’m not making the case here that RBI is completely meaningless and that hitting with runners on base is exactly the same as hitting with the bases empty, but simply that RBI as a counting stat is very misleading. Even if you think the best hitters are the guys who get timely hits and can turn it up in the clutch, you surely can appreciate that certain guys have different opportunities to drive in runs. RBI is very dependent on context and that means it’s not a very good way to measure individual players.
Allow me to demonstrate with a simple case study. Let’s start with comparing two seasons in which the following two players both played the same number of games.
As you can see, Player A leads in average, OBP, and wOBA (what’s wOBA?) and is just a but behind in slugging. In wRC+, Player A leads 177 to 166 over Player B. If we take a look at BB% and K%, Player A looks much better.

All in all, Player A is the better player. We’ve looked at all of their rate stats and we’ve looked at wRC+ which controls for league average and park effect. It’s hard to argue that Player B is better. I couldn’t make a case to that effect.
Here’s the big reveal which some of you have probably figured out. Player A is Miguel Cabrera in 2011, Player B is Miguel Cabrera in 2012. This is the same player during two different seasons. In 2011, when Cabrera was clearly the better player, he had 105 RBI. In 2012, when he was worse, he drove in 139. Everything tells us he was better in 2011 except RBI. That should make use skeptical. It’s even more of a problem when you consider his situational hitting.
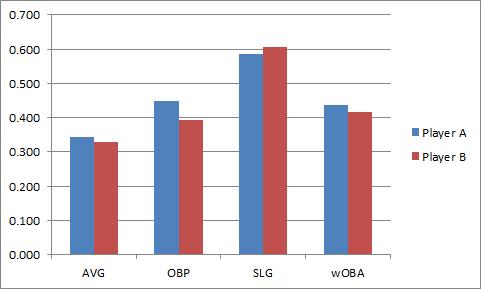
The graphs below are on identical scales:

Cabrera was better in 2011 in every situation and by each statistic except for his average (very close) and slugging percentage with no one on base. Which tells you nothing about how well he drives in runs. If you look at the HR distribution it tells you the same story.
| HRs | 2011 | 2012 |
| Bases Empty | 14 | 27 |
| Men on Base | 16 | 17 |
| Men in Scoring | 10 | 9 |
We can give him credit for those solo HR RBI from 2012, so let’s just lop 13 off the top. That still leaves 2012 Cabrera with 21 more RBI than 2011 Cabrera. Cabrera had a better season in 2011, but he had fewer RBI than in 2012. Most of this can simply be explained by the Tigers’ team OBP in the two seasons and where he hit in the lineup. If you subtract out Cabrera the Tigers got on base about 32% of the time in 2011 and 32.4% of the time in 2012 while Cabrera got to the plate a little less often because he hit 4th instead of 3rd. So there are more baserunners in general in 2012, but we can break this down even further.
In sum, Cabrera actually had more runners on base for him in 2011 than in 2012 but that doesn’t really tell the whole story. Let’s break it down by the number of baserunners on each base when he came to the plate:
| 2011 | 2012 | |
| Runner on 1B | 235 | 212 |
| Runner on 2B | 150 | 146 |
| Runner on 3B | 74 | 86 |
This should tell you the story even better. Cabrera had more baserunners in 2011, but the baserunners in 2012 were more heavily slanted toward scoring position. Cabrera had more runners closer to the plate so it’s easier to drive them in.
I intentionally chose Cabrera for this example because it strips away the idea that a given player just “has a knack” for driving in runs. Cabrera is an “RBI guy” if you subscribe to that idea. Miguel Cabrera had a better season in 2011 than 2012 when you break it down overall and in contextual situations. The only thing that helped 2012 Cabrera accumulate more RBI is that he had more runners on base closer to home when he got there. He played no role in getting those runners on base or closer to home, but he was able to more easily drive them and get credit in the RBI column. This is also isn’t as simple as converting RBI into a simple rate stat because where the baserunners are located and how many outs there are matter too, not just the number of situations.
This is the first step in a longer conversation but the takeaway point here is that RBI is stat that depends a lot on the team around you. Cabrera can’t control how many runners get on base and where they are on the bases when he comes to the plate. We shouldn’t judge a player for where he hits in the lineup and how the rest of the hitters on the team perform. It’s important to hit well with runners on base. I personally think we overvalue that skill over the ability to hit well in general, but I’ll leave that alone for now. Can we at least agree that a player who hits better with runners in scoring position and overall should be considered the better hitter? If that’s the case, then RBI is misleading you as an individual statistic. It’s that simple. I’m going to start laying out more evidence over the next couple weeks so stay tuned, but I’ll leave with this.
RBI is a descriptive statistic. It tells you who was at bat when a run scored and is critical to keeping track of a game in the box score. That’s why it was invented in the 1920s. You want to be able to scan a scorecard and recreate the game. RBI has a place in baseball, but only as a descriptive measure, not as a measure of value. Yet the RBI is still critical to MVP voting, arbitration salaries, and overall financial health of the players. They are judged by a statistic that doesn’t measure individual value and it is bad for their psyches. Players should focus on stats they can control and RBI isn’t one of those. It doesn’t measure individual value because as you can seen, in this very controlled example, RBI is misleading you.
Putting No Hitters Into The Shredder
A couple of weeks ago, Homer Bailey threw a no-hitter and almost everyone celebrated with the usual joy. I was among them. No hitters are fun and I love them for their drama and their rarity. One voice, however, stood out, not in opposition to Bailey, but it opposition to the attention given to no-hitters.
Brian Kenny made the case on Twitter and on MLB Now that no-hitters are not, by definition, the best set of starts even though that’s how most people treat them. Pitchers are trying to prevent runs and to prevent runs you want to limit baserunners. Baserunners reach via hits, walks, and HBPs and we shouldn’t place special focus on one type of way that hitters reach base. A one hit shutout is, according to Kenny (and basic logic) a much better performance than a 6 walk no-hitter.
Kenny is essentially making the other side of the batting average versus OBP argument. Getting on base is what matters for hitters, keeping guys off the bases is what matters for pitchers. He’s right. The quality of the start should be judged by baserunners rather than type of baserunner. I’m on board.
But no-hitters can still be celebrated for their rarity. Kenny makes the point that we shouldn’t celebrate no-hitters as much when the pitcher allows many baserunners because 6 walks is not better than 2 hits and 0 walks. I’m going to take a slightly different path. I’m going to argue we should celebrate no-hitters, but also the other great performances that aren’t no-hitters. We should recalibrate how we treat no-hitters, but that doesn’t mean they aren’t impressive. Five walks are bad, but it’s still really hard to not allow any hits.
Let’s go inside the numbers.
Most No-Hitters Are Great
Since 1916, there have been 204 no-hitters in MLB and all of our data will carry from 1916 through Saturday (7/13/2013) and will focus only on complete games. Let’s start with the number of baserunners allowed in each no hitter in MLB history:
| Baserunners | % of All No Hitters | Count |
| 0 | 10.3 | 21 |
| 1 | 20.6 | 42 |
| 2 | 17.6 | 36 |
| 3 | 14.7 | 30 |
| 4 | 14.2 | 29 |
| 5 | 7.8 | 16 |
| 6 | 5.4 | 11 |
| 7 | 3.9 | 8 |
| 8 | 3.4 | 7 |
| 9 | 0.5 | 1 |
| 10 | 1 | 2 |
| 11 | 0.5 | 1 |
What you can see here is that while some no-hitters aren’t great performances, most no hitters are excellent. 85% of all no-hitters contain 5 or fewer baserunners allowed with the average number of baserunners allowed coming in a 3.03 with a standard deviation of 2.31. What those numbers tell us is that most no-hitters are elite starts and only occasionally worthy of criticism.
But Many Equally Great Starts Aren’t No-Hitters
If you just looked at those numbers, you’d probably feel comfortable celebrating no-hitters because most no-hitters are, in fact, great starts. But there is another side that you don’t see with those numbers. What comes next is what percentage of complete games with a given number of baserunners are no hitters:
| Baserunners | NH/CG % |
| 0 | 100.000 |
| 1 | 30.435 |
| 2 | 7.725 |
| 3 | 2.591 |
| 4 | 1.234 |
| 5 | 0.399 |
| 6 | 0.181 |
| 7 | 0.103 |
| 8 | 0.077 |
| 9 | 0.010 |
| 10 | 0.022 |
| 11 | 0.013 |
This is a more troubling table. We can all agreed that perfect games are great, but aside from that these numbers tell us something else. What you see here is that, for example, 70% of all CG in which a starter allows 1 baserunner aren’t no-hitters. And it gets worse as we move down the list. 92% of all 2 baserunner starts don’t get recognized as no hitters. It’s 97% at 3 baserunners.
If we sit back and agree we should judge pitchers on baserunners allowed, no-hitters are quite deceptive. We’re leaving out a ton of great starts because a pitcher allowed a hit instead of a walk even though they allowed the same number of men to reach base. This is compelling evidence. If we’re looking at the game holistically, no-hitters are interesting because allowing no hits is very rare, but focusing on them is wrong because they make up such a small fraction of each set of complete games.
It’s really rare to see a no-hitter, and it’s rare to see no-hitters that aren’t excellent performances. But there are a ton of starts that are equally as valuable as no-hitters that get far less attention. Let’s put the numbers side by side.
| Baserunners | NH | Non NH CG |
| 0 | 21 | 0 |
| 1 | 42 | 96 |
| 2 | 36 | 430 |
| 3 | 30 | 1128 |
| 4 | 29 | 2321 |
| 5 | 16 | 3999 |
| 6 | 11 | 6079 |
| 7 | 8 | 7734 |
| 8 | 7 | 9121 |
| 9 | 1 | 9620 |
| 10 | 2 | 9070 |
| 11 | 1 | 7924 |
There are 96 1 hitters in MLB history with no other baserunners allowed. Those are better starts than the 29 no hitters with 4 baserunners allowed, but they don’t get the attention they deserve. 430 times a pitcher has allowed 2 baserunners in a start and not gotten credit for a no-hitter while 36 pitchers who had essentially the same outing are credited with no-hitters.
“So, Tell Me What To Think.”
I’m not anti-no-hitter. I love them and they are a lot of fun, but when you take a look at these numbers, you can easily see that we’re celebrating something because it’s rare, not necessarily because it’s the best. Plenty of starts that aren’t no hitters are better than starts that were no hitters, even before we look at strikeouts and great defensive plays.
Kenny is making a very good point when he tells you not to be bound by the statistics of the 1880s. Walks aren’t outs in disguise. They are valuable offensive tools and shouldn’t be brushed aside as meaningless for pitchers. No-hitters are a rare subset of starts, but they are not by definition, the best starts. Plenty of pitchers have thrown 2 hit shutouts who never got to celebrate like Tim Lincecum did when he allowed 5 baserunners. All I’m asking is that you give those guys some credit too.
You don’t have to stop enjoying no-hitters. In fact, you should enjoy them just the same. Baseball is fun and is meant to captivate you. I love no-hitters because they can vanish on every pitch. You can see walks coming when the pitcher allows the 3 ball. They’re super important, but are much less dramatic.
All told, the evidence tells us that no-hitters shouldn’t be revered as great starts, but rather as particularly interesting ones. We should also give more credit to great starts in which pitchers allow hits because those guys are getting short changed. A one hit shutout with 10 strikeouts is an amazing start. A 4 walk no hitters with 4 strikeouts is just very good.
Consider each start in isolation. Allowing no hits is difficult, but if you walk a bunch of batters, you’re not doing your job. What Kenny is really asking you to do is to think for yourself and to analyze the world around you. No-hitters are fun and usually great. But not always. And non no-hitters are sometimes better. You can judge for yourself. The following lines are from Saturday. I know which I’d take if you asked which was better.
Greinke: 9 IP, 2 H, 0 R, 1 BB, 9 K (110 pitches) vs Colorado
Lincecum: 9 IP, 0 H, 0 R, 4 BB, 1 HBP, 13 K (148 pitches) vs SD
SOEFA Sunday: Reliever Rankings Update (July 14, 2013)
You’ll recall earlier this year we introduced our very own reliever rankings called SOEFA, which you can read about in detail here. For a brief refresher, it combines strand rate, expected OBP against, ERA-, and FIP- into a deviation from league average. Zero is average, and will generally range between -2.5 to 2.5. This includes all pitchers who have thrown at least 20 IP in relief. Should you wish to know the SOEFA for any other reliever, or on a day that isn’t Sunday, hit us on Twitter or in the comments section.
| Rank | Player | Team | SOEFA |
| 1 | Alex Torres | Rays | 1.05 |
| 2 | Joaquin Benoit | Tigers | 0.99 |
| 3 | Neal Cotts | Rangers | 0.97 |
| 4 | Drew Smyly | Tigers | 0.94 |
| 5 | Mark Melancon | Pirates | 0.88 |
| 6 | Greg Holland | Royals | 0.87 |
| 7 | Sergio Romo | Giants | 0.87 |
| 8 | Will Harris | Diamondbacks | 0.84 |
| 9 | Jason Grilli | Pirates | 0.81 |
| 10 | Jordan Walden | Braves | 0.79 |
| 11 | Oliver Perez | Mariners | 0.78 |
| 12 | Javier Lopez | Giants | 0.78 |
| 13 | Jesse Crain | White Sox | 0.77 |
| 14 | Sam LeCure | Reds | 0.76 |
| 15 | Glen Perkins | Twins | 0.75 |
| 16 | Kenley Jansen | Dodgers | 0.74 |
| 17 | Trevor Rosenthal | Cardinals | 0.74 |
| 18 | Edward Mujica | Cardinals | 0.71 |
| 19 | Casey Fien | Twins | 0.71 |
| 20 | Shawn Kelley | Yankees | 0.69 |
| 21 | Joe Thatcher | Padres | 0.69 |
| 22 | Craig Kimbrel | Braves | 0.65 |
| 23 | Koji Uehara | Red Sox | 0.64 |
| 24 | Brett Cecil | Blue Jays | 0.63 |
| 25 | Preston Claiborne | Yankees | 0.62 |
| 26 | Casey Janssen | Blue Jays | 0.62 |
| 27 | Kevin Gregg | Cubs | 0.61 |
| 28 | David Robertson | Yankees | 0.59 |
| 29 | Sean Doolittle | Athletics | 0.57 |
| 30 | Tommy Hunter | Orioles | 0.57 |
| 31 | Junichi Tazawa | Red Sox | 0.56 |
| 32 | Boone Logan | Yankees | 0.55 |
| 33 | Dale Thayer | Padres | 0.53 |
| 34 | Andrew Bailey | Red Sox | 0.52 |
| 35 | Francisco Rodriguez | Brewers | 0.52 |
| 36 | Edgmer Escalona | Rockies | 0.5 |
| 37 | Joel Peralta | Rays | 0.49 |
| 38 | Brian Matusz | Orioles | 0.49 |
| 39 | Manny Parra | Reds | 0.48 |
| 40 | Robbie Ross | Rangers | 0.48 |
| 41 | Sandy Rosario | Giants | 0.48 |
| 42 | Andrew Miller | Red Sox | 0.47 |
| 43 | Seth Maness | Cardinals | 0.47 |
| 44 | Ernesto Frieri | Angels | 0.47 |
| 45 | Paco Rodriguez | Dodgers | 0.46 |
| 46 | Bobby Parnell | Mets | 0.46 |
| 47 | Brandon Kintzler | Brewers | 0.45 |
| 48 | Matt Belisle | Rockies | 0.44 |
| 49 | Josh Collmenter | Diamondbacks | 0.44 |
| 50 | David Carpenter | Braves | 0.43 |
| 51 | Jason Frasor | Rangers | 0.43 |
| 52 | Aroldis Chapman | Reds | 0.42 |
| 53 | Matt Reynolds | Diamondbacks | 0.42 |
| 54 | Luis Avilan | Braves | 0.42 |
| 55 | Chad Gaudin | Giants | 0.41 |
| 56 | Steve Cishek | Marlins | 0.41 |
| 57 | Vin Mazzaro | Pirates | 0.41 |
| 58 | Grant Balfour | Athletics | 0.4 |
| 59 | Jonathan Papelbon | Phillies | 0.4 |
| 60 | Luke Hochevar | Royals | 0.4 |
| 61 | Scott Downs | Angels | 0.4 |
| 62 | Darren O’Day | Orioles | 0.39 |
| 63 | J.P. Howell | Dodgers | 0.38 |
| 64 | Chad Qualls | Marlins | 0.37 |
| 65 | Steve Delabar | Blue Jays | 0.37 |
| 66 | Luke Gregerson | Padres | 0.37 |
| 67 | Randy Choate | Cardinals | 0.36 |
| 68 | Ryan Cook | Athletics | 0.36 |
| 69 | Tanner Scheppers | Rangers | 0.35 |
| 70 | Tom Gorzelanny | Brewers | 0.35 |
| 71 | Rafael Soriano | Nationals | 0.34 |
| 72 | Brad Ziegler | Diamondbacks | 0.34 |
| 73 | Justin Wilson | Pirates | 0.34 |
| 74 | James Russell | Cubs | 0.33 |
| 75 | Addison Reed | White Sox | 0.32 |
| 76 | Antonio Bastardo | Phillies | 0.32 |
| 77 | Cody Allen | Indians | 0.31 |
| 78 | Alfredo Simon | Reds | 0.31 |
| 79 | Jim Henderson | Brewers | 0.29 |
| 80 | Tyler Clippard | Nationals | 0.28 |
| 81 | Tony Watson | Pirates | 0.26 |
| 82 | Craig Breslow | Red Sox | 0.26 |
| 83 | Jerome Williams | Angels | 0.26 |
| 84 | Fernando Rodney | Rays | 0.25 |
| 85 | Jean Machi | Giants | 0.25 |
| 86 | Rafael Betancourt | Rockies | 0.25 |
| 87 | Rex Brothers | Rockies | 0.24 |
| 88 | Caleb Thielbar | Twins | 0.23 |
| 89 | Jamey Wright | Rays | 0.22 |
| 90 | Michael Kohn | Angels | 0.22 |
| 91 | Anthony Varvaro | Braves | 0.21 |
| 92 | Jose Mijares | Giants | 0.2 |
| 93 | Josh Outman | Rockies | 0.2 |
| 94 | Yoervis Medina | Mariners | 0.2 |
| 95 | Pat Neshek | Athletics | 0.19 |
| 96 | Jose Veras | Astros | 0.19 |
| 97 | Jesse Chavez | Athletics | 0.17 |
| 98 | Nate Jones | White Sox | 0.17 |
| 99 | Greg Burke | Mets | 0.15 |
| 100 | Charlie Furbush | Mariners | 0.15 |
| 101 | Joe Nathan | Rangers | 0.15 |
| 102 | Matt Lindstrom | White Sox | 0.13 |
| 103 | Alfredo Figaro | Brewers | 0.13 |
| 104 | Aaron Loup | Blue Jays | 0.13 |
| 105 | Tim Collins | Royals | 0.12 |
| 106 | Jim Johnson | Orioles | 0.12 |
| 107 | Dane de la Rosa | Angels | 0.11 |
| 108 | Anthony Swarzak | Twins | 0.11 |
| 109 | Bryan Morris | Pirates | 0.11 |
| 110 | Matt Thornton | White Sox | 0.09 |
| 111 | Mariano Rivera | Yankees | 0.09 |
| 112 | Joe Ortiz | Rangers | 0.08 |
| 113 | Joe Smith | Indians | 0.07 |
| 114 | Tyson Ross | Padres | 0.07 |
| 115 | Ross Wolf | Rangers | 0.06 |
| 116 | Cesar Ramos | Rays | 0.06 |
| 117 | Darren Oliver | Blue Jays | 0.06 |
| 118 | Joe Kelly | Cardinals | 0.06 |
| 119 | Adam Ottavino | Rockies | 0.05 |
| 120 | John Axford | Brewers | 0.04 |
| 121 | LaTroy Hawkins | Mets | 0.04 |
| 122 | Aaron Crow | Royals | 0.03 |
| 123 | Carter Capps | Mariners | 0.02 |
| 124 | Josh Edgin | Mets | 0.02 |
| 125 | Kevin Jepsen | Angels | 0.02 |
| 126 | Jared Burton | Twins | 0 |
| 127 | Ryan Pressly | Twins | 0 |
| 128 | Danny Farquhar | Mariners | -0.01 |
| 129 | Tony Sipp | Diamondbacks | -0.01 |
| 130 | J.J. Hoover | Reds | -0.01 |
| 131 | Troy Patton | Orioles | -0.02 |
| 132 | A.J. Ramos | Marlins | -0.03 |
| 133 | Drew Storen | Nationals | -0.03 |
| 134 | Jake McGee | Rays | -0.03 |
| 135 | Tom Wilhelmsen | Mariners | -0.03 |
| 136 | Wilton Lopez | Rockies | -0.04 |
| 137 | Bryan Shaw | Indians | -0.04 |
| 138 | Luke Putkonen | Tigers | -0.04 |
| 139 | Burke Badenhop | Brewers | -0.05 |
| 140 | Mike Dunn | Marlins | -0.05 |
| 141 | Brad Brach | Padres | -0.07 |
| 142 | Ryan Webb | Marlins | -0.1 |
| 143 | Matt Guerrier | – – – | -0.1 |
| 144 | Heath Bell | Diamondbacks | -0.1 |
| 145 | Darin Downs | Tigers | -0.1 |
| 146 | David Hernandez | Diamondbacks | -0.1 |
| 147 | Logan Ondrusek | Reds | -0.12 |
| 148 | Chris Perez | Indians | -0.13 |
| 149 | Jose Cisnero | Astros | -0.13 |
| 150 | Craig Stammen | Nationals | -0.14 |
| 151 | Paul Clemens | Astros | -0.14 |
| 152 | Brad Lincoln | Blue Jays | -0.15 |
| 153 | Tim Stauffer | Padres | -0.15 |
| 154 | Joba Chamberlain | Yankees | -0.17 |
| 155 | Jerry Blevins | Athletics | -0.17 |
| 156 | Brian Duensing | Twins | -0.18 |
| 157 | Cory Gearrin | Braves | -0.19 |
| 158 | Michael Gonzalez | Brewers | -0.19 |
| 159 | Nick Hagadone | Indians | -0.2 |
| 160 | George Kontos | Giants | -0.2 |
| 161 | Scott Rice | Mets | -0.2 |
| 162 | Blake Beavan | Mariners | -0.21 |
| 163 | Wesley Wright | Astros | -0.23 |
| 164 | Rich Hill | Indians | -0.23 |
| 165 | Jonathan Broxton | Reds | -0.26 |
| 166 | Kyle Farnsworth | Rays | -0.27 |
| 167 | Garrett Richards | Angels | -0.27 |
| 168 | Vinnie Pestano | Indians | -0.3 |
| 169 | Josh Roenicke | Twins | -0.31 |
| 170 | Phil Coke | Tigers | -0.31 |
| 171 | Ronald Belisario | Dodgers | -0.31 |
| 172 | Travis Blackley | Astros | -0.32 |
| 173 | T.J. McFarland | Orioles | -0.36 |
| 174 | Hector Ambriz | Astros | -0.36 |
| 175 | Clayton Mortensen | Red Sox | -0.4 |
| 176 | Mike Adams | Phillies | -0.4 |
| 177 | Alex Wilson | Red Sox | -0.43 |
| 178 | Matt Albers | Indians | -0.45 |
| 179 | Brandon Lyon | Mets | -0.49 |
| 180 | Esmil Rogers | Blue Jays | -0.49 |
| 181 | Huston Street | Padres | -0.5 |
| 182 | Bruce Chen | Royals | -0.53 |
| 183 | Adam Warren | Yankees | -0.56 |
| 184 | Al Alburquerque | Tigers | -0.57 |
| 185 | Jeremy Horst | Phillies | -0.59 |
| 186 | Pedro Strop | – – – | -0.61 |
| 187 | Kelvin Herrera | Royals | -0.67 |
| 188 | Henry Rodriguez | – – – | -0.7 |
| 189 | Michael Kirkman | Rangers | -0.71 |
| 190 | Carlos Marmol | Cubs | -0.72 |
| 191 | Jeremy Affeldt | Giants | -0.79 |
| 192 | Anthony Bass | Padres | -0.88 |
| 193 | Shawn Camp | Cubs | -1.02 |
| 194 | Hector Rondon | Cubs | -1.05 |
| 195 | Brandon League | Dodgers | -1.65 |
Why You Should Give Sabermetrics A Try
A lot of ink has been spilled over the old-school versus new school debate in baseball analysis and while I’m decidedly on the new school side of things, I firmly believe that the reasons we have a difficult time winning converts is because we’re often too quick to act like our views are obviously the right ones. This isn’t a matter of sabermetricians getting the wrong answers, but we don’t often do enough to make our findings clear to the public. Sometimes we get caught up talking to each other and not talking to everyone.
Don’t get me wrong, I love Fangraphs and other sabermetric heavy sites, but we don’t always do the best job of making the basic principles clear. When someone writes a great post at Fangraphs, they don’t explain why they use wOBA instead of OPS or batting average, they take it as a given and expect the reader to know why or to look it up. Which makes less informed baseball fans weary. It’s not that they’re stupid, I don’t think that at all, it’s that they haven’t been given a proper explanation for why we think what we think on this side of the debate.
The sabermetric community offers a lot of resources that explain statistics, but we leave the curious fan with little guidance. It’s not hard to tell why some people here us talking about Wins Above Replacement and start thinking we’re nuts. It’s out job to explain what we’re doing and it’s our job to sell the message correctly. We’ve done so much groundwork in baseball research that we often forget that a new person is learning about the value of walks everyday, and that’s something we just take as a given.
Which is why it’s important for baseball analytics to have a public relations aspect of it too. Brian Kenny from MLB Network and NBC Sports Radio is a great voice for that part of the task. He’s done excellent work bringing sabermetrics into the mainstream of sports coverage. Plenty of others do excellent work on the matter, but he’s made it a mission.
At New English D, we’d like to be a part of that, and often publish basic explanations of sabermetric stats and principles while also pointing out some flaws in the basic stats. Today, I’d like to do something different. Today, I’d like to explain why you should give sabermetrics a try, period. I don’t care how skeptical you are, give me the next 5 minutes.
Here are 5 reasons:
1) The basic statistics were crafted during another era.
Batting average, runs, RBI, SB, wins, ERA, and the other statistics you’re familiar with quite readily were invented in the 1920s to keep track of what happened on the field. They are scoring statistics to record exactly how the game progressed. They’re descriptive and that is great. You can look at a box score and see exactly who was on base and who was at the plate when each run scored, but you can’t always tell which players were most responsible for the win or loss. These stats don’t tell you that much about value. It’s not because these stats are stupid, it’s because they didn’t have calculators and computers to do calculations when these numbers were invented. When you’re using a slide rule or pen and paper to track stats, things have to be simple. They don’t have to be simple anymore because we have the power to compute more information. It doesn’t mean getting a hit with a runner on second isn’t important, it means RBI is a crude way to measure that skill.
2) Progress is good.
Sabermetricians have introduced many new statistics into the world in the last couple decades, and while that might seem unseemly and cluttered, it’s actually no different than anything else. We didn’t use to fly on airplanes or drive cars, we didn’t used to be able to watch any baseball game on the internet. Heck, we didn’t even have the internet until the 1990s. No one is running around telling everyone to write more letters and put them in mailboxes, we have all pretty much embraced e-mail, texting, and instant messaging. Communication got better and more efficient. We’re better off. Baseball analysis is the same way. These new stats tell us more about baseball than we used to know. Players who walk a lot used to be really undervalued until someone with a computer looked at a lot of baseball games and realized that getting on base is really good, whether you get on via a hit or a walk. Things get better when we develop new technologies. You wouldn’t disable your internet connection, don’t immediately shut out new stats.
3) We’re asking the same questions.
Sabermetricians and traditional analysts both care about what leads to wins. Traditional analysts tend to just focus on who wins and loses and reverse engineer the explanations, but sabermetrics is just breaking it down a different way. Let’s go through a little thought experiment:
- How do you win? You score more runs than the other team.
- How do you score more runs than the other team? You score runs and you prevent runs.
- How do you score runs? You get on base.
- How do you get on base? You get a hit or you walk.
- How do you prevent runs? You don’t let the other team get on base.
- How do you keep them off the bases? You don’t allow hits or walks.
- How do you prevent hits? Don’t let them put the ball in play or hit homeruns, so strikeouts are good. You can also induce groundballs and use your defense if they are good.
When you think about the question like that, you realize we’re all asking the same thing. Sabermetricians break it down into how you score and prevent runs and they look for what leads to both of those outcomes. It’s nothing devious or nerdy. It’s 100% about scoring runs and preventing them. We’ve just looked at enough data to know which actions lead to both and which actions don’t. Sometimes there is luck involved and you can’t predict luck. We’re all about playing the odds. That’s no different from anything else, it just looks different because we’re using numbers instead of intuition.
4) More information is good.
Even if you like the old statistics, that doesn’t mean the new ones are wrong. If a player has a high batting average, that tells you something about their performance. But so does their on base percentage. So does their slugging percentage. So does Weighted On Base Average (wOBA). So does Wins Above Replacement (WAR). It’s all information about the players and teams. Sabermetricians like these new stats for a reason. The reason is that they tell us something the other statistics do not. Batting average is fine, but it doesn’t tell you if the player is getting on base via a walk. You might not think walks are as good as hits (we don’t either!), but walks are WAY BETTER than outs. Batting average pretends walks don’t exist and we think that’s silly. RBI tells you how many runs a batter has driven in, but it doesn’t tell you how many opportunities that batter has to drive someone in. It’s not fair to Joey Votto that he hits behind Zack Cozart and Prince Fielder gets to hit behind Miguel Cabrera. Those two players are in different contexts. Sabermetrics likes to provide context neutral information. Players can only control certain aspects of the game and we don’t think it’s right to judge a player on things outside of his control. This is especially true for pitchers, who can’t control how much run support they get, how well their defense plays, or which pitcher is on the mound for the other team. Sabermetrics looks at that and says, wins aren’t a great way to measure a pitcher’s performance because most of what leads to a win is out of their control. Let’s look at what is in their control and see how well they do at that.
5) The logic is exactly the same.
When you look at RBI or Wins or Batting Average to judge a player, you’re using statistical information to make an inference about how good that guy is. You’re taking information recorded in the past to make a claim about the present and future. It doesn’t matter if you’re using your eyes during an at bat or a spreadsheet in January, the logic is the same. Past behavior informs predictions about the future. For sabermetricians, we’re just using a lot more information because we have found that using more information and certain kinds of information tends to help make better inferences. For example, this is where the tired phrase “small sample size” comes into play. We’ve looked at a ton of data and see that a really good batting average over a ten day stretch doesn’t predict what the player will do on day 11 very well. For statistics to reflect true talent, you needs bigger samples. It’s simple logic and you use it every day. If you think a player is about average and then they have two great days, how much do you change your mind? Not much. If you think a player is average and they have six great months, how much? Probably a lot more. Sabermetrics isn’t any different than that, it’s merely crunching the numbers to give us a better estimate about when information starts to become meaningful.
—
If you think about it like that, sabermetrics aren’t that foreign or nerdy. You might need to be a nerd to program a computer to spit out an answer to a question, but you don’t have to be anything but curious to understand what the answer is telling you. It’s isn’t that the old stats are terrible, it’s that they were developed when they had limited power to make sense of a complex game. You wouldn’t want a surgeon trained in the 1920s to operate on you, why let a statistic from 100 years ago inform you. Progress is good. Progress leads to more information and better understanding. You can absolutely disagree with a new stat, but you absolutely cannot disagree with a stat because it’s new. We’re asking the same questions and using the same logic, it’s just about being willing to expand the data you’re willing to use to evaluate those questions. You judge players by batting average, why wouldn’t you look at on base percentage too?
Ultimately, sabermetrics are a way to learn more about baseball and I can’t imagine not wanting to do that. I challenge you to learn more or to help others do the same. We have lots of information on this site under out “Stat of the Week” section and other sites offer much of the same. I’ll even make you a guarantee because I love baseball and learning that much. I will answer any question you have about baseball stats. Hit me on Twitter, in the comments, or on e-mail (See “About” above) and I will explain why I like one stat over another or what the best way is to measure something. Anything. That’s my offer. There’s no excuse not to give it a try, I’m pretty sure you’ll like it.
SOEFA Sunday: Reliever Rankings Update (July 7, 2013)
You’ll recall last week we introduced are very own reliever rankings called SOEFA, which you can read about in detail here. For a brief refresher, it combines strand rate, expected OBP against, ERA-, and FIP- into a deviation from league average. Zero is average, and will generally range between -2.5 to 2.5. This includes all pitchers who have thrown at least 20 IP in relief. Should you wish to know the SOEFA for any other reliever, or on a day that isn’t Sunday, hit us on Twitter or in the comments section.
| Rank | Player | Team | SOEFA |
| 1 | Alex Torres | Rays | 1.33 |
| 2 | Sergio Romo | Giants | 1.03 |
| 3 | Joaquin Benoit | Tigers | 0.96 |
| 4 | Neal Cotts | Rangers | 0.9 |
| 5 | Drew Smyly | Tigers | 0.89 |
| 6 | Mark Melancon | Pirates | 0.88 |
| 7 | Jordan Walden | Braves | 0.84 |
| 8 | Jason Grilli | Pirates | 0.83 |
| 9 | Javier Lopez | Giants | 0.83 |
| 10 | Greg Holland | Royals | 0.83 |
| 11 | Kevin Gregg | Cubs | 0.79 |
| 12 | Jesse Crain | White Sox | 0.78 |
| 13 | Oliver Perez | Mariners | 0.77 |
| 14 | Sam LeCure | Reds | 0.75 |
| 15 | Glen Perkins | Twins | 0.75 |
| 16 | Brett Cecil | Blue Jays | 0.73 |
| 17 | Trevor Rosenthal | Cardinals | 0.72 |
| 18 | Kenley Jansen | Dodgers | 0.71 |
| 19 | Joe Thatcher | Padres | 0.68 |
| 20 | Edward Mujica | Cardinals | 0.67 |
| 21 | Preston Claiborne | Yankees | 0.66 |
| 22 | Junichi Tazawa | Red Sox | 0.66 |
| 23 | Shawn Kelley | Yankees | 0.63 |
| 24 | Sean Doolittle | Athletics | 0.63 |
| 25 | Casey Fien | Twins | 0.59 |
| 26 | Tommy Hunter | Orioles | 0.58 |
| 27 | Koji Uehara | Red Sox | 0.58 |
| 28 | Edgmer Escalona | Rockies | 0.58 |
| 29 | Josh Collmenter | Diamondbacks | 0.55 |
| 30 | Francisco Rodriguez | Brewers | 0.54 |
| 31 | Craig Kimbrel | Braves | 0.53 |
| 32 | Scott Downs | Angels | 0.52 |
| 33 | David Robertson | Yankees | 0.49 |
| 34 | Ryan Cook | Athletics | 0.49 |
| 35 | Andrew Miller | Red Sox | 0.48 |
| 36 | Robbie Ross | Rangers | 0.47 |
| 37 | Brian Matusz | Orioles | 0.47 |
| 38 | Jim Henderson | Brewers | 0.45 |
| 39 | Casey Janssen | Blue Jays | 0.44 |
| 40 | Luis Avilan | Braves | 0.44 |
| 41 | Aroldis Chapman | Reds | 0.44 |
| 42 | Matt Reynolds | Diamondbacks | 0.44 |
| 43 | Boone Logan | Yankees | 0.44 |
| 44 | Jonathan Papelbon | Phillies | 0.43 |
| 45 | Chad Gaudin | Giants | 0.43 |
| 46 | Anthony Varvaro | Braves | 0.43 |
| 47 | Dale Thayer | Padres | 0.43 |
| 48 | Bobby Parnell | Mets | 0.42 |
| 49 | Ernesto Frieri | Angels | 0.42 |
| 50 | Seth Maness | Cardinals | 0.41 |
| 51 | Rafael Soriano | Nationals | 0.4 |
| 52 | Josh Outman | Rockies | 0.4 |
| 53 | Matt Belisle | Rockies | 0.39 |
| 54 | Paco Rodriguez | Dodgers | 0.39 |
| 55 | Manny Parra | Reds | 0.39 |
| 56 | Luke Gregerson | Padres | 0.38 |
| 57 | Joel Peralta | Rays | 0.38 |
| 58 | Brandon Kintzler | Brewers | 0.36 |
| 59 | Addison Reed | White Sox | 0.35 |
| 60 | Grant Balfour | Athletics | 0.34 |
| 61 | Tom Gorzelanny | Brewers | 0.34 |
| 62 | Tanner Scheppers | Rangers | 0.34 |
| 63 | Jason Frasor | Rangers | 0.34 |
| 64 | Darren O’Day | Orioles | 0.34 |
| 65 | Brad Ziegler | Diamondbacks | 0.33 |
| 66 | Alfredo Simon | Reds | 0.33 |
| 67 | Luke Hochevar | Royals | 0.33 |
| 68 | John Axford | Brewers | 0.32 |
| 69 | J.P. Howell | Dodgers | 0.32 |
| 70 | Vin Mazzaro | Pirates | 0.32 |
| 71 | Joe Smith | Indians | 0.31 |
| 72 | David Carpenter | Braves | 0.3 |
| 73 | Steve Cishek | Marlins | 0.3 |
| 74 | James Russell | Cubs | 0.28 |
| 75 | Michael Kohn | Angels | 0.28 |
| 76 | Tony Watson | Pirates | 0.26 |
| 77 | Rafael Betancourt | Rockies | 0.25 |
| 78 | Jerome Williams | Angels | 0.25 |
| 79 | Antonio Bastardo | Phillies | 0.25 |
| 80 | Steve Delabar | Blue Jays | 0.25 |
| 81 | Nate Jones | White Sox | 0.24 |
| 82 | Chad Qualls | Marlins | 0.24 |
| 83 | Justin Wilson | Pirates | 0.23 |
| 84 | Jamey Wright | Rays | 0.23 |
| 85 | Tyler Clippard | Nationals | 0.23 |
| 86 | Troy Patton | Orioles | 0.23 |
| 87 | Pat Neshek | Athletics | 0.21 |
| 88 | Matt Thornton | White Sox | 0.21 |
| 89 | Jean Machi | Giants | 0.2 |
| 90 | Mariano Rivera | Yankees | 0.2 |
| 91 | Rex Brothers | Rockies | 0.19 |
| 92 | Craig Breslow | Red Sox | 0.19 |
| 93 | Cody Allen | Indians | 0.17 |
| 94 | Aaron Loup | Blue Jays | 0.17 |
| 95 | Greg Burke | Mets | 0.17 |
| 96 | Charlie Furbush | Mariners | 0.15 |
| 97 | Jose Veras | Astros | 0.15 |
| 98 | Tim Collins | Royals | 0.13 |
| 99 | Alfredo Figaro | Brewers | 0.13 |
| 100 | Jesse Chavez | Athletics | 0.12 |
| 101 | Bryan Morris | Pirates | 0.12 |
| 102 | Tyson Ross | Padres | 0.11 |
| 103 | Joe Nathan | Rangers | 0.11 |
| 104 | Dane de la Rosa | Angels | 0.11 |
| 105 | Al Alburquerque | Tigers | 0.1 |
| 106 | Jose Mijares | Giants | 0.1 |
| 107 | Darren Oliver | Blue Jays | 0.09 |
| 108 | LaTroy Hawkins | Mets | 0.08 |
| 109 | Joe Kelly | Cardinals | 0.08 |
| 110 | Anthony Swarzak | Twins | 0.07 |
| 111 | Fernando Rodney | Rays | 0.07 |
| 112 | Carter Capps | Mariners | 0.07 |
| 113 | Yoervis Medina | Mariners | 0.06 |
| 114 | Aaron Crow | Royals | 0.06 |
| 115 | Cesar Ramos | Rays | 0.03 |
| 116 | Adam Ottavino | Rockies | 0.03 |
| 117 | Andrew Bailey | Red Sox | 0.02 |
| 118 | Jim Johnson | Orioles | 0 |
| 119 | Matt Lindstrom | White Sox | 0 |
| 120 | Ryan Pressly | Twins | -0.02 |
| 121 | Ryan Webb | Marlins | -0.03 |
| 122 | Jared Burton | Twins | -0.03 |
| 123 | J.J. Hoover | Reds | -0.03 |
| 124 | Drew Storen | Nationals | -0.03 |
| 125 | Jerry Blevins | Athletics | -0.04 |
| 126 | Tom Wilhelmsen | Mariners | -0.05 |
| 127 | Kevin Jepsen | Angels | -0.05 |
| 128 | Craig Stammen | Nationals | -0.06 |
| 129 | Burke Badenhop | Brewers | -0.07 |
| 130 | Brian Duensing | Twins | -0.07 |
| 131 | Joe Ortiz | Rangers | -0.08 |
| 132 | Wilton Lopez | Rockies | -0.08 |
| 133 | Ross Wolf | Rangers | -0.08 |
| 134 | A.J. Ramos | Marlins | -0.09 |
| 135 | Danny Farquhar | Mariners | -0.09 |
| 136 | David Hernandez | Diamondbacks | -0.1 |
| 137 | Darin Downs | Tigers | -0.11 |
| 138 | Jose Cisnero | Astros | -0.12 |
| 139 | Bryan Shaw | Indians | -0.12 |
| 140 | Tony Sipp | Diamondbacks | -0.14 |
| 141 | Tim Stauffer | Padres | -0.15 |
| 142 | Brad Lincoln | Blue Jays | -0.16 |
| 143 | Wesley Wright | Astros | -0.16 |
| 144 | Cory Gearrin | Braves | -0.16 |
| 145 | Paul Clemens | Astros | -0.18 |
| 146 | Nick Hagadone | Indians | -0.19 |
| 147 | Vinnie Pestano | Indians | -0.19 |
| 148 | Jake McGee | Rays | -0.2 |
| 149 | Mike Dunn | Marlins | -0.2 |
| 150 | Michael Gonzalez | Brewers | -0.2 |
| 151 | Blake Beavan | Mariners | -0.21 |
| 152 | Phil Coke | Tigers | -0.21 |
| 153 | Joba Chamberlain | Yankees | -0.22 |
| 154 | Matt Guerrier | – – – | -0.22 |
| 155 | Heath Bell | Diamondbacks | -0.23 |
| 156 | Jonathan Broxton | Reds | -0.24 |
| 157 | Matt Albers | Indians | -0.24 |
| 158 | Garrett Richards | Angels | -0.24 |
| 159 | Alex Wilson | Red Sox | -0.26 |
| 160 | Rich Hill | Indians | -0.28 |
| 161 | George Kontos | Giants | -0.29 |
| 162 | Scott Rice | Mets | -0.29 |
| 163 | Josh Roenicke | Twins | -0.29 |
| 164 | Chris Perez | Indians | -0.29 |
| 165 | Logan Ondrusek | Reds | -0.3 |
| 166 | Travis Blackley | Astros | -0.35 |
| 167 | Kyle Farnsworth | Rays | -0.36 |
| 168 | Hector Ambriz | Astros | -0.37 |
| 169 | Mike Adams | Phillies | -0.39 |
| 170 | Clayton Mortensen | Red Sox | -0.4 |
| 171 | T.J. McFarland | Orioles | -0.4 |
| 172 | Ronald Belisario | Dodgers | -0.44 |
| 173 | Henry Rodriguez | – – – | -0.45 |
| 174 | Brandon Lyon | Mets | -0.46 |
| 175 | Esmil Rogers | Blue Jays | -0.51 |
| 176 | Bruce Chen | Royals | -0.53 |
| 177 | Adam Warren | Yankees | -0.57 |
| 178 | Jeremy Horst | Phillies | -0.58 |
| 179 | Jeremy Affeldt | Giants | -0.59 |
| 180 | Kelvin Herrera | Royals | -0.68 |
| 181 | Huston Street | Padres | -0.71 |
| 182 | Michael Kirkman | Rangers | -0.71 |
| 183 | Carlos Marmol | Cubs | -0.71 |
| 184 | Anthony Bass | Padres | -0.94 |
| 185 | Pedro Strop | – – – | -0.98 |
| 186 | Shawn Camp | Cubs | -1.01 |
| 187 | Hector Rondon | Cubs | -1.05 |
| 188 | Brandon League | Dodgers | -1.62 |
