The Morning Edition (July 1, 2013)

From Last Night:
- Cuddyer extends the streak to 27 in a loss to the Giants
- Martin walks off in the 14th to beat the Crew
- Jeff Mathis walk off grand slam
- Puig’s big day lifts the Dodgers
- Darvish beats Latos
- The Royals take a wild one from the Twins 9-8
- Masterson shuts out the White Sox, Sale takes ANOTHER 8+IP, 10 K loss
- Wheeler gets shelled, loses to Gio and the Nats
- Sox walk off on the Jays
What I’m Watching Today:
- Zimmermann tries to quiet the Brewers (7p Eastern)
- Jose Fernandez versus the Padres (7p Eastern)
- Matt Moore faces Houston, strikeout watch in effect (8p Eastern)
The Big Question:
- What’s a realistic season for Puig?
The legend of Puig grows by the day as he had a 4 hit day on Sunday to lift the Dodgers. He’s currently 43rd among position players in WAR, which doesn’t sound impressive until you realize that he has just 107 PA and most of the people around him have 300+. Puig gets some flack for his plate discipline (3.8 BB%) but he did walk more in the minor leagues and you can’t really fault a guy for hacking when he seemingly can’t miss. In 107 PA he’s hitting .436/.467/.713 with 234 wRC+ and 2.1 WAR. That’s ridiculous. He’ll come back to Earth, but he’s on pace for something like a 12.6 WAR season extrapolated out to a full season. One shouldn’t project out like that, but just for reference, that would be the 5th best season in baseball history behind four of Babe Ruth’s best seasons. That’s pretty cool. I have no idea where he’ll settle in, but the skills are there for him to sustain himself as an impact player.
SOEFA Sunday: Reliever Rankings Update (June 30, 2013)
You’ll recall earlier this week we introduced are very own reliever rankings called SOEFA, which you can read about in detail here. For a brief refresher, it combines strand rate, expected OBP against, ERA-, and FIP- into a deviation from league average. Zero is average. This includes all pitchers who have thrown at least 20 IP in relief. Should you wish to know the SOEFA for any other reliever, or on a day that isn’t Sunday, hit us on Twitter or in the comments section.
| Rank | Player | Team | SOEFA |
| 1 | Alex Torres | Rays | 1.39 |
| 2 | Neal Cotts | Rangers | 1.26 |
| 3 | Sergio Romo | Giants | 0.99 |
| 4 | Jason Grilli | Pirates | 0.94 |
| 5 | Joaquin Benoit | Tigers | 0.92 |
| 6 | Mark Melancon | Pirates | 0.88 |
| 7 | Drew Smyly | Tigers | 0.86 |
| 8 | Jordan Walden | Braves | 0.83 |
| 9 | Koji Uehara | Red Sox | 0.79 |
| 10 | Edward Mujica | Cardinals | 0.79 |
| 11 | Greg Holland | Royals | 0.79 |
| 12 | Jesse Crain | White Sox | 0.78 |
| 13 | Kenley Jansen | Dodgers | 0.75 |
| 14 | Trevor Rosenthal | Cardinals | 0.74 |
| 15 | Kevin Gregg | Cubs | 0.74 |
| 16 | Brett Cecil | Blue Jays | 0.73 |
| 17 | Glen Perkins | Twins | 0.73 |
| 18 | Preston Claiborne | Yankees | 0.72 |
| 19 | Sam LeCure | Reds | 0.72 |
| 20 | Robbie Ross | Rangers | 0.71 |
| 21 | Oliver Perez | Mariners | 0.69 |
| 22 | Joe Thatcher | Padres | 0.66 |
| 23 | Casey Janssen | Blue Jays | 0.64 |
| 24 | Boone Logan | Yankees | 0.61 |
| 25 | Sean Doolittle | Athletics | 0.6 |
| 26 | Tommy Hunter | Orioles | 0.6 |
| 27 | Junichi Tazawa | Red Sox | 0.6 |
| 28 | Josh Collmenter | Diamondbacks | 0.58 |
| 29 | Craig Kimbrel | Braves | 0.58 |
| 30 | Casey Fien | Twins | 0.57 |
| 31 | Brad Ziegler | Diamondbacks | 0.57 |
| 32 | Edgmer Escalona | Rockies | 0.56 |
| 33 | Vin Mazzaro | Pirates | 0.53 |
| 34 | Tyson Ross | Padres | 0.51 |
| 35 | Brandon Kintzler | Brewers | 0.49 |
| 36 | Shawn Kelley | Yankees | 0.49 |
| 37 | Jim Henderson | Brewers | 0.49 |
| 38 | Tanner Scheppers | Rangers | 0.47 |
| 39 | Brian Matusz | Orioles | 0.46 |
| 40 | Tim Collins | Royals | 0.46 |
| 41 | Luis Avilan | Braves | 0.46 |
| 42 | Joel Peralta | Rays | 0.44 |
| 43 | Andrew Miller | Red Sox | 0.43 |
| 44 | Matt Reynolds | Diamondbacks | 0.43 |
| 45 | Chad Gaudin | Giants | 0.43 |
| 46 | Ryan Cook | Athletics | 0.42 |
| 47 | Aroldis Chapman | Reds | 0.42 |
| 48 | James Russell | Cubs | 0.42 |
| 49 | Scott Downs | Angels | 0.42 |
| 50 | Joe Smith | Indians | 0.42 |
| 51 | Luke Gregerson | Padres | 0.4 |
| 52 | Rafael Soriano | Nationals | 0.39 |
| 53 | David Robertson | Yankees | 0.38 |
| 54 | Dale Thayer | Padres | 0.38 |
| 55 | Jonathan Papelbon | Phillies | 0.38 |
| 56 | Matt Belisle | Rockies | 0.37 |
| 57 | Michael Kohn | Angels | 0.36 |
| 58 | Seth Maness | Cardinals | 0.36 |
| 59 | Rafael Betancourt | Rockies | 0.35 |
| 60 | Darren O’Day | Orioles | 0.35 |
| 61 | Nate Jones | White Sox | 0.35 |
| 62 | Josh Outman | Rockies | 0.35 |
| 63 | John Axford | Brewers | 0.35 |
| 64 | Ernesto Frieri | Angels | 0.33 |
| 65 | Rex Brothers | Rockies | 0.32 |
| 66 | Bobby Parnell | Mets | 0.32 |
| 67 | Chad Qualls | Marlins | 0.32 |
| 68 | Addison Reed | White Sox | 0.31 |
| 69 | Tom Gorzelanny | Brewers | 0.31 |
| 70 | Grant Balfour | Athletics | 0.3 |
| 71 | Justin Wilson | Pirates | 0.27 |
| 72 | Anthony Varvaro | Braves | 0.27 |
| 73 | Jerome Williams | Angels | 0.26 |
| 74 | Paco Rodriguez | Dodgers | 0.25 |
| 75 | Luke Hochevar | Royals | 0.25 |
| 76 | J.P. Howell | Dodgers | 0.24 |
| 77 | Jamey Wright | Rays | 0.23 |
| 78 | Matt Thornton | White Sox | 0.23 |
| 79 | Cody Allen | Indians | 0.22 |
| 80 | Jason Frasor | Rangers | 0.22 |
| 81 | Pat Neshek | Athletics | 0.21 |
| 82 | Steve Delabar | Blue Jays | 0.21 |
| 83 | Greg Burke | Mets | 0.2 |
| 84 | Troy Patton | Orioles | 0.2 |
| 85 | Jean Machi | Giants | 0.2 |
| 86 | Alfredo Simon | Reds | 0.19 |
| 87 | Antonio Bastardo | Phillies | 0.19 |
| 88 | Drew Storen | Nationals | 0.19 |
| 89 | Bryan Shaw | Indians | 0.18 |
| 90 | Tony Watson | Pirates | 0.18 |
| 91 | Adam Warren | Yankees | 0.17 |
| 92 | Tyler Clippard | Nationals | 0.17 |
| 93 | Anthony Swarzak | Twins | 0.17 |
| 94 | Craig Breslow | Red Sox | 0.17 |
| 95 | Steve Cishek | Marlins | 0.14 |
| 96 | Aaron Loup | Blue Jays | 0.13 |
| 97 | Dane de la Rosa | Angels | 0.13 |
| 98 | Brian Duensing | Twins | 0.12 |
| 99 | Alfredo Figaro | Brewers | 0.12 |
| 100 | Carter Capps | Mariners | 0.11 |
| 101 | Charlie Furbush | Mariners | 0.11 |
| 102 | Jesse Chavez | Athletics | 0.1 |
| 103 | Adam Ottavino | Rockies | 0.09 |
| 104 | Jared Burton | Twins | 0.08 |
| 105 | Craig Stammen | Nationals | 0.08 |
| 106 | Matt Lindstrom | White Sox | 0.08 |
| 107 | Joe Kelly | Cardinals | 0.07 |
| 108 | Jose Veras | Astros | 0.05 |
| 109 | Ryan Webb | Marlins | 0.04 |
| 110 | Joe Nathan | Rangers | 0.04 |
| 111 | Wesley Wright | Astros | 0.03 |
| 112 | Jim Johnson | Orioles | 0.03 |
| 113 | Yoervis Medina | Mariners | 0.02 |
| 114 | Bryan Morris | Pirates | 0.01 |
| 115 | LaTroy Hawkins | Mets | 0 |
| 116 | Aaron Crow | Royals | 0 |
| 117 | Jose Cisnero | Astros | -0.01 |
| 118 | Ryan Pressly | Twins | -0.01 |
| 119 | Burke Badenhop | Brewers | -0.01 |
| 120 | Cesar Ramos | Rays | -0.01 |
| 121 | Fernando Rodney | Rays | -0.02 |
| 122 | Darin Downs | Tigers | -0.03 |
| 123 | Tim Stauffer | Padres | -0.03 |
| 124 | Cory Gearrin | Braves | -0.06 |
| 125 | Mike Dunn | Marlins | -0.06 |
| 126 | Matt Albers | Indians | -0.07 |
| 127 | David Hernandez | Diamondbacks | -0.07 |
| 128 | Joe Ortiz | Rangers | -0.08 |
| 129 | Jerry Blevins | Athletics | -0.08 |
| 130 | Wilton Lopez | Rockies | -0.08 |
| 131 | Jose Mijares | Giants | -0.08 |
| 132 | J.J. Hoover | Reds | -0.1 |
| 133 | Tom Wilhelmsen | Mariners | -0.12 |
| 134 | Andrew Bailey | Red Sox | -0.13 |
| 135 | Mariano Rivera | Yankees | -0.13 |
| 136 | Alex Wilson | Red Sox | -0.15 |
| 137 | Brad Lincoln | Blue Jays | -0.16 |
| 138 | Vinnie Pestano | Indians | -0.16 |
| 139 | Paul Clemens | Astros | -0.17 |
| 140 | Josh Roenicke | Twins | -0.18 |
| 141 | Hector Ambriz | Astros | -0.19 |
| 142 | Darren Oliver | Blue Jays | -0.19 |
| 143 | Scott Rice | Mets | -0.19 |
| 144 | Nick Hagadone | Indians | -0.2 |
| 145 | Phil Coke | Tigers | -0.25 |
| 146 | Jonathan Broxton | Reds | -0.25 |
| 147 | Jake McGee | Rays | -0.25 |
| 148 | Brandon Lyon | Mets | -0.26 |
| 149 | A.J. Ramos | Marlins | -0.26 |
| 150 | Tony Sipp | Diamondbacks | -0.27 |
| 151 | Michael Gonzalez | Brewers | -0.28 |
| 152 | Matt Guerrier | Dodgers | -0.29 |
| 153 | Blake Beavan | Mariners | -0.29 |
| 154 | George Kontos | Giants | -0.33 |
| 155 | Logan Ondrusek | Reds | -0.34 |
| 156 | Garrett Richards | Angels | -0.37 |
| 157 | Heath Bell | Diamondbacks | -0.38 |
| 158 | Mike Adams | Phillies | -0.39 |
| 159 | Clayton Mortensen | Red Sox | -0.4 |
| 160 | T.J. McFarland | Orioles | -0.4 |
| 161 | Rich Hill | Indians | -0.47 |
| 162 | Travis Blackley | Astros | -0.48 |
| 163 | Henry Rodriguez | – – – | -0.48 |
| 164 | Esmil Rogers | Blue Jays | -0.5 |
| 165 | Ronald Belisario | Dodgers | -0.5 |
| 166 | Kyle Farnsworth | Rays | -0.53 |
| 167 | Bruce Chen | Royals | -0.59 |
| 168 | Jeremy Horst | Phillies | -0.59 |
| 169 | Jeremy Affeldt | Giants | -0.61 |
| 170 | Kelvin Herrera | Royals | -0.68 |
| 171 | Michael Kirkman | Rangers | -0.71 |
| 172 | Carlos Marmol | Cubs | -0.72 |
| 173 | Huston Street | Padres | -0.77 |
| 174 | Shawn Camp | Cubs | -0.83 |
| 175 | Anthony Bass | Padres | -0.94 |
| 176 | Pedro Strop | Orioles | -1.08 |
| 177 | Hector Rondon | Cubs | -1.13 |
| 178 | Brandon League | Dodgers | -1.6 |
The Morning Edition (June 30, 2013)
From Last Night:
- Chris Davis homers twice to reach #30 as the O’s smack the Yanks
- Jacob Turner twirls his first CG, drops 7 K on the Padres
- Wainwright goes the distance again to beat the A’s, Parker leaves with an injury
- Cuddyer extends the streak to 26 as the Rockies spoil 8 great innings from Cain
- Liriano solid as the Bucs are the first to 50
- Mesoraco lifts the Reds in the 11th
- Soriano’s 11th inning HR beats the M’s
- Bautista homers twice to beat the Sox
What I’m Watching Today:
- Zack Wheeler pitches at Citi Field for the first time (1p Eastern)
- Chris Sale looks to jump onto the Appointment TV list (2p Eastern)
- Latos and Darvish in Arlington (3p Eastern)
- Bonderman! (4p Eastern)
- The underrated Madison Bumgarner (4p Eastern)
The Big Question:
- Will Chris Sale have another great outing?
I’ve often chided Sale for his delivery because it looks like he’s about to require TJ surgery after every pitch, but it’s working for him and he’s healthy so far. He’s also had a couple of great outings lately that his team didn’t support very well and he’s looking to keep at least half of that equation going. As I prepare to update the Appointment TV list of starters on Tuesday, Sale is definitely on notice. Another great start and he’s a lock. A solid one and he should still make it easily. Sale’s currently 13th among starters in WAR with 2.7 and has improved across the board this season after a very strong 2012. His platoon splits are fun to look at, too. The strikeouts and walks are pretty similar, but man is the triple slash line crazy. Lefties don’t strikeout more or walk much less than righties, but they are essentially helpless. They have ZERO extra base hits.

I would recommend Francona avoid playing his lefties. Just a thought. Or outlaw the slider.
The Nine Best Seasons Under 9 Wins
At New English D we’re among the those who wish to see the pitcher win removed from our baseball consciousness. It doesn’t measure an individual pitcher’s skill, but that’s how people use it. A pitcher’s won-loss record is about his performance, but it’s also about his defense, his run support, the other starting pitcher, and the other team’s offense. Also, luck, but I’m fine with luck.
Our most recent podcast covers the topic at length, but evidence and examples can do more to convince you about the flaws of wins than my rambling ever could. The catalyst for this post comes from something I discovered last night when contributing to Brian Kenny’s noble effort to #KillTheWin:
Matt Harvey (Go Heels!) is better in games he doesn’t win than almost every other pitcher in the league is overall. It’s time we get his back.
The rules are simple, these are The Nine best season by Wins Above Replacement (WAR) for qualifying starting pitchers who won fewer than nine games. In MLB history, there are 8286 qualifying seasons from 1901-2012 with 1187 finishing with fewer than 9 wins. These are the best.
9. Cliff Lee, 2012 Phillies
6-9, 211 IP, 3.16 ERA, 3.13 FIP, 4.9 WAR
8. Ken Johnson, 1962 Colt .45s
7-16, 197 IP, 3.84 ERA, 2.80 FIP, 5.0 WAR
7. Dutch Leonard, 1949 Cubs
7-16, 180 IP, 4.15 ERA, 2.71 FIP, 5.0 WAR
6. Bill Gullickson, 1981 Expos
7-9, 157.1 IP, 2.80 ERA, 2.11 FIP, 5.0 WAR
5. Al Benton, 1942 Tigers
7-13, 226.2 IP, 2.90 ERA, 3.07 FIP, 5.0 WAR
4. Steve Rogers, 1976 Expos
7-17, 230 IP, 3.25 ERA, 2.85 FIP, 5.1 WAR
3. Bob Welch, 1986 Dodgers
7-13, 235.2 IP, 3.28 ERA, 2.78 FIP, 5.3 WAR
2. Curt Schilling, 2003 Diamondbacks
8-9, 168 IP, 2.95 ERA, 2.66 FIP, 5.7 WAR
1. Nolan Ryan, 1987 Astros
8-16, 211.2 IP, 2.76 ERA, 2.47 FIP, 6.6 WAR
Wins generally correlate with good performance, but there are many cases in which good performances don’t result in wins and bad performances do. Pitchers can improve their likelihood of victory by pitching well, but they can’t guarantee it. Wins aren’t a completely useless measure of pitcher performance, but when we have so many statistics that are dramatically better, why should be place any importance on wins?
Here’s some evidence writ large. If we use Wins to predict three other statistics, WAR, ERA, and FIP, it doesn’t look good for wins.
| WAR | ERA | FIP | |
| Adjusted R Squared | 0.38 | 0.24 | 0.13 |
What these numbers tell us is that 38, 24, and 13% of the variation in these numbers can be explained by variation in wins. Let’s give Wins the benefit of the doubt and pick WAR for the graph. There is a clear trend, but there is a lot of variation in WAR that wins can’t explain. The sample size here is over 8,000. You can be both terrible and amazing and achieve the same number of wins.

It’s time to #KillTheWin.
The Morning Edition (June 29, 2013)
From Last Night:
- Indians beat the Sox 19-10 in game one of a DH, Casper Wells (the OF!) is the only Sox arm not to allow a hit
- Harvey goes 7, gives up 3 H, 1 ER, 0 BB, 10 K…doesn’t get a win and the Mets lose
- Teheran K’s 10 Dbacks, Braves win 3-0
- CC dominates early, but the Orioles get to him late to win 4-3
- The Pirates big inning backs Cole’s victory
- Miller gets chased early in Oakland
- Cuddyer takes the hit streak to 25
What I’m Watching Today:
- Wainwright duels Parker in Oakland (4p Eastern)
- Turner welcomes the Friars to Miami (7p Eastern)
- Liriano tries to keep up his ’06 impression (7p Eastern)
- Lee and Ryu in LA (10p Eastern)
The Big Question:
- Is it time to track Cuddyer?
On an eventful Friday, three things stood out most. First, the Indians and White Sox played an insane game that featured former Tigers outfielder throwing a scoreless inning. Second, Matt Harvey threw another brilliant gem that his team coughed up. Third, Michael Cuddyer has now crossed the 25 game mark on his hit streak. I usually take notice around 20 and lock in past 25. I’m in love with hit streak chases because DiMaggio’s 56 game streak is the the single most impressive record in professional sports and any attempt to get near it is so impressive. Cuddyer only needs three more hits to be halfway. Wow.
The Morning Edition (June 28, 2013)
From Last Night:
- Holland pitches a 2 hit shutout against the Yanks
- Boston unloads on the Jays, hang on to win 7-4
- Byrd’s 8th inning HR lifts the Mets
- Strasburg and Corbin pitch well, but an 11th inning hit from Gregorious beats the Nats
- Garza dominates the Brewers
- Kluber gets shelled
What I’m Watching Today:
- Cole looks to keep the Pirates hot (7p Eastern)
- Matt Harvey faces the Nationals, strikeouts in the forecast (7p Eastern)
- James Shields attempts to further discredit “wins” as a statistics (8p Eastern)
- Miller heads to Oakland to matchup with Colon (10p Eastern)
- Iwakuma welcomes the Cubs to Safeco (10p Eastern)
The Big Question:
- Is this finally the year for the Pirates?
As I write this, the Pirates are tied for the best record in baseball and could play pretty terrible baseball the rest of the way and still finish above .500. They’ve had great first halves the last two seasons and faded during the dog days, but they probably have what it takes to hang in this. On this day last season, they were 39-35, this year they are 48-30. That’s a lot better. But the offense is 19th in baseball in wRC+ and the starting pitching is 20th in WAR with the bullpen at 19th. They have the 5th best defense by UZR, which helps suppress the ERA and win games. I’m not sure I’m buying them as a playoff team just yet, but I’m pretty confident they are good enough not to lose more than half their games.
The Morning Edition (June 27, 2013)
From Last Night:
- Marcum goes 8 scoreless to beat the Sox
- Gordon walks off on the Braves
- Kazmir flirts with a no-hitter, but it took a Johnson blown save to win it
- Zimmermann leads the Nats over the Dbacks
- Lackey dominates the Rockies
- Felix strikes out 11, gives up 2 ER, somehow doesn’t win…
- AJ Griffin CGSO
- Dickey CGSO
What I’m Watching Today:
- Corbin and Strasburg in DC (4p Eastern)
- NERD favorite Kluber in Baltimore (7p Eastern)
- Greinke faces the Phillies, hopes not to get in a fight (10p Eastern)
The Big Question:
- Didn’t 2B used to be a glove first position?
We live in a world in which Robinson Cano is 5th among 2B in WAR this season. Carpenter and Kipnis are taking the league by storm and Pedroia and Kendrick are ahead of him too. Cano is 7th among qualifiers in wRC+ for 2B. When did this happen? I remember just a couple seasons back you had like two second basemen who could hit and everyone else was Ramon Santiago. The game is changing, it’s pretty cool. Here’s Dave Cameron writing on a similar subject a little ways back.
A New Way To Measure Relief Pitchers: SOEFA
I’ve long been a critic of the save statistic, and I don’t need to rehash why it’s the scourge of the baseball world, but relief pitching is still an important part of the game and we often struggle to properly measure it. Won/Loss record and saves tell you nothing about a player’s individual skill, especially not relievers, and even things like ERA don’t do a lot of good because relievers aren’t charged for runners they let in belonging to another pitcher and can get charged with runs allowed by the pitchers who come after.
Strikeouts, walks, and homeruns allowed (the basis of FIP) are good measurements, but FIP inherently strips away context. And context does matter for relief pitchers. It’s an elite reliever’s job to come in and strand runners, so strikeouts are good and homeruns are bad, but sequencing is really important and it matters a lot when they get outs and when they allow baserunners.
In a sense, FIP and similar statistics are good, but they aren’t perfect because they’re context neutral and we might want some context in reliever stats. Win Probability Added (WPA) is a typical way to fix this, but this feels too context dependent for me. WAR is always a nice combination of these kinds of measures, but WAR is a counting stat so how much a reliever is used matters a lot, and relievers are often used incorrectly.
My point here is not that I can come up with something better, but rather that I want to try to add something. I always look at reliever stats and find logical holes more often than with position players and starters. I want a reliever stat that measures context, considers the peripheral numbers, and also understands the luck involved. I didn’t find one out there that satisfied me, so I went to work inventing one.
I’ll say this. This isn’t perfect and I want to improve it. Flaws you may find in the method should not cause you to discount it, but rather to add to the discussion. This is a first crack. I hope you find it useful.
The Goal
So first, I started with a question: What is the job of a relief pitcher? Here was my answer:
- Strand runners
- Don’t allow baserunners
- If you allow baserunners, don’t let them score.
With that outlined, I went to work thinking about how to measure each and came up with the following statistic that I will call SOEFA, pronounced like “sofa.” It stands for Strand On-base ERA FIP Average and should be thought of as a way to measure relievers from your sofa. Yes, I have a whimsical side.
It has four components, let’s walk through them.
The Formula
First is Strand Rate+, which I calculated as what percent better or worse a reliever is from league average at stranding runners. League average is 70%, so if you strand 100% of your inherited runners, your Strand Rate+ is .43 because you are 43% better than league average.
Second, is your Expected OBP+ or xOBP+ which is your opponents on base percentage calculated as a percentage deviation from league average just like SR+, except that I regress your hits allowed based on league average BABIP because sometimes batters get lucky hits.
Third, is my version or ERA+, which is just like normal ERA- except I scale mine to zero instead of 100 like the major stat sites and invert it. Same principles regarding deviation from average applies. FIP+ is exactly the same, except I use FIP-. These numbers are park adjusted.
To combine them, I add SR+ to xOBP+ and then add ERA+ to get eSOEFA. I then repeat the same process and replace ERA+ with FIP+ to get fSOEFA. A pitcher’s SOEFA score is the average between the two.
The output gives you a number that sets league average at zero and ranges technically from negative infinity to about 2.5, but generally speaking you won’t see a reliever fall below -2.5. Basically it’s a -3 to 3 scale that puts good relievers on the plus side and bad ones on the negative side.
Additionally, at my discretion, relievers who have inherited fewer than five baserunners during the season (this number will likely be fluid based on where we are in the season) are given a league average SR+ so that if you don’t ever inherit runners you aren’t unfairly punished because you are not given sufficient opportunity to strand them or you are not given credit for an awesome strand rate if you strand the only runner you inherit.
I’m pretty happy with the first round of results. The first run of results came from stats entering June 25th and it generally lines up with my impression of the best performing relief pitchers in baseball. I have no idea if this stat is predictive or how long it takes to stabilize. Right now, it correlates with ERA and FIP at -.73 and -.75 despite the fact that each is only 1/6 of the input and the R squared is around .6 using it to predict FIP, if those kinds of things interest you.
It’s experimental. It’s meant to be fun and maybe helpful.
A word of note is that Fangraphs and B-R seem to use different cutoffs for which relievers “qualify,” so this output may be missing a few relievers. I’m sorry about that. The great thing about this statistic is that I can easily produce the number for any reliever in baseball in less than two minutes. If you want to know how a reliever measures up or how a reliever did during a given season, just ask and I can provide the number based on a handy program I wrote. Hit me on Twitter @NeilWeinberg44 and I’d be happy to provide the SOEFA for any reliever.
Thanks for reading and I welcome any feedback. Who knows, maybe this will work.
Below are the SOEFA for the vast majority of qualifying relievers up through 6/24/13. If you want to know the SOEFA of a reliever not on this list or would like an update score, please let me know.
| Rank | Player | Team | SOEFA |
| 1 | Sergio Romo | Giants | 0.99 |
| 2 | Jason Grilli | Pirates | 0.95 |
| 3 | Junichi Tazawa | Red Sox | 0.92 |
| 4 | Kevin Gregg | Cubs | 0.92 |
| 5 | Drew Smyly | Tigers | 0.9 |
| 6 | Joaquin Benoit | Tigers | 0.89 |
| 7 | Jordan Walden | Braves | 0.88 |
| 8 | Robbie Ross | Rangers | 0.87 |
| 9 | Mark Melancon | Pirates | 0.85 |
| 10 | Jesse Crain | White Sox | 0.83 |
| 11 | Edward Mujica | Cardinals | 0.79 |
| 12 | Brett Cecil | Blue Jays | 0.79 |
| 13 | Greg Holland | Royals | 0.75 |
| 14 | Oliver Perez | Mariners | 0.74 |
| 15 | Trevor Rosenthal | Cardinals | 0.74 |
| 16 | Kenley Jansen | Dodgers | 0.72 |
| 17 | Glen Perkins | Twins | 0.71 |
| 18 | Koji Uehara | Red Sox | 0.7 |
| 19 | Preston Claiborne | Yankees | 0.69 |
| 20 | Sam LeCure | Reds | 0.68 |
| 21 | Casey Janssen | Blue Jays | 0.64 |
| 22 | Mariano Rivera | Yankees | 0.63 |
| 23 | Luke Gregerson | Padres | 0.62 |
| 24 | Craig Kimbrel | Braves | 0.62 |
| 25 | Sean Doolittle | Athletics | 0.6 |
| 26 | Edgmer Escalona | Rockies | 0.56 |
| 27 | Tommy Hunter | Orioles | 0.56 |
| 28 | Brad Ziegler | Diamondbacks | 0.54 |
| 29 | Joe Nathan | Rangers | 0.53 |
| 30 | Joe Smith | Indians | 0.53 |
| 31 | Vin Mazzaro | Pirates | 0.51 |
| 32 | Jim Henderson | Brewers | 0.5 |
| 33 | James Russell | Cubs | 0.49 |
| 34 | Casey Fien | Twins | 0.48 |
| 35 | Tim Collins | Royals | 0.47 |
| 36 | Shawn Kelley | Yankees | 0.47 |
| 37 | Brian Matusz | Orioles | 0.46 |
| 38 | Addison Reed | White Sox | 0.46 |
| 39 | Tanner Scheppers | Rangers | 0.45 |
| 40 | Rafael Soriano | Nationals | 0.44 |
| 41 | Aroldis Chapman | Reds | 0.44 |
| 42 | Joel Peralta | Rays | 0.43 |
| 43 | Matt Reynolds | Diamondbacks | 0.43 |
| 44 | Brandon Kintzler | Brewers | 0.43 |
| 45 | Ryan Cook | Athletics | 0.42 |
| 46 | Chad Qualls | Marlins | 0.42 |
| 47 | Cody Allen | Indians | 0.4 |
| 48 | Andrew Miller | Red Sox | 0.4 |
| 49 | David Robertson | Yankees | 0.38 |
| 50 | Seth Maness | Cardinals | 0.36 |
| 51 | Bobby Parnell | Mets | 0.36 |
| 52 | Matt Belisle | Rockies | 0.36 |
| 53 | Josh Outman | Rockies | 0.36 |
| 54 | Rex Brothers | Rockies | 0.35 |
| 55 | Jonathan Papelbon | Phillies | 0.35 |
| 56 | Dale Thayer | Padres | 0.35 |
| 57 | Darren O’Day | Orioles | 0.33 |
| 58 | Justin Wilson | Pirates | 0.33 |
| 59 | Luke Hochevar | Royals | 0.31 |
| 60 | Grant Balfour | Athletics | 0.3 |
| 61 | John Axford | Brewers | 0.29 |
| 62 | Ernesto Frieri | Angels | 0.29 |
| 63 | Drew Storen | Nationals | 0.27 |
| 64 | Bryan Shaw | Indians | 0.26 |
| 65 | Nate Jones | White Sox | 0.26 |
| 66 | Luis Avilan | Braves | 0.25 |
| 67 | Anthony Varvaro | Braves | 0.25 |
| 68 | Anthony Swarzak | Twins | 0.24 |
| 69 | Paco Rodriguez | Dodgers | 0.24 |
| 70 | Jean Machi | Giants | 0.2 |
| 71 | Tyler Clippard | Nationals | 0.19 |
| 72 | Matt Thornton | White Sox | 0.19 |
| 73 | Steve Delabar | Blue Jays | 0.18 |
| 74 | Craig Stammen | Nationals | 0.17 |
| 75 | Tony Watson | Pirates | 0.17 |
| 76 | Pat Neshek | Athletics | 0.16 |
| 77 | Jamey Wright | Rays | 0.16 |
| 78 | J.P. Howell | Dodgers | 0.16 |
| 79 | Cesar Ramos | Rays | 0.15 |
| 80 | Alfredo Simon | Reds | 0.15 |
| 81 | Troy Patton | Orioles | 0.15 |
| 82 | Matt Lindstrom | White Sox | 0.14 |
| 83 | Jim Johnson | Orioles | 0.12 |
| 84 | Carter Capps | Mariners | 0.11 |
| 85 | Ryan Pressly | Twins | 0.11 |
| 86 | Steve Cishek | Marlins | 0.11 |
| 87 | Darin Downs | Tigers | 0.1 |
| 88 | Antonio Bastardo | Phillies | 0.09 |
| 89 | Charlie Furbush | Mariners | 0.07 |
| 90 | Brian Duensing | Twins | 0.07 |
| 91 | Yoervis Medina | Mariners | 0.07 |
| 92 | Jerry Blevins | Athletics | 0.07 |
| 93 | Tom Gorzelanny | Brewers | 0.06 |
| 94 | Jared Burton | Twins | 0.05 |
| 95 | Jose Veras | Astros | 0.05 |
| 96 | Joe Kelly | Cardinals | 0.05 |
| 97 | David Hernandez | Diamondbacks | 0.04 |
| 98 | Ryan Webb | Marlins | 0.04 |
| 99 | Aaron Loup | Blue Jays | 0.03 |
| 100 | Wesley Wright | Astros | 0.01 |
| 101 | Bryan Morris | Pirates | 0.01 |
| 102 | Burke Badenhop | Brewers | 0 |
| 103 | Dane de la Rosa | Angels | -0.02 |
| 104 | Adam Ottavino | Rockies | -0.04 |
| 105 | LaTroy Hawkins | Mets | -0.04 |
| 106 | Cory Gearrin | Braves | -0.06 |
| 107 | Joe Ortiz | Rangers | -0.08 |
| 108 | Wilton Lopez | Rockies | -0.08 |
| 109 | Brandon Lyon | Mets | -0.08 |
| 110 | J.J. Hoover | Reds | -0.08 |
| 111 | Mike Dunn | Marlins | -0.09 |
| 112 | Fernando Rodney | Rays | -0.1 |
| 113 | Hector Ambriz | Astros | -0.1 |
| 114 | Paul Clemens | Astros | -0.13 |
| 115 | Tom Wilhelmsen | Mariners | -0.13 |
| 116 | Matt Guerrier | Dodgers | -0.13 |
| 117 | Josh Roenicke | Twins | -0.17 |
| 118 | Jose Mijares | Giants | -0.21 |
| 119 | Michael Gonzalez | Brewers | -0.23 |
| 120 | Jonathan Broxton | Reds | -0.25 |
| 121 | Jake McGee | Rays | -0.25 |
| 122 | Matt Albers | Indians | -0.26 |
| 123 | A.J. Ramos | Marlins | -0.26 |
| 124 | Scott Rice | Mets | -0.29 |
| 125 | Nick Hagadone | Indians | -0.31 |
| 126 | Travis Blackley | Astros | -0.33 |
| 127 | Vinnie Pestano | Indians | -0.34 |
| 128 | George Kontos | Giants | -0.35 |
| 129 | Mike Adams | Phillies | -0.39 |
| 130 | Clayton Mortensen | Red Sox | -0.4 |
| 131 | Garrett Richards | Angels | -0.43 |
| 132 | Heath Bell | Diamondbacks | -0.46 |
| 133 | Esmil Rogers | Blue Jays | -0.5 |
| 134 | Ronald Belisario | Dodgers | -0.51 |
| 135 | Jeremy Affeldt | Giants | -0.55 |
| 136 | Brandon League | Dodgers | -0.55 |
| 137 | Jeremy Horst | Phillies | -0.58 |
| 138 | Kelvin Herrera | Royals | -0.67 |
| 139 | Carlos Marmol | Cubs | -0.72 |
| 140 | Huston Street | Padres | -0.82 |
| 141 | Anthony Bass | Padres | -0.94 |
| 142 | Hector Rondon | Cubs | -1.24 |
Dynamic Standings Projection (June 26, 2013)
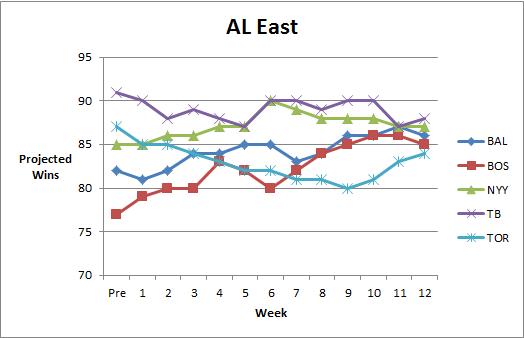
In case you missed it, in April we launched our Dynamic Standings Projection feature on New English D. A full explanation of the methodology can be found here or by clicking the tab at the top of the page. This project seeks to provide a reasoned and cautious approach to updating our beliefs about the baseball future. You can find a summarization of the original projections here. You’ll notice a column on the far right that indicates the difference in projected wins from the preseason prediction. Positive numbers mean teams are now projected to win more games and negative numbers mean a team is now projected to win fewer games. You’ll notice a series of graphs below the standings section that track how the projections have evolved over the course of the year.
This Dynamic Standings Projection is updated through the June 25 games.
| 26-Jun | W | L | PreDiff | |
| TB | 88 | 74 | 0.543 | -3 |
| NYY | 87 | 75 | 0.537 | 2 |
| BAL | 86 | 76 | 0.531 | 4 |
| BOS | 85 | 77 | 0.525 | 8 |
| TOR | 84 | 78 | 0.519 | -3 |
| W | L | PreDiff | ||
| DET | 92 | 70 | 0.568 | -2 |
| CWS | 77 | 85 | 0.475 | -6 |
| CLE | 77 | 85 | 0.475 | 6 |
| KC | 76 | 86 | 0.469 | 0 |
| MIN | 70 | 92 | 0.432 | 5 |
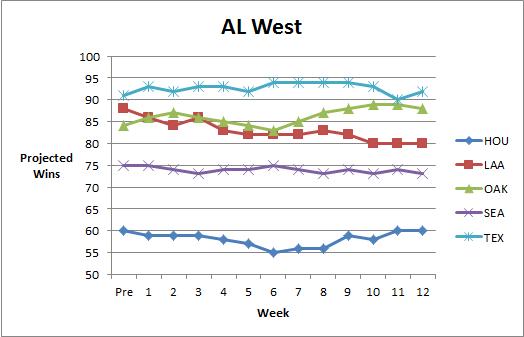
| W | L | PreDiff | ||
| TEX | 92 | 70 | 0.568 | 1 |
| OAK | 88 | 74 | 0.543 | 4 |
| LAA | 80 | 82 | 0.494 | -8 |
| SEA | 73 | 89 | 0.451 | -2 |
| HOU | 60 | 102 | 0.370 | 0 |
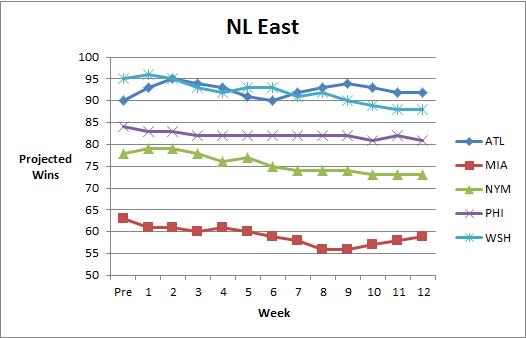
| W | L | PreDiff | ||
| ATL | 92 | 70 | 0.568 | 2 |
| WSH | 88 | 74 | 0.543 | -7 |
| PHI | 81 | 81 | 0.500 | -3 |
| NYM | 73 | 89 | 0.451 | -5 |
| MIA | 59 | 103 | 0.364 | -4 |
| W | L | PreDiff | ||
| STL | 94 | 68 | 0.580 | 6 |
| CIN | 93 | 69 | 0.574 | 1 |
| PIT | 90 | 72 | 0.556 | 8 |
| MIL | 74 | 88 | 0.457 | -5 |
| CHC | 68 | 94 | 0.420 | 0 |
| W | L | PreDiff | ||
| SF | 86 | 76 | 0.531 | -5 |
| ARZ | 85 | 77 | 0.525 | 3 |
| LAD | 81 | 81 | 0.500 | -7 |
| SD | 79 | 83 | 0.488 | 1 |
| COL | 72 | 90 | 0.444 | 9 |


The Morning Edition (June 26, 2013)
From Last Night:
- Chris Sale went 8, gave up 2 ER, had 13 K and left with the lead. He didn’t get the win. The guy who blew the save did.
- Matt Moore does a Matt Moore impression with 11 K and 6 BB, wins
- The Red Sox score 11 without a HR
- Ichiro walks off as Darvish and Kuroda are ordinary
- Casilla hit as many homeruns as Chris Davis, 1 each
What I’m Watching Today:
- Felix faces the Pirates (330p Eastern)
- Zimmermann takes the hill (7p Eastern)
- Cole Hamels against the Padres (10p Eastern)
- Kershaw and Lincecum (10p Eastern)
The Big Question:
- Come on guys, can we leave Chris Sale alone?
Seriously, I want to discredit the win stat too, but can it not keep happening to the same guy. But. BUT! Let’s play a game regarding Astros pitcher Erik Bedard. Let’s explore his ERA and FIP by month:

He’s getting a lot better each month. This is good news. I bet he’s striking out more batters than he was at the beginning of the season.
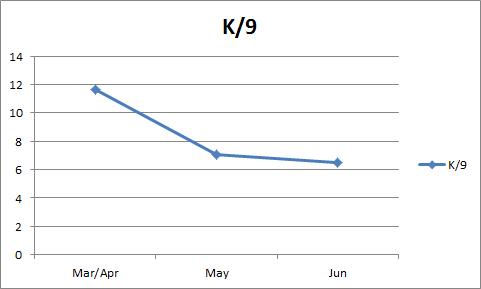
Oh. Well. I bet he’s walking fewer people!
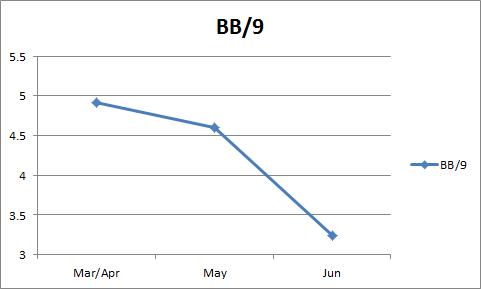
Well he is, but he’s still walking and awful lot of people. Hmmm, this is tricky. Maybe it’s because he is allowing fewer homeruns?

Yeah, that’s probably it. Sorry, Bedard this probably isn’t sustainable!
